Measurement of the Decay Asymmetry and Branching Fraction
Abstract
In data taken with the NA48 experiment at the CERN SPS in 1999, 730 candidates of the weak radiative hyperon decay have been found with an estimated background of events. From these events the decay asymmetry has been determined to , which is the first evidence of a decay asymmetry in . The branching fraction of the decay has been measured to be .
, , , , , , , , , , , ††thanks: Funded by the U.K. Particle Physics and Astronomy Research Council ††thanks: Present address: Rutherford Appleton Laboratory, Chilton, Didcot, Oxon, OX11 0QX, U.K. , , , , , , , , , , , , , , , , , , , , ††thanks: Present address: Istituto di Cosmogeofisica del CNR di Torino, I-10133 Torino, Italy ††thanks: Present address: Dipartimento di Fisica, Scuola Normale Superiore e Sezione dell’INFN di Pisa, I-56100 Pisa, Italy ††thanks: Present address: Northwestern University, Department of Physics and Astronomy, Evanston, IL 60208, USA ††thanks: Present address: Dipartimento di Fisica dell’Università e Sezione dell’INFN di Ferrara, I-44100 Ferrara, Italy
, , , , , , , , , ††thanks: Present address: EP Division, CERN, CH-1211 Genève 23, Switzerland ††thanks: Present address: Carnegie Mellon University, Pittsburgh, PA 15213, USA , , , ††thanks: Present address: Laboratoire de l’Accélérateur Linéaire, IN2P3-CNRS,Université de Paris-Sud, 91898 Orsay, France , , , , , , , ††thanks: Present address: Joint Institute for Nuclear Research, Dubna, 141980, Russian Federation
, , , , , , , ††thanks: Dipartimento di Fisica dell’Università di Modena e Reggio Emilia, I-41100 Modena, Italy ††thanks: Present address: DSM/DAPNIA - CEA Saclay, F-91191 Gif-sur-Yvette, France ††thanks: Istituto di Fisica dell’Università di Urbino, I-61029 Urbino, Italy , , , , , , , , , , , , , , , , , , ††thanks: Funded by the German Federal Minister for Research and Technology (BMBF) under contract 7MZ18P(4)-TP2 ††thanks: Present address: DESY Hamburg, D-22607 Hamburg, Germany ††thanks: Present address: SLAC, Stanford, CA 94025, USA , , , , , ††thanks: Funded by Institut National de Physique des Particules et de Physique Nucléaire (IN2P3), France , , , , , , , , , , , , , , , , , , , , , , , , , , , , ††thanks: Funded by the German Federal Minister for Research and Technology (BMBF) under contract 056SI74
, , , , , , , , , , ††thanks: Supported by the KBN under contract SPUB-M/CERN/P03/DZ210/2000 and using computing resources of the Interdisciplinary Center for Mathematical and Computational Modelling of the University of Warsaw. , , , , , , , , ††thanks: Funded by the Federal Ministry od Science and Transportation under the contract GZ 616.360/2-IV GZ 616.363/2-VIII, and by the Austrian Science Foundation under contract P08929-PHY.
2 Introduction
The decay asymmetry plays an important role in solving a long standing discrepancy between the Hara theorem [1] and the observed decay asymmetries of weak radiative hyperon decays [2, 3]. The Hara theorem states that the parity-violating amplitude of weak radiative hyperon decays vanishes in the SU(3) limit. Accordingly, the decay asymmetries will vanish in this case. Introducing weak breaking of SU(3) symmetry one expects to observe small decay asymmetries. In contrast to this, a large negative decay asymmetry in the weak radiative decay was first measured by Gershwin et al. [4] and later confirmed [5]. To address this observation, models were developed which tried to obtain large decay asymmetries in spite of weak SU(3) breaking. One category consists of pole models, which satisfy the Hara theorem by construction, and approaches based on chiral perturbation theory. They predict negative decay asymmetries for all weak radiative hyperon decays [6, 7, 8]. Vector meson dominance models and calculations based on the quark model on the other hand violate the Hara theorem. It has been shown that the Hara theorem is generally violated in quark model approaches [9]. This second group of models favours a positive decay asymmetry for the channel [10, 11]. Therefore, the decay plays a crucial role in differentiating between the groups of models. The only previous measurement of the decay asymmetry has been performed at FNAL, giving a value of [14]111 The original publication [14] quoted a wrong sign of the asymmetry. This has been corrected in an erratum in 2002, but not yet in the PDG value [5]., and is not able to make the distinction.
In addition to the decay asymmetry, the branching fractions of radiative decays are similarly difficult to calculate. Predictions on the decay rate vary by about one order of magnitude [6, 7, 8, 10, 12, 13]. Two experiments have reported a branching fraction measurement [14, 15], with the measured values being about two standard deviations apart. The latter measurement is an earlier NA48 measurement based on a data set of the year 1997, which contained only 31 candidates.
In this letter we report a new measurement with greatly enhanced precision on both the decay asymmetry and branching fraction.
3 Experimental setup
The NA48 experiment has been designed for the measurement of direct CP violation in the decay of neutral kaons. However, due to the comparable life times, decays from and hyperons could also be recorded by the NA48 detector. The experiment featured two almost collinear beams of neutral kaons which were derived from 450 GeV/ protons hitting two fixed beryllium targets of 40 cm length and 0.2 cm diameter, which were located 6 m (near target) and 126 m (far target), respectively, upstream of the decay region [16]. The present measurement is based on data from a special two-day run period in 1999 where only the near target was in operation. The proton beam was extracted from the CERN SPS in a 2.4 s spill every 14.4 s with the intensity increased to about protons per spill, which is a factor of higher than in normal running conditions. The near target was located 7.2 cm above the primary proton beam axis, which points to the detector centre. It was followed by a sweeping magnet with tungsten-alloy inserts in which the protons not interacting in the target were absorbed. The neutral beam was defined by a 0.36 cm diameter collimator 480 cm downstream of the target. It had a production angle of 4.2 mrad and a downward inclination of 0.6 mrad with respect to the incident proton beam, in order to have the axis of the neutral beam pointing to the centre of the electromagnetic calorimeter. The decay region was contained in an evacuated 89 m long and 2.4 m diameter steel tank, closed by a radiation lengths thick polyamide (Kevlar) composite window, from the centre of which a beam pipe traverses the following main NA48 detector.
The main NA48 detector elements are a magnetic spectrometer and a liquid-krypton electromagnetic calorimeter. The spectrometer is composed of two drift chambers [17] upstream and two downstream of a dipole magnet. The magnetic field is directed vertically and produces a 265 MeV/ transverse momentum kick. The chambers provide 100 m spatial resolution on the track coordinates, resulting in a total momentum resolution of for 45 GeV/ particles.
The liquid-krypton calorimeter (LKr) measures the energies, positions, and times of electromagnetic showers initiated by photons and electrons. Around 20 t of liquid krypton at 121 K are used in a ionization detector. The calorimeter has a structure of 13212 square read-out cells of cm2 cross-section and 127 cm length (27 radiation lengths) each. The cross-section of the active volume has an octagonal shape of 240 cm inscribed diameter. The read-out cells are formed by longitudinally stretched copper-beryllium ribbons which act as electrodes. The energy resolution of the calorimeter is with in GeV; the time resolution is better than 300 ps for photon energies above 20 GeV.
Further detector elements were used in the trigger decision for the present measurement: a steel-scintillator sandwich calorimeter (HAC) with a length of 6.7 nuclear interaction lengths follows the liquid-krypton calorimeter and measures energies and horizontal and vertical positions of hadron showers; a hodoscope composed of 64 horizontal and 64 vertical scintillator strips is located about 1.6 m upstream of the LKr calorimeter. A more detailed description of the experimental set-up can be found elsewhere [18].
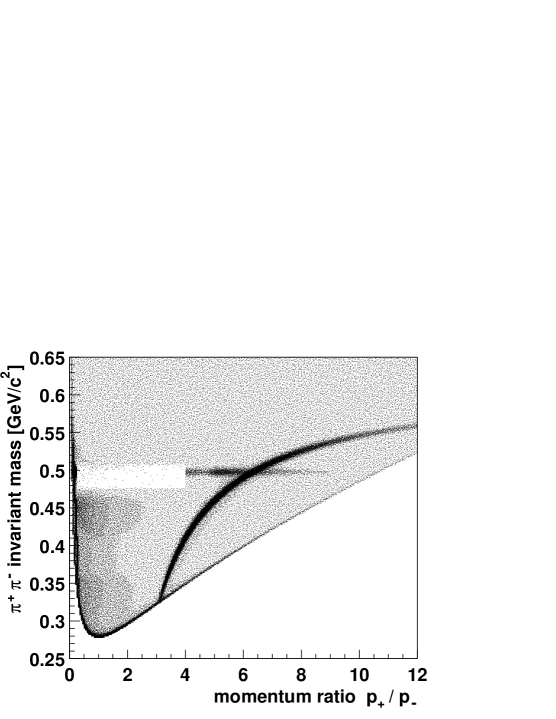
The trigger decision for neutral hyperon decays was based on information from the detector elements described above. A positive pre-trigger decision required at least one coincidence between a vertical and a horizontal hodoscope scintillator strip, a two track signature in the drift chambers, and the sum of the energies deposited in the electromagnetic and the hadron calorimeter larger than 35 GeV. The next trigger level used information from a preliminary track reconstruction: In order to reject background events, a mass cut around the kaon mass for the hypothesis and a cut on the ratio between the positive and negative track momenta were applied. This ratio is large for decays where the proton carries the major fraction of the initial momentum, as opposed to background kaon decays where the two charged particles typically have a much lower momentum ratio. The trigger rejected a window with ( and 4 for a brief period at the start of the run) and MeV/c2 (25 MeV/c2), where is the nominal kaon mass. Because of the high rate the triggered events were down-scaled with different factors between 4 and 8 during the two-day run period. The plot of versus for the accepted events is shown in Fig. 1. In total, approximately 150 million triggers were collected, out of which 18 million events contained hyperons.
The events were selected by a trigger optimised to select hadronic events for which the accuracy of the electromagnetic calorimeter information was not necessary. For this trigger, showers from the LKr were read-out only if their seed energy exceeded 1 GeV instead of the usual 100 MeV. Therefore a cluster energy correction was applied, which was determined from the reconstructed invariant mass in events from the same data sample. The correction was energy-dependent and ranged between and for photon energies between 5 and 20 GeV.
A Monte Carlo simulation based on GEANT 3.21 [19] for the LKr calorimeter and a fast track simulation was used throughout this analysis. Special care was taken to adjust beam, target, and collimator geometries and positions to the data.
4 Method of the Asymmetry Measurement
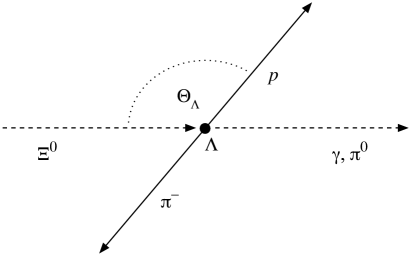
For the asymmetry measurement we exploit the well-known decay asymmetry of the decay. The hyperons are longitudinally polarized by the parent process with a polarization of in their rest frame. Effectively, one measures the distribution of the angle between the incoming (corresponding to the outgoing direction in the rest frame) and the outgoing proton in the rest frame (see Figure 2):
In this way the is polarized by the decay and analysed by its own decay into . The minus sign is purely conventional and arises from the fact that the photon carries spin 1, which leads to an opposite spin to that in the process [20].
For calibration purposes and as a cross-check, we have also analyzed the decay , for which the decay asymmetry is well measured. Obviously, when replacing with , there is no difference in the topology for the decays and and the definition of the angle is similar. However, as explained above, the spin 0 nature of the leads to a sign flip for the longitudinal polarization.
5 Event Selection
The hyperons were identified by two oppositely charged tracks in the spectrometer. The tracks were required to be at most 4.5 ns apart in time and to have momenta of at least 30 GeV/ for the positive and 5 GeV/ for the negative track. For both tracks the radial distances to the beam axis at the longitudinal positions of the drift chambers had to be greater than 12.6 cm to ensure full efficiency of the chambers. The extrapolation of the two tracks to the point of closest approach defined the decay vertex. The distance of closest approach had to be less than 2.2 cm. The reconstructed hyperon was required to have a minimum momentum of 57 GeV/ and a reconstructed invariant mass within 2.7 MeV/ of the nominal mass, corresponding to a window of standard deviations. Finally, the longitudinal position of the decay vertex had to be at least 6 m downstream of the target, corresponding to the end of the final collimator, and at most 40 m from the target.
Photons were detected by clusters in the electromagnetic calorimeter. The cluster energy had to be above 15 GeV. To ensure negligible energy loss, all clusters had to be at least 15 cm and at most 120 cm from the beam axis, well within the sensitive volume of the LKr calorimeter, and had to have a distance greater than 2 cm to any dead calorimeter cell. To avoid effects from hadron shower contaminations, the photon clusters were required to be separated by at least 25 cm from the impact point of any track. The cluster-time had to be within ns of the average of the track times.
The energy centre-of-gravity at the longitudinal position of the calorimeter was defined as
with the sums running over tracks and photon clusters. The positions are either the cluster positions in case of photons or the coordinates of the tracks extrapolated from before the spectrometer to the LKr calorimeter. The energies are the photon cluster energies or are derived from the track momenta using the nominal particle masses. To avoid missing energy in the event, the position of the energy centre-of-gravity was required to be less than 7 cm from the detector axis. The target position and the energy centre-of-gravity defined the reconstructed line-of-flight of the . The distance of the decay vertex from the line-of-flight had to be less than 2 cm to ensure a well-reconstructed event. The decay vertex was reconstructed as the point of closest approach between the line-of-flight and and the line-of-flight, which was determined from the reconstructed decay vertex and 3-momentum. The longitudinal position of the decay vertex was required to be at least 5 m downstream of the target, 1 m before the end of the final collimator.
Background from decays was completely discarded by rejecting all events with an invariant mass, under a hypothesis, within MeV/ of the nominal kaon mass (corresponding to standard deviations of the resolution). Additional background comes from decays as well as from time overlap of two events or hadronic interactions in the collimator region. Both accidental and hadronic background contain a real decay together with one or two photons from a decay. In order to reject this background together with decays, we rejected all events which had one or more additional LKr calorimeter cluster within 5 ns of the average track-time and more than 25 cm from the track impact points in the calorimeter. Decays of with one lost photon are strongly suppressed by kinematics to enter the signal region, even if resolution effects are taken into account.
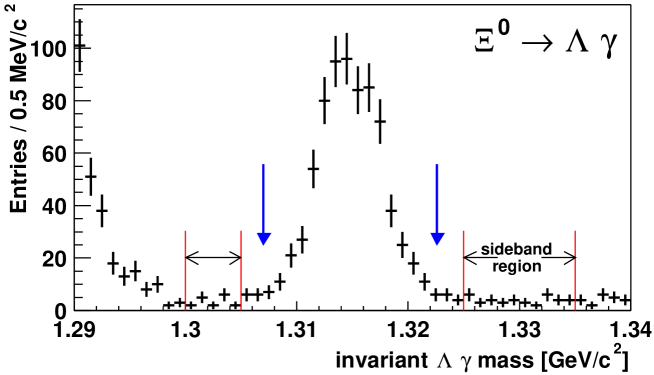
The invariant mass distribution of the candidates is shown in Figure 3. Within MeV/ (3 standard deviations) of the mass 730 candidates were reconstructed. As all remaining background sources have a flat distribution in a close invariant mass interval, as seen from Monte Carlo simulation, we have used mass side-bands from to GeV/ and from to GeV/ for background subtraction. From this, the background was estimated to be events, which corresponds to of the signal sample. It is dominated by hadronic events with some remaining contributions from accidental background and mis-identified decays.
For the selection of the normalization channel only a few changes were applied with respect to the selection. At least two photon clusters within 5 ns and with energies above 6 GeV were required. The invariant mass of the two photons, computed using the cluster energies and positions and the reconstructed decay vertex, had to be within 3 standard deviations (about 10 MeV/) from the nominal mass. No cut on additional LKr calorimeter clusters was applied for the selection.
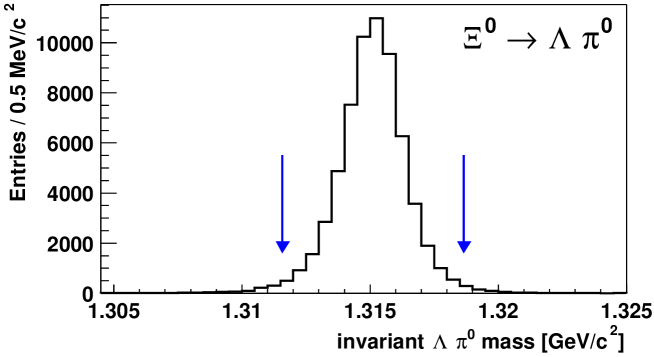
After applying all selection criteria, the total yield of candidates was 61828 events within a window of MeV/ () around the nominal mass (Fig. 4). Backgrounds are negligible in this channel.
6 Measurement of the Decay Asymmetry
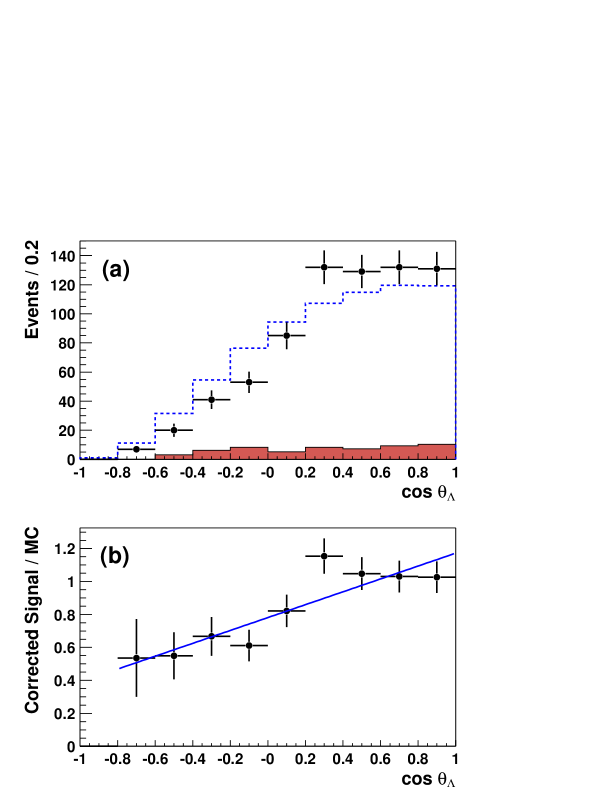
As described, the asymmetry is analysed in the angle . The resolution on is 0.01, as determined from the Monte Carlo simulation. Fig. 5a shows the distributions for all candidates and for the properly scaled side-band events compared to the isotropic Monte Carlo simulation.
The ratio of data over Monte Carlo corrects for the detector acceptance. To account for the background contamination, an effective asymmetry of the background was determined by fitting the side-band events with . The result of (together with the background fraction of ) was used to apply a smooth correction to the distribution of the signal events for the background contamination. The ratio of background-corrected signal over Monte Carlo is shown in Figure 5b. A fit with the normalization and the asymmetry as free parameters was performed in the range , where both data and Monte Carlo statistics are large. The result of the fit is with a per degree of freedom of . After dividing by [5] we obtain .
Several contributions to the systematic error have been studied. The largest uncertainties come from the effective asymmetry of the background () and the background normalization (). Additional uncertainties may arise from a possible incorrect modeling of the detector acceptance. This was investigated with events, which have sufficient statistics, and which are, due to the lower value, more sensitive to possible inefficiencies near the beam pipe. Different geometrical acceptance cuts in the beam pipe regions and on the energy as well as uncertainties in the beam profile simulation and the distribution of the hyperons have been studied, resulting in a variation of on the decay asymmetry. The effect of transverse polarization on the decay asymmetry was studied and found to be negligible compared to the other uncertainties. Finally, the uncertainty on the used value of contributes to the systematics.
By adding the single components in quadrature, the total systematic uncertainty is , which is small compared to the statistical uncertainty of the data (Tab. 1).
An important check for the validity of the analysis is the measurement of the decay asymmetry in , where the data statistics is a factor of 100 higher. Both channels are two-body decays and the decay , due to the lower value, is even more sensitive to effects from the beam-line geometry and polarization than . The decays were recorded with the same trigger, analysed with the same definition of , and used a similar Monte Carlo simulation as for the analysis. From our data we measure a combined asymmetry of . The excellent agreement between this result and the best published measurement of [22] validates the method and serves as a systematic check.
As a further check, a second analysis, which was performed using the same data but different Monte Carlo samples, gave consistent results.
| Background asymmetry | |
|---|---|
| Background normalization | |
| Detector acceptance | |
| Total systematic uncertainty | |
| Statistical uncertainty data |
7 Measurement of the Branching Fraction
Using the central value of our new result on the decay asymmetry, the overall reconstruction efficiency was determined to be from Monte Carlo simulation. For the normalization channel the reconstruction efficiency was determined to be . It is significantly lower than for the signal channel, as the proton receives less transverse momentum and escapes more often undetected through the beam-pipe. Subtracting the background and using [5], we obtain .
The systematic error is dominated by the uncertainty on the decay asymmetry, which leads to a uncertainty on the geometrical acceptance and therefore on the branching ratio. Other systematic uncertainties are the detector acceptance ( of the measured value), the polarization (), and the background estimation (), which have been determined in a similar way to those for the decay asymmetry measurement. To account for the unknown polarization in our data we have varied the polarization in the simulation by , which is similar in magnitude to the measured transverse polarization of about for a proton beam energy of 800 GeV and a production angle of 4.8 mrad [21]. This variation resulted in a change of the measured branching fraction. An additional external uncertainty arises from the knowledge of the decay asymmetry (), since it affects the selection efficiency of the normalization channel. Finally, the statistics of the normalization channel and of the signal and normalization Monte Carlo simulations contribute to the systematic uncertainty. All other sources of systematic errors were found to be negligible. The total systematic uncertainty on is . A summary of uncertainties on the branching ratio measurement is given in Table 2.
A second independent analysis has been performed also for the branching fraction measurement and yielded a consistent result.
| decay asymmetry | |
|---|---|
| decay asymmetry | |
| Background estimation | |
| Detector acceptance | |
| polarization | |
| Statistics of MC and | |
| Total systematic uncertainty | |
| Statistical uncertainty data |
8 Summary and Conclusion
From the data of two days of high intensity data taking of the NA48 experiment 730 candidates have been found with an estimated background of events. By comparison with an isotropic Monte Carlo simulation, the decay asymmetry has been found to be
This is the first evidence for a negative decay asymmetry in this channel [23]. As has been indicated in the introduction, the decay asymmetry is a crucial input parameter for theoretical approaches to weak radiative hyperon decays. The negative sign of the asymmetry clearly prefers models consistent with the Hara theorem, while, on the other hand, it cannot be easily explained by quark models and models using vector meson dominance.
9 Acknowledgements
It is a pleasure to thank the technical staff of the participating laboratories, universities, and affiliated computing centres for their efforts in the construction of the NA48 apparatus, in the operation of the experiment, and in the processing of the data. We also would like to thank Piotr Żenczykowski for many useful discussions and insights into the theoretical interpretation of the result.
References
- [1] Y. Hara, Phys. Rev. Lett. 12 (1964), 378.
- [2] P. Żenczykowski, Nucl. Phys. Proc. Suppl. 50 (1996), 211.
- [3] P. Żenczykowski, hep-ph/9910529 (1999).
- [4] L.K. Gershwin et al., Phys. Rev. 188 (1969), 2077.
- [5] K. Hagiwara et al. (Particle Data Group), Phys. Rev. D 66 (2002), 010001.
- [6] M.B. Gavela et al., Phys. Lett. B 101 (1981), 417.
- [7] B. Borosay and B.M. Holstein, Phys. Rev. D 59 (1999), 054019.
- [8] P. Żenczykowski, Phys. Rev. D 62 (2000), 014030.
- [9] A.N. Kamal and Riazuddin, Phys. Rev. D 28 (1983), 2317.
- [10] R.C. Verma and A. Sharma, Phys. Rev. D 38 (1988), 1443.
- [11] J. Lach and P. Żenczykowski, Int. J. Mod. Phys. A 10 (1995), 3817.
- [12] F.J. Gilman and M.B. Wise, Phys. Rev. D 19 (1979), 976.
- [13] A.N. Kamal and R.C. Verma, Phys. Rev. D 26 (1982), 190.
- [14] C. James et al., Phys. Rev. Lett. 64 (1990), 843; Erratum ibid. 89 (2002), 169901.
- [15] V. Fanti et al., Eur. Phys. J. C 12 (2000), 69.
- [16] N. Doble et al., Nucl. Instrum. Methods B 119 (1996), 181.
-
[17]
D. Bederede et al.,
Nucl. Instrum. Methods A 367 (1995), 88;
I. Augustin et al., Nucl. Instrum. Methods A 403 (1998), 472. - [18] A. Lai et al., Eur. Phys. J. C 22 (2002), 23.
- [19] GEANT Description and Simulation Tool, CERN Program Library Long Write-up, W5013 (1994).
- [20] R.E Behrends, Phys. Rev. 111 (1958), 1691.
- [21] T. Alexopoulos and A.R. Erwin, Proc. of the Hyperon Physics Symposium (Hyperon 99), Batavia, Illinois, Sep. 1999.
- [22] R. Handler et al., Phys. Rev. D 25 (1982), 639.
- [23] S.A. Schmidt, Doctoral Thesis, Universität Mainz, Nov. 2001.