at Hadron Machines
Abstract
The results and goals of experiments E787, E949, CKM and KOPIO on the measurement of the branching fractions of and are presented.
1 Introduction
The branching fractions of and belong to a small set of measurable quantities that have a precise and unambiguous relation to the fundamental parameters of the standard model (SM). Due to the large top mass, the decays are sensitive to the product of the CKM elements that quantify and transitions. In terms of the unitarity triangle (UT) that represents the CKM matrix in the complex plane, the height is proportional to and the length of one side is proportional to . The observation of these decays and their branching fractions is the goal of four experiments at hadronic machines: E787, E949, CKM ( ) and KOPIO (). The KEK experiment E391a will also study the and is discussed in these proceedings.
2 E787
Experiment E787 at the Alternating Gradient Synchrotron (AGS) of Brookhaven National Laboratory (BNL) finished data collection in 1999 and has observed 2 candidates for upon an estimated background of . The probability that the two candidates are due to background is 0.02%. These observations imply [1] which is statistically consistent with the SM prediction of [2] albeit with a central value tantalizingly twice the expectation.
A schematic of the E787 detector is shown in Figure 1. A beam with passes through threshold Cherenkov counters, wire chambers, a degrader and a plane of hodoscopes before stopping in a scintillating fiber target. Outgoing from decays in the range to with respect to the initial direction traverse a low mass drift chamber and come to rest in the range stack (RS) of plastic scintillator bars. The RS is surrounded by a non-projective lead-scintillator barrel veto approximately 13 radiation lengths () thick. Pure CsI detectors thick perform a similar function in the end caps. Additional lead-scintillator veto counters are inserted in the beam region to improve hermeticity.
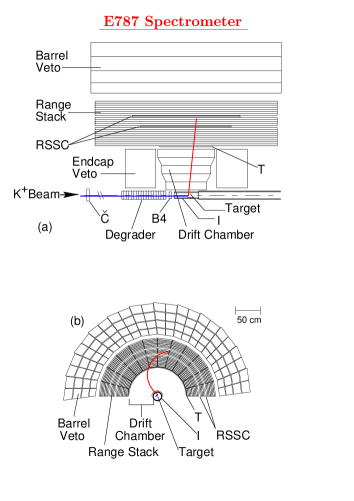
To observe the decay at the SM predicted rate of [2], E787 needed to suppress backgrounds by a factor of . This goal was accomplished by independent measurements of the momentum (P), range (R) in plastic scintillator and energy (E) of the . The incoming is positively identified by Cherenkov light, and range in the target. The entire decay chain is detected in the RS for positive identification and is augmented by measurements. All active elements of the detector are used to veto on extra neutral or charged particles.
The E787 analysis strategy is summarized below:
-
•
A priori identification of background sources.
-
•
Suppress each background source with at least two independent cuts.
-
•
Backgrounds cannot be reliably simulated: measure with data by inverting cuts and measuring rejection taking any (small) correlations into account.
-
•
To avoid bias, set cuts using 1/3 of data, then measure backgrounds with remaining 2/3 sample.
-
•
Verify background estimates by loosening cuts and comparing observed and predicted rates.
-
•
Use MC to measure geometrical acceptance for . Verify by measuring .
-
•
“Blind” analysis. Don’t examine signal region until all backgrounds are verified.
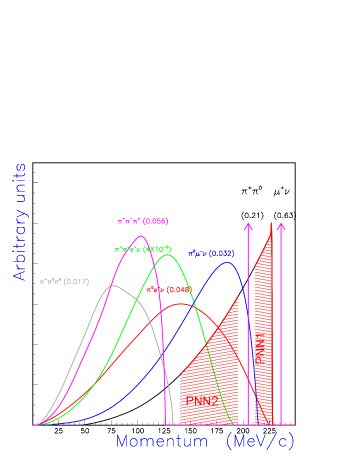
E787 searched for in two distinct kinematic regions — above and below the () peak (Figure 2). The backgrounds in the higher momentum region, dubbed pnn1, are due to the two-body decays and (), beam particles scattering into the RS and the charge exchange (CEX) reaction , . The CEX background is estimated from a combination of data and simulation; the other backgrounds are estimated from data as outlined above. The E787 results in the pnn1 region are given in Table 1 and Figure 3 and result in [1].

| Bkgd | 1995-97 | 1998 |
|---|---|---|
| Beam | ||
| CEX | ||
| Total | ||
| N(K) | ||
| Acc. | ||
| Sens. | ||
| Cand. | 1 | 1 |
The search in the lower momentum region (Figure 2), dubbed pnn2, suffers from a larger background rate but has the advantage over pnn1 of greater phase space and less loss due to interactions. The pnn2 region also probes more of the form factor.
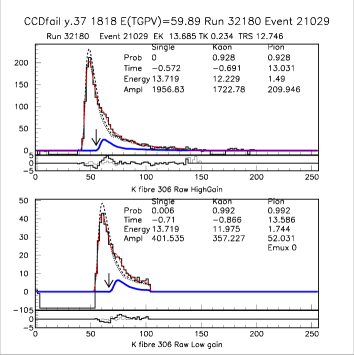
The main pnn2 background is due to decays where the is emitted along the beam axis and scatters into the RS. The scatter destroys the back-to-back correlation of the and that allows the pnn1 analysis to suppress background using the barrel photon veto. For the -scatter background, at least one of the photons is directed into the beam region which is necessarily less instrumented. Since the fibers in the target run along the beam direction, the outgoing can remain in the same fiber as the stopping and its energy deposit signature can be obscured by the larger energy deposit. Some rejection of this background is possible by using CCDs to digitize the energy deposit in each fiber every 2 ns. An example of the identification of the outgoing energy deposit in a fiber traversed by the is shown in Figure 4.
The preliminary pnn2 results are given in Table 2 with a comparison to pnn1. The pnn2 search also suffers from background due to () if both the and are undetected and radiative decays that push the into the pnn2 region. In contrast to pnn1, backgrounds are very small for pnn2 allowing more acceptance by relaxing the criteria for identification. The background to signal sensitivity of pnn2 in Table 2 is approximately 20 times worse than that of pnn1.
| Backgrounds | ||
|---|---|---|
| Source | pnn2 | pnn1 |
| Beam | ||
| NA | ||
| NA | ||
| CEX | ||
| Total | ||
| N(K) | ||
| Acc. | ||
| Cand. | 1 | 2 |
| B | ||
3 E949
E949 [3] is an upgraded E787 detector designed to have increased sensitivity to in both pnn1 and pnn2 regions. The upgrades improved photon veto hermeticity, both in the barrel and beam regions, tracking resolution and DAQ for an increased duty factor. E949 accumulated stopped in an eleven-week run in 2002 and expects to have results for the pnn1 region by the end of 2003 with a sensitivity slightly less than E787 and about 20% of the E949 goal. Current E949 studies show that the upgraded detector would be capable of achieving the E949 sensitivity goal of . Unfortunately E949 is languishing due to a lack of funding since the DOE terminated high energy physics running at the AGS in 2002.
4 CKM
The CKM experiment [4] proposed at Fermilab has a sensitivity goal of corresponding to events at the SM rate with a signal-to-background of . CKM departs form the E787/E949 strategy by seeking to measure decay in flight in a 22 GeV, 50 MHz separated beam ( purity). CKM plans to kinematically suppress backgrounds by with independent measurements of the and momentum and velocity vectors with magnetic spectrometers and ring-imaging Cherenkov detectors. Additional rejection of is achieved via a hermetic photon veto. The primary signal region for CKM is similar to the pnn1 region of E787/E949. The pnn2 region may be more accessible to CKM since the -scatter background should not exist for decay in flight.
5 KOPIO
The situation with the decay can be summarized with two fourteen-year-old quotes. “The process offers perhaps the clearest window yet proposed into the origin of CP violation [5].” “Experimentally, the problems are perhaps best represented by the statement that nobody has yet shown that a measurement of this decay is absolutely impossible [6].”
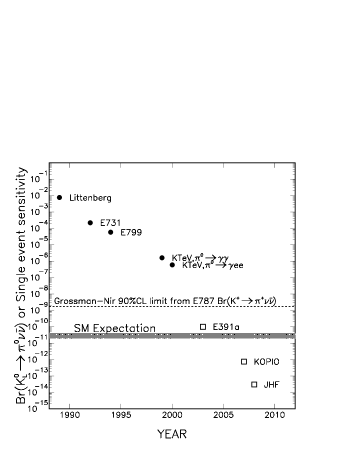
Figure 5 shows the progress in the search for . The KTeV results with [7] utilized a well-collimated “pencil” neutral beam to constrain the decay point and measured the transverse momentum of the photon pair after vetoing on all other particles. A similar approach is being followed by KEK E391a.
The KOPIO [8] experiment at BNL proposes to use a different technique summarized pictorially in Figure 6. The neutral beam is produced in ps wide bunches every 40 ns and collimated toward the KOPIO decay region. The time, direction and energy of the two photons are measured with a fine-grained preradiator (2) and calorimeter (15). The is reconstructed from the momenta of the two photon candidates with the constraint of a vertically narrow neutral beam (). Applying the further constraint of the mass improves the measurement of the decay position and time and thus the velocity thanks to the bunched beam. KOPIO will be able to kinematically suppress backgrounds by working in the center-of-momentum system (CMS). Additional background rejection from hermetic photon and charged particle vetoes complement the kinematic rejection.
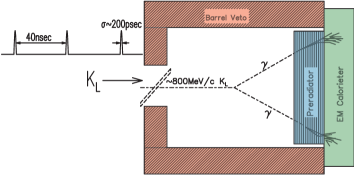
Table 3 lists the backgrounds from decays and the tools that will be used to suppress them. Following the successful E787/E949 strategy, KOPIO is designed to suppress each background with at least two independent criteria which will allow estimation of background rates from the data.
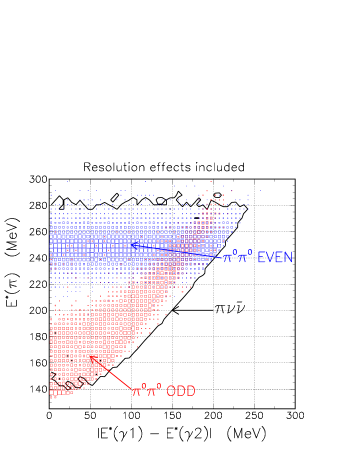
The main background is the CP-violating decay decay when two photons escape the veto. Figure 7 illustrates the power of KOPIO’s kinematic suppression of background. The expected background and signal rates for the entire projected KOPIO three year running period are shown in Table 4. If the SM prediction is correct, KOPIO will observe about 40 events upon a background of 20 events yielding a 20% measurement of or a determination of the height of the UT to 10%.
| Decay | Kinematic | PV | CV | |
|---|---|---|---|---|
| even | ||||
| odd | ||||
| , | ||||
| , | ||||
| , |
| Process | Events |
|---|---|
| at SM rate | 40 |
| 12.4 | |
| 4.5 | |
| 1.7 | |
| 0.02 | |
| 0.02 | |
| 0.01 | |
| Interactions () | 0.2 |
| Accidentals | 0.6 |
| Total Background | 19.5 |
6 Summary
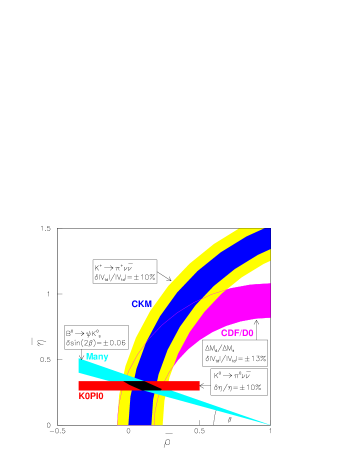
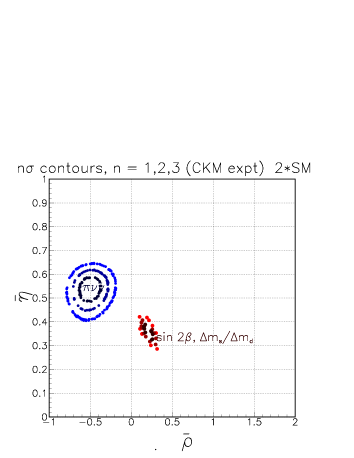
The measurement of the branching fraction of both decay modes with the design sensitivity of CKM and KOPIO could yield confidence level contours for the apex of the UT similar to those shown in Figures 8 [4] and 9 [2]. Clearly such measurements would be able to test the precise predictions of the SM for the fundamental parameters of the CKM matrix.
6.1 Acknowledgements
I would like to thank Gino Isidori for inviting me to the workshop and Nicolò Cartiglia for a careful reading of this paper. Peter Cooper, George Redlinger, Steve Kettell, Laurence Littenberg, Ken Nelson, Hogan Nguyen and Bob Tschirhart helped to prepare my presentation by graciously providing figures and comments. I also wish to thank the E949, CKM and KOPIO collaborations.
References
- [1] S.Adler et al., Phys. Rev. Lett. 88, 041803 (2002).
- [2] The CKM Matrix and the Unitarity Triangle, M. Battaglia, A.J. Buras, P. Gambino and A. Stocchi, Editors, CERN-2003-002, 30 June 2003, hep-ph/0304132.
- [3] http://www.phy.bnl.gov/e949/
- [4] http://www.fnal.gov/projects/ckm/Welcome.html
- [5] L.S. Littenberg, Phys. Rev. D39, 3322 (1989).
- [6] F.J.Gilman, “CP Violation in Rare K Decays”, Blois CP Violations 1989:481-496
- [7] J. Adams et al., Phys. Lett. B447 (1999) 240.
- [8] http://pubweb.bnl.gov/people/e926/
- [9] Y. Grossman and Y. Nir, Phys. Lett. B 398, 163 (1997) [arXiv:hep-ph/9701313].