QCD@Work 2003 - International Workshop on QCD, Conversano, Italy, 14–18 June 2003
Lifetime measurement of atoms consisting of and mesons
Abstract
The lifetime measurement of atoms () with 10% precision provides in a model independent way the difference between the S-wave scattering lengths for isospin 0 and 2, , with 5% accuracy. The scattering lengths and have been calculated in Chiral Perturbation Theory (ChPT) with a precision better than 2.5%. Therefore, such a measurement will be a sensitive check of the understanding of chiral symmetry breaking in QCD by giving an indication about the value of the quark condensate, an order parameter of QCD. The method of observation and lifetime measurement of is discussed. Data on production in Pt, Ni and Ti targets and preliminary results on the lifetime measurement are presented.
Introduction
Pionium or is a hydrogen-like atom consisting of and mesons. The lifetime of this atom is inversely proportional to the squared difference between the S-wave scattering lengths for isospin 0 and 2, . This value is predicted by chiral perturbation theory (ChPT), and a measurement of the atom lifetime provides a possibility to check predictions of ChPT in a model-independent way.
1 Present status of scattering length investigation.
In chiral perturbation theory (ChPT) the 2-loop calculation, exploiting Roy equations, leads to a precise prediction for at the level of 1.5%: [1].
Experimental data on scattering lengths can be obtained in an indirect way via the following processes:
-
1.
decay, , using a model-independent analysis. The most resent result obtained from decays have been collected in the experiment E865 (BNL). The analysis yields the -wave scattering length [2].
- 2.
2 Theoretical motivation
The atom decays by strong interaction mainly into . The branching ratio of the alternative decay mode is at the level of . There is a relation [4, 5] between and scattering lengths: .
ChPT at next-to-leading order in isospin breaking provides correction to decay width . Using this correction the lifetime of atoms is predicted to be [6]:
A measurement of the atom lifetime with an accuracy of 10% allows to determine the corresponding scattering length difference with 5% accuracy.
3 Method of lifetime measurement
The are produced by Coulomb interaction in the final state of pairs generated in proton–target interactions [7, 8]. After production travel through the target and some of them are broken up due to their interaction with matter: “atomic pairs” are produced, characterized by small pair c.m. relative momenta MeV/. These pairs are detected in the DIRAC setup. Other atoms annihilate into . The amount of broken up atoms depends on the lifetime which defines the decay rate. Therefore, the breakup probability is a function of the lifetime.
The dependence of on the lifetime is determined by the solution of differential transport equations [9]. In Fig. 1 the lifetime dependence of is presented for three different targets used in the DIRAC experiment. The nickel target provides the best statistical accuracy for the same running time.

Also pairs from short-lived sources are generated in free state. Such pairs (“Coulomb pairs”) are affected by Coulomb interaction, too. The number of produced atoms () is proportional to the number of “Coulomb pairs” () with low relative momenta (). The coefficient is precisely calculable. And there are pairs from long-lived sources (). Such pairs, not affected by final state interaction, are named “non-Coulomb pairs”.
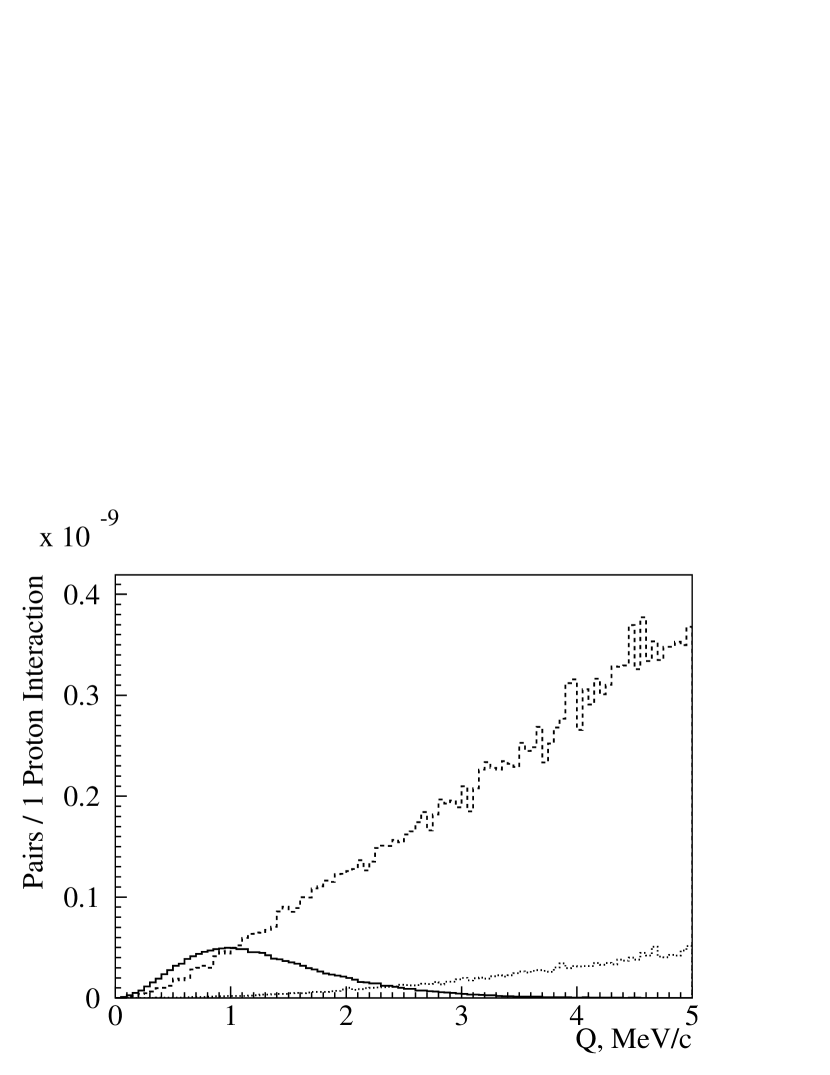
In Fig. 2 simulated distributions of “atomic pairs”, “Coulomb” and “non-Coulomb” pairs are presented. For relative momentum MeV/ “atomic pairs” are practically absent, but in the region MeV/ a fraction of them is essential, and this region provides the best effect-to-error ratio.
The aim of DIRAC is to measure the breakup probability . is the ratio between the observed number of “atomic pairs” and the number of produced atoms which is calculated from the measured number of “Coulomb pairs”.
4 Experimental setup
The purpose of the DIRAC setup (Fig. 3) is to detect pairs with small relative momenta [10]. This setup is located at the CERN T8 beam area (East Hall). It became operational at the end of 1998 and uses the 24 GeV proton beam from PS accelerator.

In Table 1 the main setup features are summarized. The setup resolution is shown for the projections of the relative c.m. momentum : is a projection along the total pair momentum in the laboratory system, and are the X- and Y- projections of the transverse component of .
| Angle of channel to proton beam | |
|---|---|
| Channel aperture | sr |
| Magnet bending power | 2.3 Tm |
| Momentum range | GeV/ |
| Resolution on pair relative | MeV/ |
| momentum projections | MeV/ |
5 Experimental data
The setup detects pairs of oppositely charged particles. Fig. 4 shows the event distribution over time difference between positive and negative particles. The peak in the central part contains pairs of particles which are generated in the same proton–nucleus interaction (“real pairs”). These pairs consist of “atomic”, “Coulomb” and “non-Coulomb” pairs. The wings of the distribution are formed by “accidental pairs” consisting of particles from different proton–nucleus interactions and so not affected by final state interaction. Therefore, the -distribution of “non-Coulomb” and “accidental” pairs are very similar. Only a laboratory momentum distribution for “accidental pairs” is more hard than one for “real pairs” due to energy conservation. It causes the difference for big values of pair relative momentum . But in DIRAC only events with small relative momenta are used. Admixture of “accidental pairs” under the central peak is subtracted by using the widths of the intervals , and .

Eq. 1 shows the experimental correlation function . This function consists of two parts. One part is a constant as the result of dividing the distribution of “non-Coulomb pairs” () by the distribution of “accidental pairs”. Here is a normalization parameter and the fraction of “non-Coulomb pairs”.
| (1) |
The second part of is -dependent: the number of “Coulomb pairs” () with very small is increased by Coulomb interaction. It should be emphasized that the Coulomb factor (Eq. 1) is smeared compared to the theoretical one due to multiple scattering in the target and finite setup resolution.
The experimental relative momentum distributions for “real” and “accidental” pairs are shown in Fig. 5. These data were collected with nickel target in 2001.

Fig. 6 shows the experimental correlation function (Eq. 1). In the region MeV/ this function was fitted by an approximated correlation function which takes into account “non-Coulomb pairs” (constant term) as well as “Coulomb pairs” (-dependent term), the multiple scattering in the target and also the setup resolution. The fraction of “non-Coulomb pairs” is a free parameter in the fit procedure (Eq. 1). There is a good agreement between the experimental and approximated correlation functions for MeV/. On the other hand in the region MeV/ the experimental points are higher than the approximation function describing “free pairs” only. This excess is the signal of “atomic pairs”.

To calculate the number of “atomic pairs” the approximated correlation function has been transformed to a -distribution by multiplying it with the distribution of “accidental pairs” (Eq. 1). Differences of experimental and approximated distributions are shown in Fig. 7 for data collected in 1999, 2000, 2001 and in 15 days of 2002.

Simulation shows that analysis of -distributions provides a decreasing of the systematic error by a factor and a small increasing (30%) of the statistical error in comparison with analysis of -distributions.
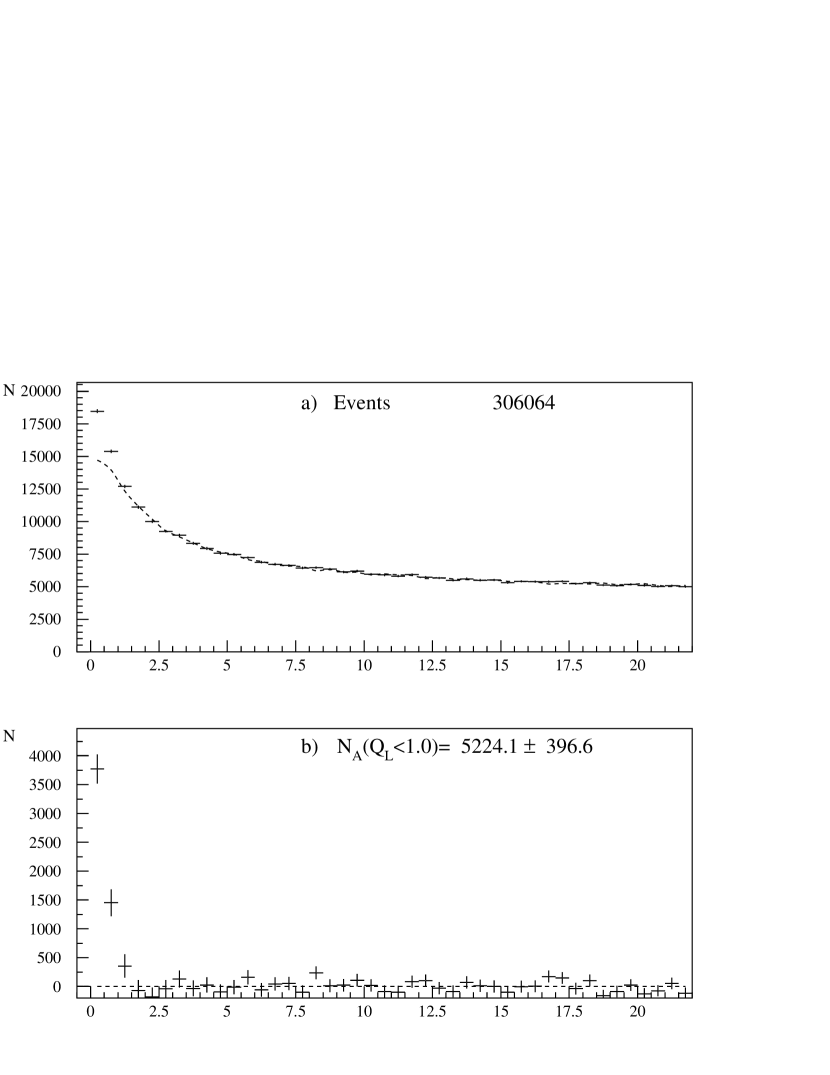
The distribution over the absolute value of for a mixture of “real” and “accidental” pairs and the distribution of “accidental pairs” only are shown in Fig. 8 for data collected with the nickel target in 2001. Data were selected with the criterion on transverse component of relative momentum MeV/. Therefore a small value of means a small value of . It is seen that the distribution of real pairs shows a peak at .
The distribution of “real pairs” (Fig 9a) is fitted by the sum of approximated distributions of “Coulomb” and “non-Coulomb” pairs in the region MeV/ where “atomic pairs” are absent. Approximated distributions are made on the base of “accidental pairs” applying a correlation function which takes into account the Coulomb interaction in the final state, multiple scattering in the target, the resolution of the setup and difference of laboratory momentum spectra of “real” and “accidental” pairs. The fraction of “non-Coulomb pairs” and the normalization factor are free fit parameters. There is a good agreement between the experimental and approximated distributions for MeV/. On the other hand in the region MeV/ the experimental points are higher than the values of the approximation function describing “free pairs” only. This excess provides a number of “atomic pairs” and is shown in Fig 9b separately. The number of “Coulomb pairs” is calculated in the same fit procedure.

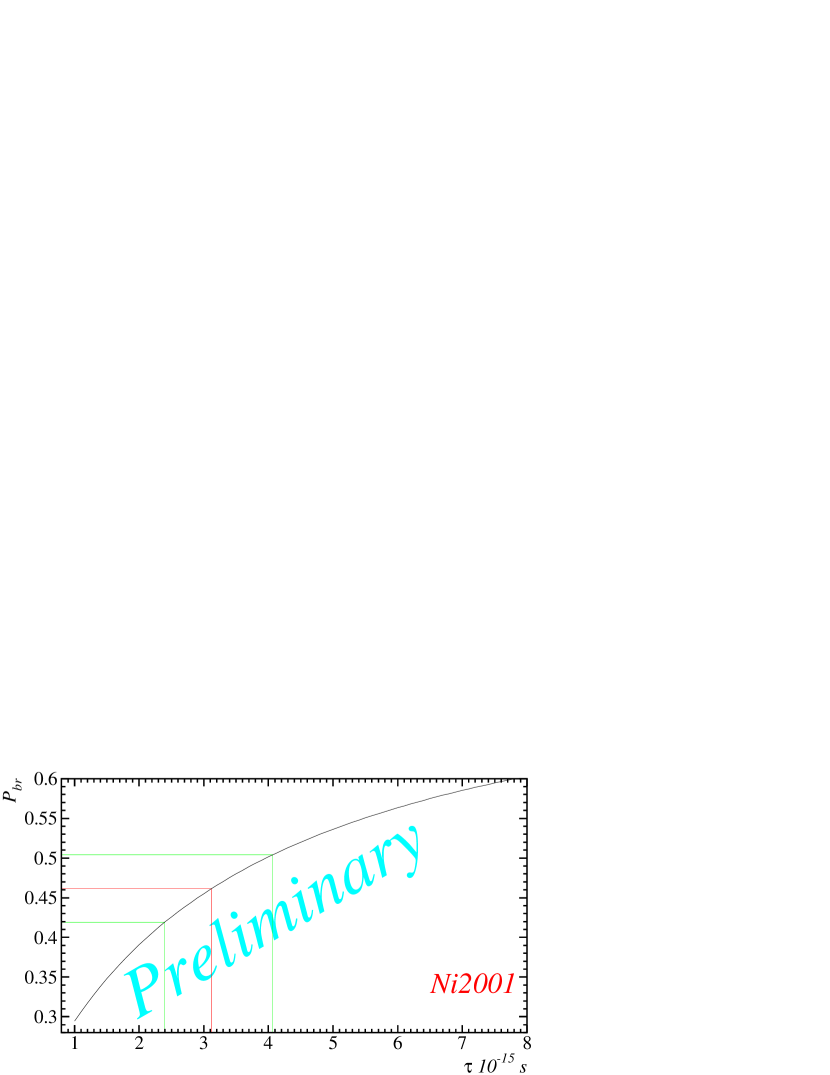
The number of “atomic pairs” together with a number of “Coulomb pairs” and the theoretically known coefficient allows to estimate a breakup probability value of with a statistical error 9.2%. There is also a systematic error due to accuracy in description of multiple scattering in the target, membranes and detector planes (precision needed is 1%) as well as in description of the detectors response.
Taking into account the dependence of breakup probability on lifetime (Fig. 10) a preliminary estimation of the atom lifetime yields
Conclusions
The DIRAC collaboration has built up a double arm spectrometer providing a resolution of 1 MeV/ for low relative ( MeV/) momentum of particle pairs and has successfully demonstrated its capability to detect after 2 years of running time.
In order to decrease systematic errors, dedicated measurements with a multi-layer nickel target and measurements of multiple scattering in all detectors and setup elements have been performed at the end 2002 and during present run of 2003.
Preliminary results have been achieved by analyzing data collected in 2001. The statistical accuracy in the lifetime determination reaches 25% and the systematic one is 30%. The analysis of data collected in 2000 and 2002 together with systematic error reduction allows us to improve the accuracy up to the level of 14%.
References
- [1] G. Colangelo, J. Gasser and H. Leutwyler, Phys. Lett. B 488 (2000) 261.
- [2] S. Pislac et al., Phys. Rev. D 67 (2003) 072004.
- [3] M. Kermani et al., Phys. Rev. C 58 (1998) 3431.
- [4] J. Uretsky and J. Palfrey, Phys. Rev. 121 (1961) 1798.
- [5] S. M. Bilenky et al., Sov. J. Nucl. Phys. 10 (1969) 469.
- [6] J. Gasser, V. E. Lyubovitskij, A. Rusetsky and A. Gall, Phys. Rev. D 64 (2001) 016008.
- [7] L. Nemenov, Sov. J. Nucl. Phys. 41 (1985) 629.
- [8] L. Afanasyev et al., Phys. Lett. B 308 (1993) 200.
- [9] L. Afanasyev and A. Tarasov, Phys. At. Nucl. 59 (1996) 2130.
- [10] B. Adeva et al. [DIRAC Collaboration], hep-ex/00305022 (2003).