SLAC–PUB–10176
September 2003
Hadronic Decays with BaBar***Work supported by Department of Energy contract DE–AC03–76SF00515.
P. Robbe
Laboratoire d’Annecy-le-Vieux de Physique des Particules, 74941 Annecy-le-Vieux, France
for the BaBar Collaboration
Stanford Linear Accelerator Center, Stanford University, Stanford, California 94309
Abstract
We report about the studies of the decay channels , and with a sample of 62 decays into meson pairs collected with the BaBar detector at the Pep II asymmetric collider.
Contributed to Beauty 2002: International
Conference on physics at Hadron Machines
Santiago de Compostela, Spain
June 17 - June 21, 2002
The measurement of the -violating phase of the Cabibbo-Kobayashi-Maskawa (CKM) matrix [1] is an important part of the present scientific program in particle physics. Theoretically clean measurements of the angle of the unitarity triangle exist [2] but there are no such measurements of the two other angles ( and ). The determination of these two angles would check the validity of the CKM mechanism in the explanation of the -violation. Theoretically clean measurements of and can be obtained from the study of the decay modes , and . In this paper we present the results of the measurements of the branching fractions of the decay modes, as a preliminary step towards the measurements of the angle.
1 Detector and data sample
The data were collected in the years 1999-2001 with the BaBar detector at the Pep-II asymmetric (3.1 GeV) - (9 GeV) storage ring. The BaBar detector is a large-acceptance solenoidal spectrometer (1.5 T) described in detail elsewhere [3]. The analyses described below make use of charged track and reconstruction and charged particle identification. Charged particle trajectories are measured by a 5-layer double-sided silicon vertex tracker (SVT) and a 40-layer drift chamber (DCH), which also provide ionisation measurements () used for particle identification. Photons and electrons are measured in the electromagnetic calorimeter (EMC), made of 6580 thallium-doped CsI crystals constructed in a non-projective barrel and forward endcap geometry. Charged separation up to 4 GeV/c in momentum is provided by a detector of internally reflected Cherenkov light (DIRC), consisting of 12 sectors of quartz bars that carry the Cherenkov light to an expansion volume filled with water and equipped with 10751 photomultiplier tubes.
2
The study of this decay channel can lead to a clean measurement of the angle [4, 5]. decays are obtained with a color-allowed, suppressed diagram. decay modes also exist and are due to a color- and suppressed diagram. If decays into a eigenstate such as , the decay can be obtained with both processes. Knowing the decay amplitudes of all three possibilities (, and ), it is possible to measure and then up to discrete ambiguities.
The asymmetry :
| (1) |
is related to the angle. It is expected to be of the order of 10 % in the Standard Model.
decay modes are expected to have a branching fraction 10 times lower than the branching fraction for ( [6]) which constitutes the main background source of this analysis. The capability of the DIRC to distinguish between pions and kaons will then be very important. Moreover the interesting decay modes are Cabibbo suppressed and have small branching fractions ( [6]). The large data sample available at BaBar will also be useful.
For this analysis, candidates reconstructed in the decay modes , , and are combined with a prompt charged track which creates Cherenkov light in the DIRC. The effective mass of the candidate is calculated using the kaon mass hypothesis so both and are reconstructed.
For each candidate, two variables are calculated using the fact that mesons are produced in pairs, and are almost at rest in the frame:
| (2) | ||||
| (3) |
Signal events will accumulate in a region of the plane which is centered on and (the nominal mass) whereas background events will accumulate in a region shifted to positive values but at the same values since depends only on the laboratory 3-momentum.
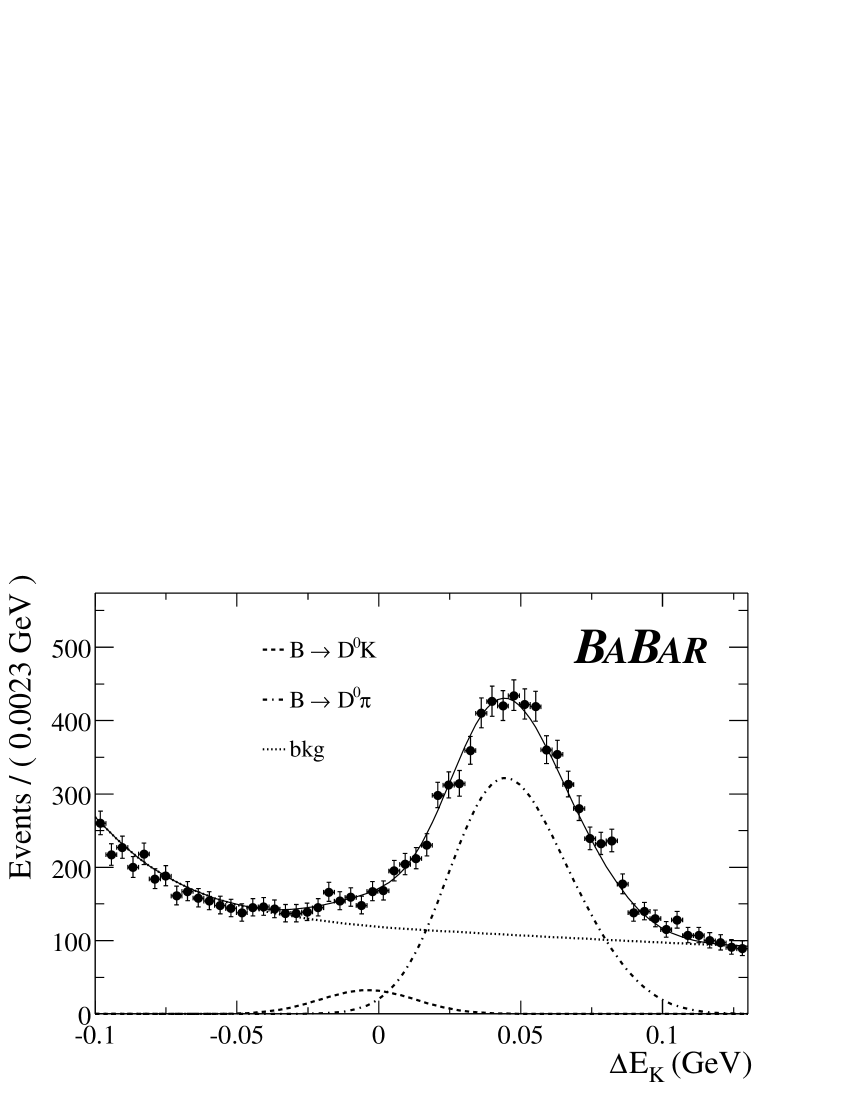
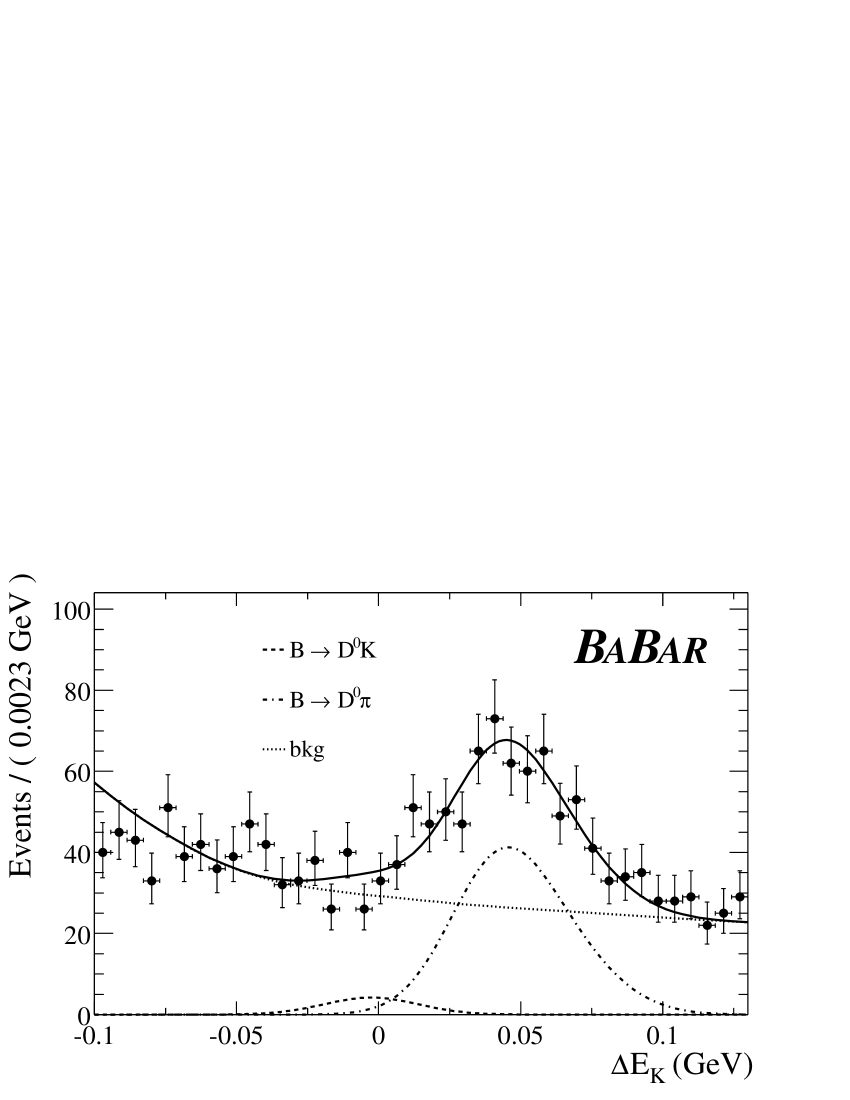
The number of signal events is computed with an extended maximum likelihood fit which makes use of the position of the candidate in the plane and of the Cherenkov angle of the prompt track to distinguish between events, events, peaking background and combinatorial background events.
Fig. 1 shows the projections for all candidates reconstructed in a sample of 56.4 fb-1 on-resonance data, with (left) and (right) decay modes. On each projection the fitted distribution and the contributions to the total function of , and background events are overlaid.
A clear evidence of the signal for is obtained requiring tight kaon identification criteria on the prompt track . The corresponding projections are shown on Fig. 2.
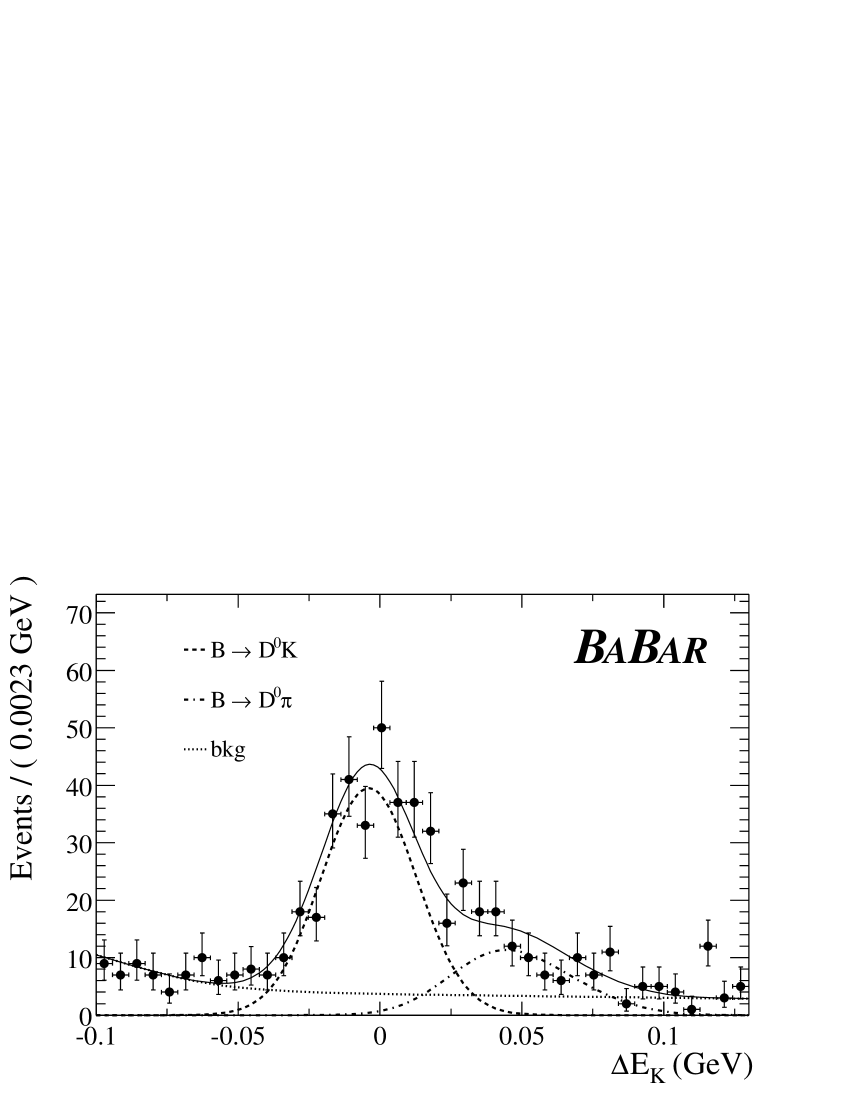
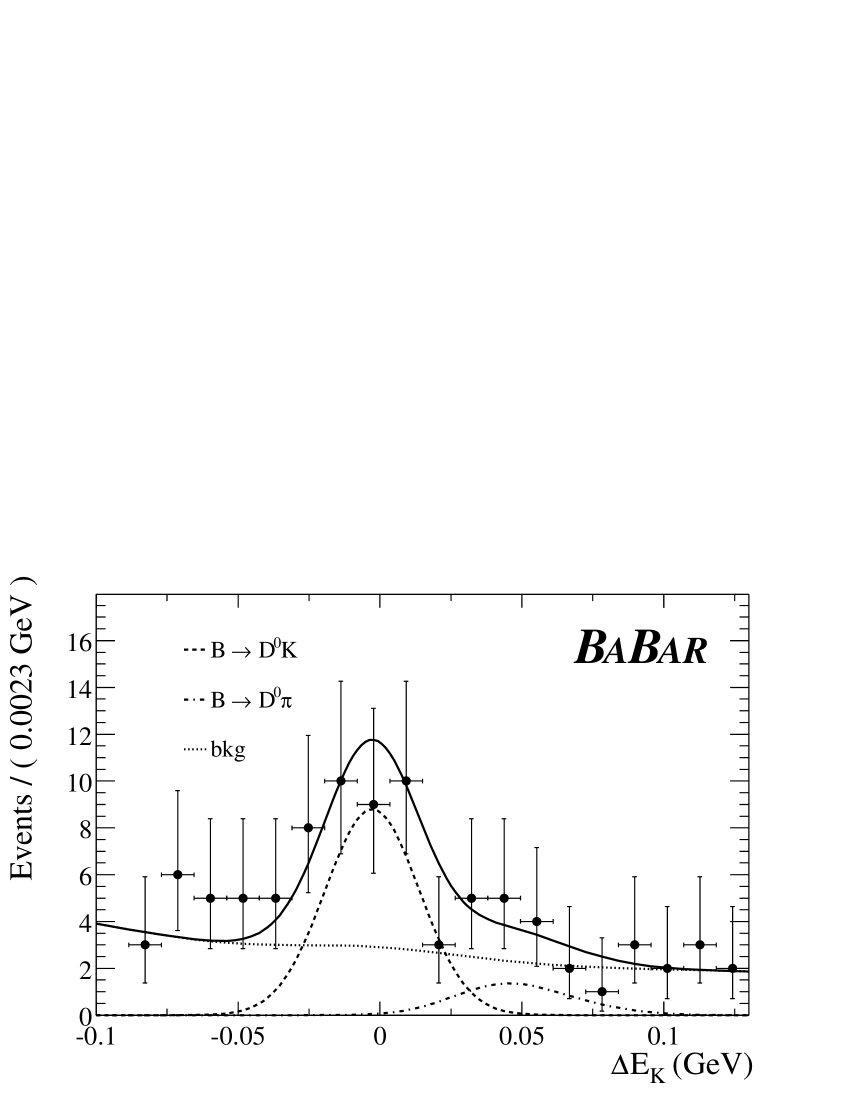
The branching fractions are extracted from these fits on the same data sample. The ratio to the branching fraction is measured equal to:
| (4) |
for non CP modes and to:
| (5) |
for CP-even modes (ie ).
The asymmetry has been found equal to:
| (6) |
3
mesons can decay either into (Cabibbo-Allowed diagram) or into (Cabibbo and suppressed diagram). Since mesons can also oscillate to , the time dependant evolutions of and are related to [7]. This method requires a lot of events to lead to a precise measurement. It may be interesting to use the similar decay mode which has a larger branching fraction: from [6], and .
In order to reconstruct even more events, the analysis described here makes use of a partial reconstruction technique [8], using only the soft pion from the decay and the . With respect to the full reconstruction technique, it has thus no penalty due to the branching fractions of the reconstructed decay modes. Since the soft pion in the decay has a low momentum, it is very often only reconstructed in the SVT and the analysis requires a good stand-alone track reconstruction capability of this device.
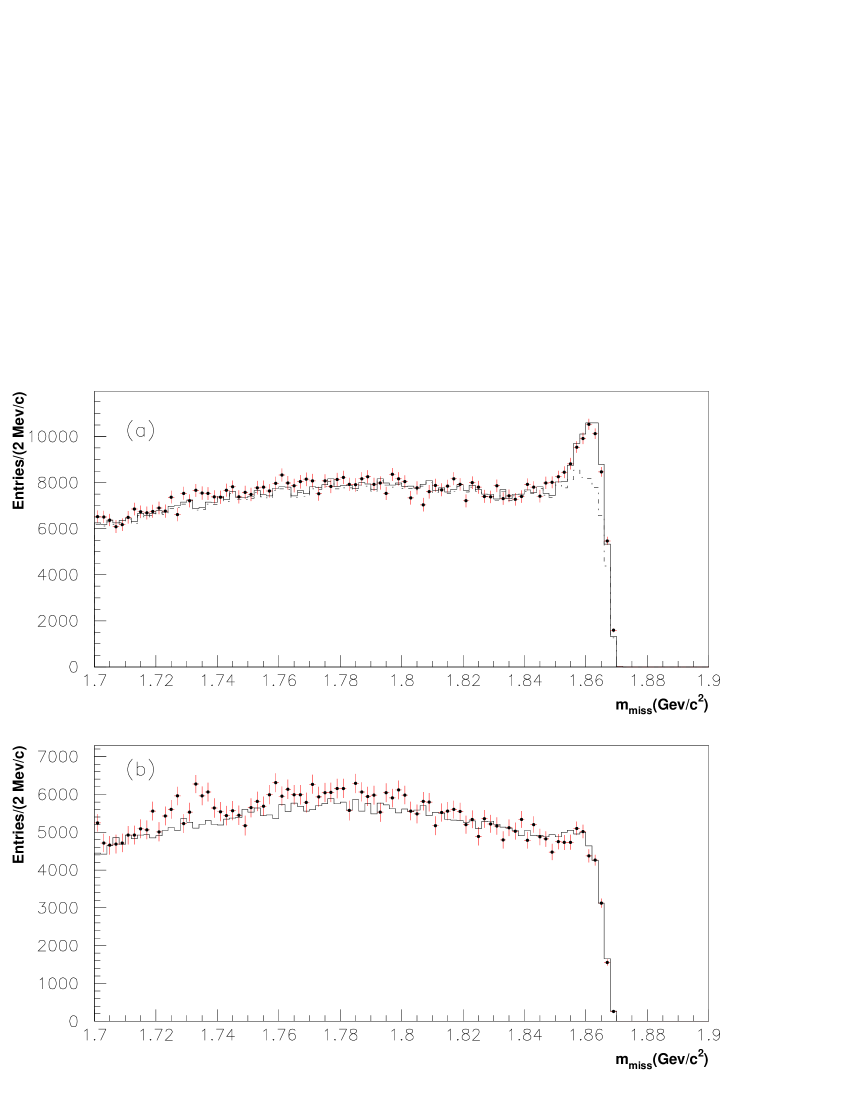
In the decay chain , only the and the slow from the decay are reconstructed. is only reconstructed in the decay mode whose branching fraction is supposed to be equal to 49.2 %. The remaining 12 parameters are determined by applying the constraints of 4-momentum conservation to the and decay, the invariant masses of the , and and the energy in the Center of Momentum frame, that is to say the half of the Center of Mass energy. By applying the beam energy and mass constraints, the angle between the and the momentum can be computed. The 4-momentum is known up to an azimuthal angle around the momentum. is the only unknown parameter. The missing mass is computed averaging over .
For signal events, peaks at the nominal mass but the distribution is broader for background events. A large fraction of background events come from continuum events. This type of background is rejected in this analysis with a Neural Network algorithm [9] using the different topologies between continuum events which have a jet-like structure and events which are more spherical.
Fig. 3 shows the missing mass distributions obtained with a sample of 20.6 on-resonance data and 2.5 off-resonance data, for opposite sign combinations (top, ) and same sign combinations (bottom, ) where no signal is present. In the distributions presented, the distributions obtained from the off-resonance data are subtracted from that obtained from data recorded at the peak. To compute the total number of signal events, the resulting distribution for opposite sign combinations is fitted with a linear combination of a distribution from background Monte-Carlo events and a distribution from signal Monte-Carlo events. This procedure yields an estimated signal of events.
The branching ratio resulting from this analysis is found equal to:
| (7) |
An additional systematic bias due to the unknown presence of background decays has to be added to the systematic error. If this bias is:
| (8) |
4
The determination of with or mentioned in the previous section requires the knowledge of the ratio between the two decay amplitudes of the allowed and suppressed processes:
| (9) |
cannot be measured directly because the two processes cannot be distinguished experimentally. A way to measure is to study the decay whose branching fraction is related to [10]:
| (10) |
where and are the decay constants of and . The decay can also be used for a measurement of [11].
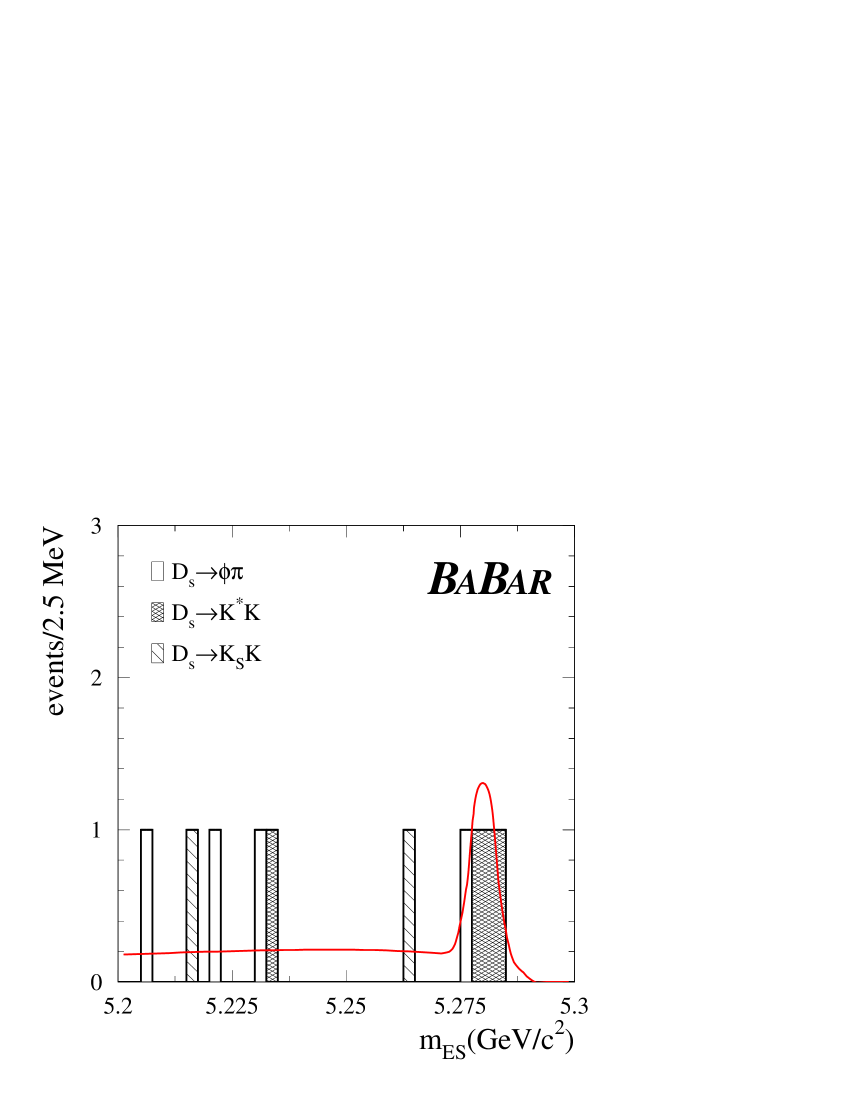
candidates are fully reconstructed, with candidates reconstructed in the decay modes: , and with , and . candidates are reconstructed in the decay mode . Background from continuum events is rejected using a Fisher discriminant [12] and the cosine of the angle between the thrust axis of the reconstructed and the thrust axis of the remaining tracks of the event. For jet-like continuum events, the two thrusts are back to back whereas for events, the cosine distribution is flat. The selection algorithm [13] makes use of kaon identification, vertex probability and the helicity angle in the decays and in order to reduce the combinatorial background from continuum and events.
Fig. 4 show the distributions obtained with 56.4 fb-1 on-resonance data. The mass distributions are fitted with a Gaussian function for the signal and a so-called “ARGUS” shape function for the background [14].
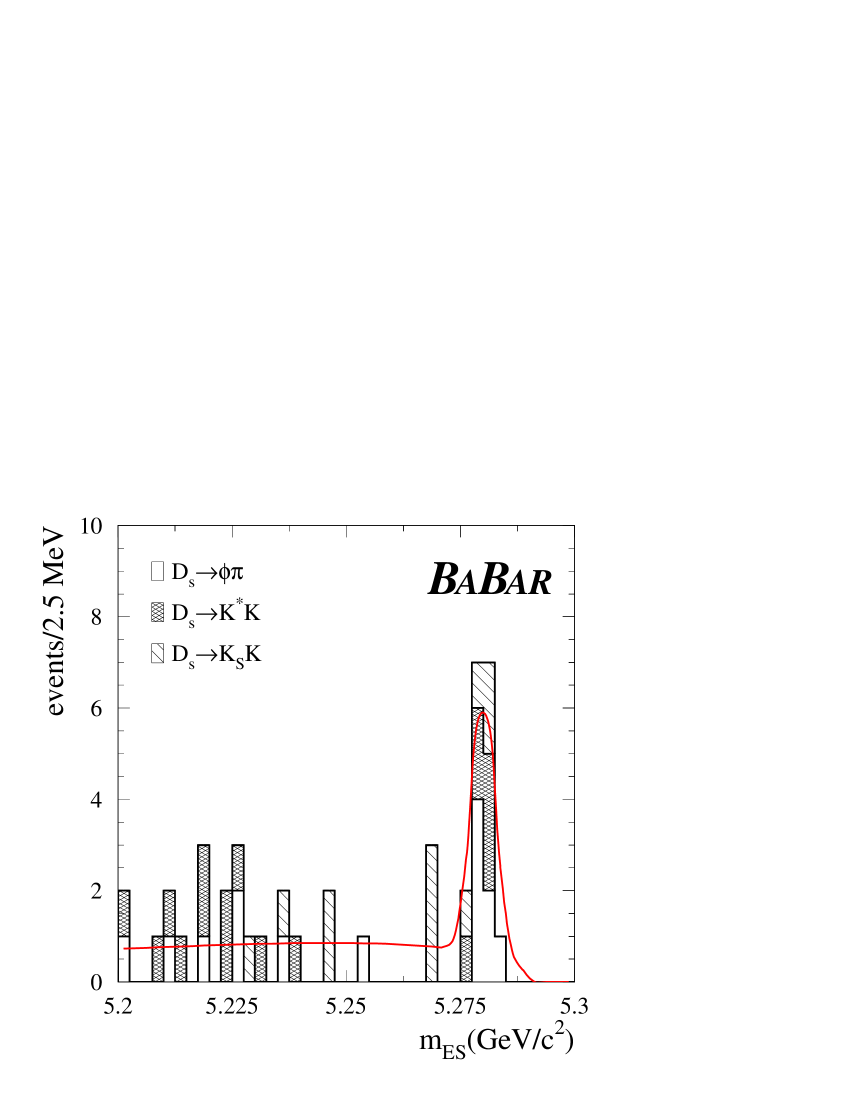
A signal of events is found for the decay mode with a statistical significance of 3.5 . This corresponds to a branching fraction of:
| (11) |
No significant signal is found for the decay mode. An upper limit at 90 % of confidence level is derived:
| (12) |
5 Conclusions
Preliminary results from the BaBar experiment have been presented concerning the branching fractions for the decay modes , and . These studies show the feasibility of the analyses but more statistics are needed to have access to the angle of the unitarity triangle.
References
- [1] N. Cabibbo, Phys. Rev. Lett. 10, 531 (1963); M. Kobayashi and T. Maskawa, Prog. Theo. Phys. 49, 652 (1973).
- [2] BaBar Collaboration, B. Aubert et al., Phys. Rev. Lett. 87, 091801 (2001), hep-ex/0107013; Phys. Rev. Lett. 86, 2515 (2001), hep-ex/0102030; Belle Collaboration, K. Abe et al., Phys. Rev. Lett. 87, 091802 (2001), hep-ex/0107061.
- [3] BaBar Collaboration, B. Aubert et al., Nucl. Instrum. Methods A479, 1 (2002), hep-ex/0105044.
- [4] M. Gronau and D. Wyler, Phys. Lett. B265, 172 (1991); M. Gronau and D. London, Phys. Lett. B253, 483 (1991).
- [5] D. Atwood, I. Dunietz and A. Soni, Phys. Rev. Lett. 78, 3257 (1997), hep-ph/9612433.
- [6] K. Hagiwara et al., Phys. Rev. D66, 010001 (2002).
- [7] P. F. Harrison and H. R. Quinn (ed.), BaBar Physics Book, 1998, Chap. 7.6 and references therein.
- [8] BaBar Collaboration, B. Aubert et al., hep-ex/0207085.
- [9] F. Salvatore and G. Cowan, J. Phys. G27, 1356 (2001), hep-ph/0102159.
- [10] I. Dunietz, Phys. Lett. B427, 179 (1998), hep-ph/9712401.
- [11] C. S. Kim, Y. Kwon, J. Lee, and W. Namgung, Phys. Rev. D64, 094506 (2001).
- [12] BaBar Collaboration, B. Aubert et al., Phys. Rev. Lett. 87, 151802 (2001), hep-ex/0105061.
- [13] BaBar Collaboration, B. Aubert et al., hep-ex/0205102.
- [14] ARGUS Collaboration, H. Albrecht et al., Z. Phys. C48, 543 (1990).