UT-ICEPP 03-06 July 2003
Solution of Orthopositronium lifetime Puzzle
Contribution to Proceedings of
Workshop on Positronium Physics
ETH Honggerberg Zurich (May 30-31 2003)
S. Asai 111Mailing address: CERN EP-Div, CH-1211, Geneva 23, Switzerland, E-mail address: Shoji.Asai@cern.ch, O. Jinnouchi and T. Kobayashi
The intrinsic decay rate of orthopositronium formed in powder is measured using the direct correction method such that the time dependence of the pick-off annihilation rate is precisely determined. The decay rate of orthopositronium is found to be , which is consistent with our previous measurements with about twice the accuracy. Results agree well with the QED prediction, and also with a result reported very recently using nanoporous film.
ICEPP
International Center for Elementary Particle Physics,
University of Tokyo
7-3-1 Hongo, Bunkyo-ku, Tokyo 113-0033, Japan
1 History: Orthopositronium lifetime puzzle
Positronium (Ps), the bound state of an electron and a positron, is a purely leptonic system, and the triplet () state of Ps, orthopositronium(o-Ps), decays slowly into three photons. Precise measurement of this decay rate gives us direct information about quantum electrodynamics(QED) in bound state.
Three precision measurements[1, 2, 3] of the o-PS decay rate were performed at Ann Arbor, which reported decay rate values much larger, i.e., 5.2 – 9.1 experimental standard deviations, than a QED prediction[4] () corrected up to . This discrepancy has been referred as ‘orthopositronium lifetime puzzle’, and was long-standing problem. To elucidate discrepancies, a variety of experiments have since been carried out to search for the exotic decay mode of o-Ps, resulting in no evidence so far [5, 6, 7, 8, 9, 10].
As some fraction of o-Ps inevitably results in ‘pick-off’ annihilations due to collisions with atomic electrons of the target material, the observed o-Ps decay rate is a sum of the intrinsic o-Ps decay rate and the pick-off annihilation rate into ’s, , i.e.,
| (1) |
is proportional to the rate of o-Ps collisions with the target materials, i.e.; , where is product of the density of the target, the annihilation cross-section, and the time dependent velocity of o-Ps. Due to the thermalization process of o-Ps, this necessitates expressing as a function of time whose properties are dependent on the surrounding materials. Thermalization process should be carefully treated even in the cavity experiment[3]. Although pickoff correction is small in cavities, disappearance of o-Ps through the cavity entrance aperture has large contribution to . This disappearance rate is also proportional to , as the same reason. Since the rate of elastic collision is extremely small in cavities, it takes much time, longer than 1 , to thermalize well, and the disappearance rate still depends strongly on time.
In previous measurements[1, 2, 3], ’s were measured by varying the densities of the target materials, size of the cavities and also the entrance aperture of the cavities. The extrapolation to zero density or aperture was expected to yield the decay rate in a vacuum, , under the assumption of quick thermalization (shorter than 170-180 nsec) with constant o-Ps velocity. However, this assumption contains a serious systematic error as pointed out in reference[11, 12].
We have proposed the following entirely new method[12], which is free from above-mentioned systematic error. The energy distribution of photons from the 3-body decay is continuous below the steep edge at 511 keV, whereas the pick-off annihilation is 2-body which produces a 511 keV monochromatic peak. Energy and timing information are simultaneously measured with high-energy resolution germanium detectors such that can be determined from the energy spectrum of the emitted photon. Once a precise thermalization function is obtained, will contain all information about the process. The population of o-Ps at time , can be expressed as
| (2) |
Providing the ratio is determined as a function of time, the intrinsic decay rate of o-Ps, , can be directly obtained by fitting the observed time spectrum.
We obtained decay rate of and independently[12, 13], which are consistent with the non-relativistic QED calculation[4], and quite differ from the results obtained at Ann Arbor[1, 2, 3], 7.0482(16)–7.0516(13). The observed indicates that o-Ps thermalization is slow and it is serious systematic problem in all experiments using an extrapolation. In 1998, they recognized that the incomplete thermalization makes the serious problem in their results[15], but they did not update results, and the discrepancy still remaining.
There are also still several problems remained in our result[12]: (i) accuracy was , being worse than those of the other experiments[1, 2, 3], (ii) There was unknown systematic uncertainties before , and therefore to remove this uncertainty, final results were obtained using data after , and (iii) systematic error regarding the Stark effect was not estimated. Improving results by considering these problems is described[14] here, and we report the final result using our new method.
2 Experiment
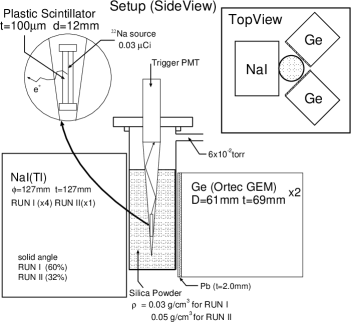
Figure 1 shows a diagram of the experimental setup; A positron source (dia., ) with approximate strength of , being sandwiched between two sheets of plastic scintillators and held by a cone made of aluminized mylar. The cone was situated at the center of a cylindrical -diameter vacuum container made of -thick glass, being filled with powder and evacuated down to Torr. Two different types of powder were used as listed in Table 1, with the biggest difference being in the mean distance between grains such that different pick-off ratio would be obtained. Using these powders, two 6-month runs were performed.
| RUN1 | RUN2 | |
|---|---|---|
| primary grain size (nm) | 7 | 7 |
| surface area () | ||
| density ( | 0.03 | 0.05 |
| mean distance between grains (nm) | 340 | 200 |
| surface | hydrophile | hydrophobe |
Most of the emitted positrons pass through the scintillator, transmitting a light pulse to a photomultiplier(Trigger PMT) and forming Ps when stopped in the silica powder. Two high-purity coaxial germanium detectors (Ortec GEM38195) precisely measured the thermalization process. Energy resolutions were measured using several line sources, with typical resultant values of and at 514 keV. Lead sheets 2.0--thick were placed in front of each detector for suppressing contributions from simultaneous low-energy hits from the 3 decay of o-Ps. Four large cylindrical NaI(Tl) scintillators (Scionix 127A127/5; 127 127 ) simultaneously measured the time and energy information from each decay.
A new time-to-digital converter (TDC) was developed and employed for the present measurement. This direct clock-counting type TDC(2GHz) has a time-resolution of with known accuracy of 1-. The time range for each channel is , and the integral non-linearity, which is an important source of systematic errors, is controlled to be extremely small at . To provide a systematic check, we used a 200-MHz internal clock-based TDC with 5 time resolution.
The trigger PMT signal is fed into a fast leading discriminator whose output provides common start signals for the TDCs. Each output signal from the photo-multipliers to the NaI(Tl)s is fed into three ADCs and a fast leading edge discriminator that provides stop signals for the TDCs and gate timing for the ADCs. One ADC with a 3- gate width, measures the whole charge for the duration of the signal. The other two ADCs eliminate pile-up events at the tail of the signal and base-line fluctuations, respectively. One ADC measures the signal charge with a narrower gate width (250 ) comparable to the intrinsic decay time constant of the NaI(Tl) scintillator, while another ADC measures the base-line condition of the signal (180 width) just prior to the event. All gates for these ADCs are individual and gate timings are optimized for signal timings.
Signal outputs from the Ge detectors are used for timing measurements and obtaining precise energy information. One signal is fed into a fast-filter amplifier (FFA) whose output is used as the stop signal for the TDCs, two auxiliary ADC signals, and three discriminaters whose thresholds are set at , and mV. Each FFA output is fed into another high-resolution TDC having fine resolution of . Signal timings are determined utilizing signal shapes calculated from different threshold discriminating times and extrapolating to the intrinsic timing[14]. Good time resolution of is obtained, as is efficient rejection power for slow rise signal components known to disturb Ge timing spectroscopy. Similar to the NaI(Tl) detectors, the two auxiliary ADCs effectively reject pile-up events by measuring the signal charge with a narrower gate and earlier timing gate. Precise time and energy resolutions can be obtained with this rejection scheme. The other output from each Ge detector is independently fed into a spectroscopy amplifier. Amplified with a 6- time constant, output is provided to a Wilkinson type peak- holding ADC that provides a precise energy spectrum.
3 Analysis and discussion
The ratio is determined using the energy spectrum measured by the Ge detectors. The energy spectrum of the o-Ps decay sample, referred to as the o-Ps spectrum, is obtained by subtracting accidental contributions from the measured spectrum.
The -decay continuum spectrum is calculated using Monte Carlo simulation in which the geometry and various material distributions are reproduced in detail. For every simulated event, three photons are generated according to an order--corrected energy spectrum[20]. Successive photoelectric, Compton, or Rayleigh scattering interactions of every photon are then followed through the materials until all photon energy is either deposited or escapes from the detectors. The response function of the detectors is determined based on the measured spectrum of monochromatic -rays emitted from , , and , with this function being used in the simulation. We refer to the obtained spectrum as the -spectrum which is normalized to the o-Ps spectrum with the ratio of event numbers within the region (480-505 keV).
Figure 2(a) shows good agreement between the o-Ps spectrum and spectrum below 508 keV, where the pick-off annihilation peak is evident at the edge of the -decay continuum. The lead sheets in front of the Ge detectors effectively suppress the contribution from events in which two low-energy ’s emitted from a - decay simultaneously hit one detector and that the -spectrum well reproduces such simultaneous events. Figure 2(b) shows an enlarged view of the observed o-Ps spectrum after subtracting the -spectrum, where good agreement with a detector response function is present. The centroid of this spectrum is , which is consistent with (keV). This indicates successful subtraction of the contribution, and the resultant peak can be regarded as pure pick-off annihilation samples. Obtained ratio of is for time window of .


These calculations of the are performed for various time windows, and its time dependence is shown in Fig. 3. Since the fractional energy loss of o-Ps per collision with powder and the collision rate are both dependent on its energy, the time dependence of the average kinetic energy of o-Ps at time , can be derived from the Boltzmann equation
| (3) |
where is the mass of o-Ps, room temperature, and the Boltzmann constant. The last term, the momentum transfer cross-section of is expanded in terms of , i.e., the coefficients represent the effect of effective mass at the surface of the grain and mean distance between the grains. Since the pick-off rate is proportional to the average velocity of the o-Ps, the ratio can be expressed by a differential equation[16], i.e.,
| (4) |
where is a constant, , and the last summation term in Eq. 3 is replaced with an arbitrary real number . The measured ’s are fit with this equation and figure 3 shows best fit results using the MINUIT library, where the pick-off rate cannot be assumed as constant, even in powder where the collision rate is expected to be higher.


Figure 4 shows the time spectrum of NaI(Tl) scintillators for RUN 1 with an energy window of keV, in which a sharp peak of the prompt annihilation is followed by the exponential decay curve of o-Ps and then the constant accidental spectrum. The o-Ps curve is widely observed over about corresponding to about eight times the o-Ps lifetime, because of the weak positron source used in this experiment and good suppression of accidental contributions by selecting the -energy. Observation in the wide range is important to understand time-dependence of . To effectively eliminate pile-up events, a base-line cut condition was applied, and to further reject pile-up events, events with small differences between two ADC values (wide and narrow gates) were selected.
We fit resultant time spectrum using the least square method, i.e.,
| (5) |
where and are the detection efficiencies for pick-off annihilations and decays, and is an experimental random counting rate representing the fact that time interval measurement always accept the first as a stop signal. is about due to the low-density of the powder, i.e., the ratio of error propagation to decay rate is suppressed by a factor of 100.

Figure 5 shows obtained fitting as a function of fitting start time for both runs, where values are stable with respect to fitting start time except those before . Since the fitting ’s for both runs rapidly increase before due to the tail effect of prompt peak, values at are taken as the final results. The reduced ’s at are and for RUN 1 and RUN 2, respectively. The fitted values of decay rate are extremely flat after 90 nsec, and are confirmed to be independent of fitting start time111 The systematic increase in decay rate before observed in previous measurement[12] was eliminated using the new system.. The obtained decay rates are for RUN 1 and for RUN 2, which are consistent with each other. As shown in Fig. 3, the thermalization process and pickoff ratio are different within each run, the good correspondence between two runs is obtained. This indicates that our method correctly takes into account thermalization and pickoff correction.
| Source of Contributions | RUN1 () | RUN2 () |
|---|---|---|
| TDC module dependence | ||
| – Calibration | ||
| – Stability | ||
| – Integral Non Linearity | ||
| – Differential Non Linearity | Negligible | Negligible |
| Cut condition dependence | ||
| – Base Line Selection | and | and |
| – WD-NW condition | and | |
| Monte Carlo dependence | ||
| – Normalization | ||
| – Relative efficiency | ||
| of NaI(Tl) scintillator | ||
| – Inhomogeneity of powder | ||
| Other Sources | ||
| – Zeeman effect | ||
| – Three-photon annihilation | ||
| – Stark effect | ||
| – excited state | ||
| Total | and | and |
Table 2 summarizes estimates of various systematic errors, and the details are shown in reference[14]. We just mention here about errors related to simulation and Stark effect.
Monte Carlo simulation related errors: the predominant contribution to total systematic error is produced by uncertain normalization. That is, the number of pick-off events are determined by subtracting the normalized 3- spectrum of Monte Carlo simulation from the o-Ps spectrum, where changing the normalization factor affects the values and eventually propagates to the final result. Since the sharp fall-off of the 3-spectrum at 511 keV is solely produced by the good Ge energy resolution of keV, this subtraction only affects the lower side of the pick-off spectrum such that improper subtraction results in asymmetry of the pick-off spectrum shape. Comparison of the asymmetries of the pick-off peak shape and the prompt peak annihilation spectrum is a good parameter for estimating this systematic error. The 1 error is assessed as . Inhomogeneity of the powder affects on the detection efficiency. powder density in the MC simulation is conservatively changed by although the uniformity is known to be within a few %; a change resulting in an error of ppm.
The Stark shift stretches the lifetime of Ps atoms, i.e., a perturbative calculation shows that the shift is proportional to a square of the effective electric field such that , where . is defined as the root-mean-square electric field sensed by o-Ps during its lifetime. Calculations have estimated two contributions exist based on measurements of the electrical charge-up on the primary grains of silica powders and electrical dipole moment on the surface of grains[14]. The charge-up is partly intrinsic depending on powder specifications and partly due to positron depositions from the source. The effect, however, is negligible in both cases, i.e., on the level of at most. Silanol functional groups on the surface of the powder grain behave as an electrical dipole moment creating an effective field around the grains. Average densities are measured to be and for RUN 1 and 2, respectively. Accordingly, the effective field can be analytically calculated such that the contribution to the o-Ps decay rate is determined to be for RUN1 and for RUN2. These estimations were confirmed using results from precise hyper-fine-structure (HFS) interval measurements of ground state Ps in silica powder[18], where the interval is proportional to the size of Stark effect. Considering the difference in powder densities used, the HFS results are consistent with our estimation.
Other sources of systematic errors: Error contribution due to the Zeeman effect is estimated using the measured absolute magnetic field around the positronium assembly (). Since the 3- pick-off process can only occur at a certain ratio, the calculated relative frequency is consistent with previous measurements[17], being for RUN1 and for RUN2. The probability of the excited state (n=2) of Ps is about [19], which could make the intrinsic decay rate smaller due to the low decay rate ()
The above discussed systematic errors are regarded as independent contributions such that the total systematic error can be calculated as their quadratic sum, resulting in , for RUN1 and , for RUN2.
4 Conclusions
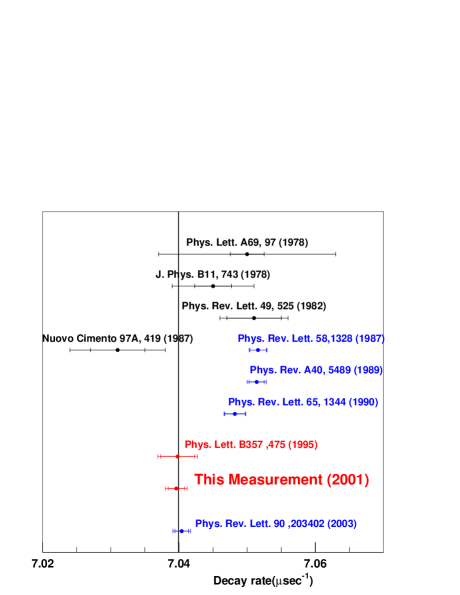
The decay rate of o-Ps formed in was measured using a direct correction method in which the thermalization effect of o-Ps is accounted for and integrated into the time spectrum fitting procedure. Consistent results were obtained using two runs with different types of powders, i.e., and a weighted average gave , which agrees well with our previous result[12, 13], it disagrees with results obtained at Ann Arbor, i.e., by 3.8– [2, 3]. As illustrated in Fig. 6, our value agrees well with the NRQED prediction corrected up to term[4]. We confirm our results obtained at 1995 and 2000, and improve accuracy by factor of 1.8.
Just one week before this workshop, Ann Arbor reported new result[21] using nanoporous silica film, which produces near-thermal energy o-Ps. They recognized the systematic problem due to unthermalized o-Ps (fast o-Ps) and suppress the kinetic energy of the emitted o-Ps using nanoporous silica film and positron beam energy. They obtain value of , which completely agrees with our results as shown in Fig.6. So we can conclude that the unthermalized o-Ps has contributed large systematic errors of about 1000 ppm and made discrepancy between the QED prediction as pointed out in references[11, 12]. Now two groups (two methods) obtain the consistent results and the orthopositronium lifetime puzzle is clearly solved here. The combined results of two different methods is , which is not enough accuracy(140ppm) to examine the -correction (210ppm). We need much effort to improve accuracy.
We wish to thank Prof. S. Orito, T. Hyodo and Y. Nagashima (Univ. of Tokyo) for very useful suggestions for discussions. It is a pleasure to thank Prof. G.S. Adkins (Franklin & Marshall College) for calculating the corrected energy spectrum.
References
- [1] C. I. Westbrook, D. W. Gidley, R. S. Conti, and A. Rich, Phys. Rev. Lett. 58 1328 (1987).
- [2] C. I. Westbrook, D. W. Gidley, R. S. Conti, and A. Rich, Phys. Rev. A40 5489 (1989).
- [3] J. S. Nico, D. W. Gidley, A. Rich, and P. W. Zitzewitz, Phys. Rev. Lett. 65 1344 (1990).
- [4] G. S. Adkins, R. N. Fell, and J. Sapirstein, Phys. Rev. Lett. 84 5086 (2000) and Ann. Phys. 295 136 (2002).
-
[5]
S. Asai, S. Orito, K. Yoshimura, and T. Haga, Phys. Rev. Lett. 66 2440 (1991);
S. Orito, K. Yoshimura, T. Haga, M. Minowa, and M. Tsuchiaki, Phys. Rev. Lett. 63 597 (1989). -
[6]
T. Maeno, M. Fujikawa, J. Kataoka, Y. Nishihara, S. Orito, K. Shigekuni, Y.
Watanabe, Phys. Lett. B351 574 (1995);
S. Asai, K. Shigekuni, T. Sanuki, and S. Orito, Phys. Lett. B323 90 (1994);
M. Tsuchiaki, S. Orito, T. Yoshida, and M. Minowa, Phys. Lett. B236 81 (1990) 81. - [7] T. Mitsui, R. Fujimoto, Y. Ishisaki, Y. Ueda, Y. Yamazaki, S. Asai, and S. Orito, Phys. Rev. Lett. 70 2265 (1993).
-
[8]
T. Mitsui, K. Maki, S. Asai, Y. Ishisaki, R. Fujimoto, N. Muramoto, T. Sato,
Y. Ueda, Y. Yamazaki and S. Orito, it Euro. phys. Lett. 33 111 (1996);
A. Badertscher, P. Crivelli, M. Felcini, S.N. Gninenko, N.A. Goloubev, P. Nedelec, J.P. Peigneux, V.Postoev, A. Rubbia and D. Sillou Phys. Lett. B542 29 (2002) -
[9]
S. Asai, S. Orito, T. Sanuki, M. Yasuda, and T. Yokoi, Phys. Rev. Lett. 66
1298 (1991);
D. W. Gidley, J. S. Nico, and M. Skalsey, Phys. Rev. Lett. 66 1302 (1991). - [10] K. Marko and A. Rich, Phys. Rev. Lett. 33 980 (1974).
- [11] S. Asai , T. Hyodo, Y. Nagashima, T.B. Chang and S. Orito, Materials Science Forum, 619 175 (1995).
-
[12]
S.Asai “ New measurement of orthopositronium lifetime”, Ph. D.
thesis, University of Tokyo (1994);
S. Asai, S. Orito, and N. Shinohara, Phys. Lett. B357 475 (1995). - [13] O. Jinnouchi, S. Asai, T. Kobayashi, hep-ex/0011011 (2000).
-
[14]
O. Jinnouchi, “Study of bound state QED: precision measurement of the
orthopositronium decay rate”, Ph. D. thesis, University of Tokyo (2001);
O. Jinnouchi, S. Asai, T. Kobayashi “Precision Measurement of Orthopositronium Decay Rate Using Powder ” accepted by Phys. Lett. B. - [15] M.Skalsey et al, Phys. Rev. Lett. 80 3727 (1998).
-
[16]
Y. Nagashima, T. Hyodo, K. Fujiwara, and A. Ichimura, J. Phys. B31 329
(1998);
Y. Nagashima, M. Kakimoto, T. Hyodo, K. Fujiwara, A. Ichimura, T. Chang, J. Deng, T. Akahane, T. Chiba, K. Suzuki, B. T. A. McKee, and A. T. Stewart, Phys. Rev. A 52 258 (1995). - [17] J. A. Rich, Phys. Rev 61 140 (1951).
- [18] M.H. Yam, P.O. Egan, W.E. Frieze, and V.M. Hughes, Phys. Rev. A18 350 (1978).
- [19] S. Hatamian, R. S. Conti, and A. Rich, Phys. Rev. Lett. 58 1833 (1987).
- [20] G.S. Adkins, private communication.
- [21] R. S. Vallery, P. W. Zitzerwitz and D. W. Gidley, Phys. Rev. Lett. 90 203402 (2003).