Precision Measurement of Orthopositronium Decay Rate Using Powder
Abstract
The intrinsic decay rate of orthopositronium formed in powder is measured using the direct correction method such that the time dependence of the pick-off annihilation rate is precisely determined using high energy-resolution germanium detectors. As a systematic test, two different types of powder are used with consistent findings. The intrinsic decay rate of orthopositronium is found to be , which is consistent with previous measurements using powder with about twice the accuracy. Results agree well with a recent QED prediction, varying experimental standard deviations from other measurements.
keywords:
Positronium, bound states , QEDPACS:
36.10.Dr, 11.10.St, , and
1 Introduction
Positronium (Ps), the bound state of an electron and positron, is a pure quantum electro-dynamical system providing a highly sensitive field for testing bound state quantum electrodynamics (QED). The triplet () state of Ps, orthopositronium (o-Ps), will in most cases decay into three photons due to odd-parity under the C-transformation. Because o-Ps has a lifetime about 1140 times longer compared to the singlet state, parapositronium (p-Ps), this enables direct and precise measurement of the intrinsic decay rate of orthopositronium, [1, 2], although obtained values are much larger, i.e., 5.2 and 8.2 experimental standard deviations, than a recent non-relativistic QED calculation () corrected up to [3]. To elucidate discrepancies, a variety of experiments have since been carried out to search for the exotic decay mode of o-Ps, resulting in no evidence so far [4, 5, 6, 7, 8, 9, 10, 11, 12, 13].
As some fraction of o-Ps inevitably results in ’pick-off’ annihilations due to collisions with atomic electrons of the target material, the observed o-Ps decay rate is a sum of the intrinsic o-Ps decay rate and the pick-off annihilation rate into ’s, , i.e.,
| (1) |
Contributions from exotic decays are assumed to be zero because they are confirmed to be less than [4, 5, 6, 7, 8, 9, 10, 11, 12, 13]. is proportional to the rate of o-Ps collisions with the target materials, i.e.; , where is the density of the target, is the annihilation cross section, and the time dependent velocity of o-Ps. Due to the thermalization process of o-Ps, this necessitates expressing as a function of time whose properties are dependent on the surrounding materials.
In previous measurements [1, 2], ’s were measured by varying the densities of the target materials () or size of the cavities. For the uniform distribution of o-Ps in the cavity, is depending on the size and shape of the cavity due to the relation, , where is the average o-Ps velocity, is the cavity surface area, and is the volume of the cavity.
The extrapolation to zero gas density or infinite cavity size was expected to yield the decay rate in a vacuum, , under the assumption of quick thermalization with constant o-Ps velocity. However, this assumption contains a serious systematic error as pointed out in reference [14] in that it would make the obtained decay rate larger than the true value; i.e., the time-spectrum fitting was carried out using a simple exponential function, , where represents the flat spectrum of accidental events. In order to cleanly eliminate the contribution from the prompt annihilations and fast p-Ps decay component, the decay spectrum needs to be fitted for times after these components decay away. A somewhat fast, beginning time of the fitting range was adopted to obtain the high statistics: the cavity experiment typically used for all runs [2], while the gas experiment [1] used for all gases except the lowest pressure and neopentane runs. Because it takes several hundred for o-Ps to thermalize via elastic collisions with surrounding molecules to an ultimate energy of about eV depending on the type of target material [15, 16], such fast tends to result in larger values of . Moreover, in the cavity experiment, o-Ps is not well thermalized due to the small escape and collision rates.
The new technique called the direct correction method was introduced to overcome the problem regarding the extrapolation. The following section briefly explains its concept and procedure. Once a precise thermalization function is obtained, will contain all information about the process. The population of o-Ps at time , can be expressed as
| (2) |
The energy distribution of photons from the 3-body decay is continuous below the steep edge at 511 keV, whereas the pick-off annihilation is 2-body which produces a 511 keV monochromatic peak. Energy and timing information are simultaneously measured with high-energy resolution germanium detectors such that can be determined from the energy spectrum of the emitted photon. Providing the ratio is determined as a function of time, the intrinsic decay rate of o-Ps, , can be directly obtained by fitting the observed time spectrum. The direct correction method makes any extrapolation procedure unnecessary and precluding use of the hypothesis of linear dependence at vacuum limit or o-Ps behavior at the material surface.
2 Experiment
The direct 2 correction method first applied in 1995 [17] provided consistent results with QED predictions, yet several problems remained: (i) accuracy was , being worse than those of the other experiments [1, 2], (ii) decay rates systematically increased before due to an unknown reason, and therefore to remove this uncertainty, final results were obtained using data after , and (ii) systematic error regarding the Stark effect was not estimated. Improving the method by considering these problems will be described in the later sections.
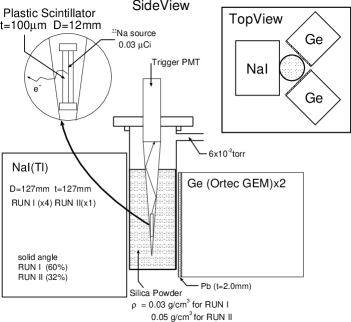
We employed a positron source (dia., ) with approximate strength of , being sandwiched between two sheets of plastic scintillators (NE104) and held by a cone made of aluminized mylar (Fig. 1). The scintillators and mylar were - and -thick, respectively, corresponding to a total area density of about . The cone is situated at the center of a cylindrical -diameter vacuum container made of -thick glass, being filled with powder and evacuated down to Torr. Two different types of powder (Nippon Aerosil Ltd.) were used (Table 1), with the biggest difference being in the mean distance between grains ( vs. ) such that different pick-off ratio would be obtained. Using these powders, two 6-month runs were performed (RUN1 and 2). To remove water molecules absorbed on the grain surface, the powder was heated just before evacuation.
| RUN1 | RUN2 | |
|---|---|---|
| primary grain size (nm) | 7 | 7 |
| surface area () | ||
| density ( | 0.03 | 0.05 |
| mean distance between grains (nm) | 340 | 200 |
| surface | hydrophile | hydrophobe |
While traveling through the scintillators, the source-emitted positrons deposit energy from keV which produces scintillation photons transmitted to the trigger PMT (Hamamatsu H3165-04). The magnetic field around the assembly is measured to be , equivalent to terrestrial magnetism which barely contributes to the mixing between o-Ps and p-Ps estimated to be . The observed o-Ps is therefore regarded as a pure o-Ps sample.
Two high-purity coaxial germanium detectors (Ortec GEM38195), referred to as Ge0 and Ge1, precisely measured the thermalization process, respectively having crystal sizes of 58.3 and 60.3 mm in dia. and 73.8 and 67.4 mm in length, and a solid angle of 5.7 and 6.0% of . Energy resolutions were measured using several line sources, with typical resultant values of and in sigma for Ge0 and Ge1, respectively, at 514 keV. Lead sheets 2.0--thick were placed in front of each detector for suppressing contributions from simultaneous low-energy hits from the 3 decay of o-Ps.
Four large cylindrical NaI(Tl) scintillators (Scionix 127A127/5; 127 127 ) simultaneously measured the time and energy information from each decay. Due to their higher efficiency and faster time response, the time spectrum can be fit to the o-Ps decay rate determination. At 662 keV, their energy resolution is typically 22.0, 24.4, 21.4, and 32.0 keV.
A new time-to-digital converter (TDC) was employed, jointly developed with the High Energy Accelerator Research Organization (KEK) and customized for the present measurement. This direct clock-counting type TDC, referred to as the 2-GHz TDC, has a time-resolution of with known accuracy of 1-, equipped with 8 channels being able to accommodate multiple signals. The time range for each channel is , and the integral non-linearity (INL) is expected to be extremely small at . To provide a systematic check, we used a 200-MHz internal clock-based TDC (Hoshin C006) with 5 time resolution.

The electronic system consists of three sections: the trigger, NaI(Tl), and Ge sections. Each has a latch veto structure to prevent overlapping events. The main latch of the trigger section is set by the signals themselves and released with system reset. To ensure precise measurement, the latches of the NaI(Tl) and Ge sections are also set by themselves and released by reset signals from the trigger section. The trigger PMT signal is fed into a fast leading discriminator whose output provides common start signals for the TDCs as well as their reset signals. Each output signal from the photo-multipliers to the NaI(Tl)s is fed into three ADCs and a fast leading edge discriminator that provides stop signals for the TDCs and gate timing for the ADCs. One ADC with a 3- gate width, called the NAI-WD (Lecroy 2249W), measures the whole charge for the duration of the signal, with slewing correction being carried out using energy information. The other two ADCs eliminate pile-up events at the tail of the signal and base-line fluctuations, respectively. The NAI-NW (mainly Lecroy 2249W) ADC measures the signal charge with a narrower gate width (250 for RUN1 and 400 for RUN2) comparable to the intrinsic decay time constant of the NaI(Tl) scintillator, while the NAI-BS (Lecroy 2249A) ADC measures the base-line condition of the signal (180 width) just prior to the event. All gates for these ADCs are individual and gate timings are optimized for signal timings.
Signal outputs from the Ge detectors are used for timing measurements and obtaining precise energy information. One signal is fed into a fast-filter amplifier (FFA)(Ortec 579) whose output is used as the stop signal for the TDCs, two auxiliary ADC signals, and three discriminators whose thresholds are set at , and mV. Each FFA output is fed into another high-resolution TDC having fine resolution of . Signal timings are determined utilizing signal shapes calculated from different threshold discriminating times and extrapolating to the intrinsic timing [18]. Good time resolution of is obtained, as is efficient rejection power for slow rise signal components known to disturb Ge timing spectroscopy. Similar to the NaI(Tl) detectors, the two auxiliary ADCs effectively reject pile-up events by measuring the signal charge with a narrower gate (2.0(1.3) width for RUN2(1)) and earlier timing gate (200 ns width just prior to the signal). Precise time and energy resolutions can be obtained with this rejection scheme. The other output from each Ge detector is independently fed into a SHAPER spectroscopy amplifier (Ortec 673). Amplified with a 6- time constant, the uni-polar output is provided to a Wilkinson type peak-holding ADC called GE-WD that provides a precise energy spectrum. For RUN1 and RUN2, and events were recorded, respectively. Each run had a total data acquisition period of about six months. Area temperature was maintained within to ensure stability of the amplifiers, ADCs, and TDCs.
3 Analysis and discussion
The ratio is determined using the energy spectrum measured by the Ge detectors. The energy spectrum of the o-Ps decay sample, referred to as the o-Ps spectrum, is obtained by subtracting accidental contributions from the measured spectrum. The -decay continuum spectrum is calculated using Monte Carlo simulation in which the geometry and various material distributions are reproduced in detail. Three photons are generated according to the corrected energy spectrum [19], followed by successive photo-electric, incoherent, and coherent interactions with materials until all photon energy is either deposited or escapes from the detectors. The response function of the detectors is determined based on the measured spectrum of monochromatic -rays emitted from , , and , with this function being used in the simulation. We refer to the obtained spectrum as the -spectrum which is normalized to the o-Ps spectrum with the ratio of event numbers within the energy domain 480-505 keV. The region is chosen to minimize, the Compton scattering effect from pick-off events, dependence of the detector efficiencies on energy, and the correction to the -spectrum. Figure 3(a) shows good agreement between the o-Ps spectrum and spectrum below 508 keV, where the pick-off annihilation peak is evident at the edge of the -decay continuum. It should be noted that the lead sheets in front of the Ge detectors effectively suppress the contribution from events in which two low-energy ’s emitted from a -decay simultaneously hit one detector and that the -spectrum well reproduces such simultaneous events.


Figure 3(b) shows an enlarged view of the observed o-Ps spectrum after subtracting the -spectrum, where good agreement with a detector response function [20, 21] is present. The centroids of the peak spectrum are obtained as for RUN1 and for RUN2. Good consistency with (keV) indicates successful subtraction of the contribution such that the resultant peak can be regarded as pure pick-off annihilation samples. Obtained ratios of at a typical time window of are and for RUN1 and RUN2, respectively. The weighted mean time within the range for each run is (RUN1) and (RUN2). The large difference between the two runs originates from a different mean distance of powder grains (Table 1) since the lambda ratio is a function of time.
Figure 4 shows results when the procedures described above for a typical time window were applied to multiple, narrower time windows. Since the fractional energy loss of o-Ps per collision with powder and the collision rate are both dependent on its energy, the time dependence of the average kinetic energy of o-Ps at time , can be derived from the Boltzmann equation
| (3) |
where is the mass of o-Ps, room temperature, and the Boltzmann constant. The last term, the momentum transfer cross section of is expanded in terms of , i.e., the coefficients represent the effect of effective mass at the surface of the grain and mean distance between the grains. Since the pick-off rate is proportional to the average velocity of the o-Ps, the ratio can be expressed by a differential equation [22, 23], i.e.,
| (4) |
where is a constant, , and the last summation term in Eq. 3 is replaced with an arbitrary real number . The measured ’s are fit with Eq. 4, and the first-order differential equation is numerically solved using the Runge-Kutta method. The data point at a time window of is used for a fixed initial value. Fitting is carried out using four parameters: , , , and the deviation from fixed point found to be and for RUN1 and RUN2, respectively. These small values indicate that the fitted values rarely depend on the initial condition of the Runge-Kutta method.
Figure 4 shows best fit results using the MINUIT library [24], where the pick-off rate cannot be assumed as constant, even in powder where the collision rate is expected to be higher. Table 2 gives resultant values for these fitting parameters.

| Parameters | RUN 1 | RUN 2 |
| /d.o.f | 9.53/(23-4) | 12.27/(23-4) |

Figure 5 shows the time spectrum of NaI(Tl) scintillators for RUN 1 with an energy window of keV, where a sharp peak in prompt positron annihilation is followed by the exponential decay curve of o-Ps and then the constant accidental spectrum. The o-Ps curve is widely observed over about corresponding to about eight times the o-Ps lifetime, being partly due to the use of a weak positron source () and good suppression of accidental contributions by selecting the -energy. To effectively eliminate pile-up events, a base-line cut condition was applied, and to further reject pile-up events, events with small differences between two ADC values (wide and narrow gates) were selected.
After selecting events in the energy window of keV, we fit resultant time spectrum using the least square method, i.e.,
| (5) |
where and are the detection efficiencies for pick-off annihilations and decays. in the function is the measured stop rate of the NaI(Tl) scintillators, representing the fact that time interval measurement accepts only the first as a stop signal. is about due to the low-density of the powder, i.e., the ratio of error propagation to decay rate is suppressed by a factor of 100. The value of is estimated using Monte Carlo simulation, yielding and 0.0607(6) for RUN 1 and RUN2, respectively. The time spectrum is corrected in terms of the (order of 1 kHz) before fitting. Fitting stop time is fixed at .

Figure 6 shows obtained fitting as a function of fitting start time for both runs, where values are stable with respect to fitting start time except those before . Since the fitting ’s for both runs rapidly increase before due to the tail effect of prompt events, values at are taken as the final results. The reduced ’s at are and for RUN 1 and RUN 2, respectively. Note the good correspondence between runs. Since no large difference in thermalization properties are apparent in Fig. 6, this indicates that our method correctly takes into account thermalization. The obtained decay rates are for RUN 1 and for RUN 2.
4 Discussion of systematic errors
| Source of Contributions | RUN1 () | RUN2 () |
|---|---|---|
| TDC module dependence | ||
| – Calibration | ||
| – Stability | ||
| – Integral Non Linearity | ||
| – Differential Non Linearity | Negligible | Negligible |
| Cut condition dependence | ||
| – Base Line Selection | and | and |
| – WD-NW condition | and | |
| Monte Carlo dependence | ||
| – Normalization | ||
| – Relative efficiency | ||
| of NaI(Tl) scintillator | ||
| – Inhomogeneity of powder | ||
| Other Sources | ||
| – Zeeman effect | ||
| – Three-photon annihilation | ||
| – Stark effect | ||
| – excited state | ||
| Total | and | and |
The sources of systematic errors are summarized in Table 3 and each item is depicted in the following discussions.
TDC module related errors: Calibration accuracy () and stability of the calibration oscillator () are known as they are product specifications, while integral () and differential (negligible) non linearities are evaluated using basic performance of the 2-GHz TDC. Cut condition errors: Systematic errors for base-line selections and pile-up rejections were assessed by changing the cut criteria. The base-line cut was intentionally changed from to where the represents standard deviation of the base-line distribution. The decay rate results are compared with the nominal result with , and systematic error is estimated as for RUN1 and for RUN2. Regarding the pile-up events rejection, the WD-NW cut condition was changed from to to estimate deviation from the nominal condition which is keV, and is estimated as for RUN1 and for RUN2. The dependence on the energy cut condition and trigger PMT threshold are considered to have a negligible effect.
Monte Carlo simulation related errors: The predominant contribution to total systematic error is produced by uncertain normalization. That is, the number of pick-off events are determined by subtracting the normalized 3- spectrum of Monte Carlo simulation from the o-Ps spectrum, where changing the normalization factor affects the values and eventually propagates to the final result. Since the sharp fall-off of the 3-spectrum at 511 keV is solely produced by the good Ge energy resolution of keV, this subtraction only affects the lower side of the pick-off spectrum such that improper subtraction results in asymmetry of the pick-off spectrum shape. Comparison of the asymmetries of the pick-off peak shape and the prompt peak annihilation spectrum is a good parameter for estimating this systematic error. The 1 error is assessed as for RUN1 and for RUN2.
Other MC simulation related errors: The relative efficiency of the NaI(Tl) scintillators, , has an uncertainty of evaluated using a comparison of the energy spectrum of data and that of the simulation which reproduces data within an uncertainty of 2% except for the Compton free region where the deviation is 5% (). powder density in the MC simulation is conservatively changed by although the uniformity is known to be within a few %; a change resulting in an error of ppm.
Stark shift errors: The Stark shift stretches the lifetime of Ps atoms, i.e., a perturbative calculation shows that the shift is proportional to a square of the effective electric field such that [25], where . is defined as the root-mean-square electric field sensed by o-Ps during its lifetime. Calculations have estimated two contributions exist based on measurements of the electrical charge-up on the primary grains of silica powders and electrical dipole moment on the surface of grains [18]. The charge-up is partly intrinsic depending on powder specifications and partly due to positron depositions from the source. The effect, however, is negligible in both cases, i.e., on the level of at most. Silanol functional groups on the surface of the powder grain behave as an electrical dipole moment creating an effective field around the grains. Average densities are known to be as and for RUN 1 and 2, respectively. Accordingly, the effective field can be analytically calculated such that the contribution to the o-Ps decay rate is determined to be for RUN1 and for RUN2. These estimations were confirmed using results from precise hyper-fine-structure (HFS) interval measurements of ground state Ps in silica powder [26], where the interval is proportional to the size of Stark effect. Considering the difference in powder densities used, the HFS results are consistent with our estimation.
Other sources of systematic errors: Error contribution due to the Zeeman effect is estimated using the measured absolute magnetic field around the positronium assembly (). Since the 3- pick-off process can only occur at a certain ratio, the calculated relative frequency is consistent with previous measurements [27], being for RUN1 and for RUN2. The probability of the excited state (n=2) of Ps is about [28], which could make the intrinsic decay rate smaller due to the low decay rate ()
The above discussed systematic errors are regarded as independent contributions such that the total systematic error can be calculated as their quadratic sum, resulting in , for RUN1 and , for RUN2.
5 Conclusions

The decay rate of o-Ps formed in was measured using a direct correction method in which the thermalization effect of o-Ps is accounted for and integrated into the time spectrum fitting procedure. Results were obtained using two runs with different types of powders, i.e., and . Based on the results of both runs, a weighted average gave , being 1.8 times more accurate than previous measurement [17]. While this value agrees well with previous result, it disagrees with recent high-precision measurements, i.e., by [1] and [2]. As illustrated in Fig. 7, our value agrees well with the NRQED prediction corrected up to term [3]. In fact, the resultant decay rates were confirmed to be independent of fitting start time after for RUN1(2), and systematic increase in decay rate observed in previous measurement before [17] was eliminated using the new system; this improvement directly contributed to reduce the statistical error.
Sincere gratitude is extended to Professor Toshio Hyodo, Dr. Yasuyuki Nagashima, and Dr. Haruo Saito for their valuable suggestions and information regarding o-Ps properties and thermalization processes. Special appreciation goes to Dr. Masami Chiba for beneficial discussions on the o-Ps decay problem and to Drs. Masahiro Ikeno and Osamu Sasaki for significant measurement improvement using the 2-GHz TDC module.
Appendix
During the submission procedure of this paper, we became aware
of the recent result using nanoporous silica film by Ann Arbor
group [29].
They obtained the value,
,
which shows complete agreement with our result.
References
- [1] C.I. Westbrook, D.W. Gidley, R.S. Conti, and A. Rich, Phys. Rev. A40 (1989) 5489.
- [2] J.S. Nico, D.W. Gidley, A. Rich, and P.W. Zitzewitz, Phys. Rev. Lett. 65 (1990) 1344.
- [3] G.S. Adkins, R.N. Fell, and J. Sapirstein, Ann. Phys. (N.Y.) 295 (2002) 136.
- [4] S. Orito, K. Yoshimura, T. Haga, M. Minowa, and M. Tsuchiaki, Phys. Rev. Lett. 63 (1989) 597.
- [5] S. Asai, S. Orito, K. Yoshimura, and T. Haga, Phys. Rev. Lett. 66 (1991) 2440.
- [6] S. Asai, K. Shigekuni, T. Sanuki, and S. Orito, Phys. Lett. B 323 (1994) 90.
- [7] M. Tsuchiaki, S. Orito, T. Yoshida, and M. Minowa, Phys. Lett. B 236 (1990) 81.
- [8] T. Maeno, M. Fujikawa, J. Kataoka, Y. Nishihara, S. Orito, K. Shigekuni, Y. Watanabe, Phys. Lett. B 351 (1995) 574.
- [9] T. Mitsui, K. Maki, S. Asai, Y. Ishisaki, R. Fujimoto, N. Muramoto, T. Sato, Y. Ueda, Y. Yamazaki and S. Orito, Europhys. Lett. 33 (1996) 111. ; A. Badertscher, P. Crivelli, M. Felcini, S.N. Gninenko, N.A. Goloubev, P. Nedelec, J.P. Peigneux, V.Postoev, A. Rubbia and D. Sillou Phys. Lett. B 542 (2002) 29.
- [10] T. Mitsui, R. Fujimoto, Y. Ishisaki, Y. Ueda, Y. Yamazaki, S. Asai, and S. Orito, Phys. Rev. Lett. 70 (1993) 2265.
- [11] S. Asai, S. Orito, T. Sanuki, M. Yasuda, and T. Yokoi, Phys. Rev. Lett. 66 (1991) 1298.
- [12] D. W. Gidley, J. S. Nico, and M. Skalsey, Phys. Rev. Lett. 66 (1991) 1302.
- [13] K. Marko and A. Rich, Phys. Rev. Lett. 33 (1974) 980.
- [14] S. Asai , T. Hyodo, Y. Nagashima, T.B. Chang and S. Orito, Materials Science Forum, 619 (1995) 175-178 .
- [15] M. Skalsey, J. J. Engbrecht, R. K. Bithell, R. S. Vallery, and D. W. Gidley, Phys. Rev. Lett. 80 (1998) 3727.
- [16] R. S. Vallery, A. E. Leanhardt, M. Skalsey and D. W. Gidley, J. Phys. B: At. Mol. Phys. 33 (2000) 1047.
- [17] S. Asai, S. Orito, and N. Shinohara, Phys. Lett. B357 (1995) 475.
- [18] O. Jinnouchi, Study of bound state QED: precision measurement of the orthopositronium decay rate, Ph. D. thesis, university of Tokyo (2001).
- [19] G.S. Adkins, private communication.
- [20] M. A. Hammed, P. W. Gray, A. H. Naboulsi and T. D. Mac Mahon, Nucl. Inst. Methods A 334 (1993) 543.
- [21] H. H. Jorch and J. L. Campbell, Nucl. Inst. Methods A 143 (1977) 551.
- [22] Y. Nagashima, T. Hyodo, K. Fujiwara, and A. Ichimura, J. Phys. B 31 (1998) 329.
- [23] Y. Nagashima, M. Kakimoto, T. Hyodo, K. Fujiwara, A. Ichimura, T. Chang, J. Deng, T. Akahane, T. Chiba, K. Suzuki, B. T. A. McKee, and A. T. Stewart, Phys. Rev. A 52 (1995) 258.
- [24] IT/ASD CERN, MINUIT Function Minimization and Error Analysis, version 94.1, d506 CERN Program Library (1998).
- [25] G.L. Sewell, Proc. Cambridge Philos. Soc. 45, (1949) 678.
- [26] M.H. Yam, P.O. Egan, W.E. Frieze, and V.M. Hughes, Phys. Rev. A 18 (1978) 350.
- [27] J. A. Rich, Phys. Rev 61 (1951) 140.
- [28] S. Hatamian, R.S. Conti, and A. Rich, Phys. Rev. Lett. 58 (1987) 1833.
- [29] R.S. Vallery, P.W. Zitzewitz, and D.W. Gidley, Phys. Rev. Lett. 90 (2003) 203402