Workshop on the CKM Unitarity Triangle, IPPP Durham, April
2003
Status and perspectives of measurements
H Sagawa\addressmarka
KEK, Tsukuba
Abstract
In the neutral meson system, it is possible to measure
the CKM angle using the decay mode
in the presence of pollution from gluonic penguin decays.
Here the recent status of the measurements of CP-violating
asymmetry parameters using time-dependent analyses in
and decays and
the perspectives of a measurement are presented.
1 Introduction
In 1973, Kobayashi and Maskawa (KM) proposed a model where CP violation is
accommodated as an irreducible complex phase in the weak-interaction quark
mixing matrix [1].
Recent measurements of the CP-violating asymmetry parameters
[2]
by the Belle [3] and BaBar [4]
Collaborations established CP violation in the
neutral meson system.
Measurements of other CP-violating asymmetry parameters provide important tests
of the KM model.
Any mode with a contribution from is a possible source of
measurement of the Cabibbo-Kobayashi-Maskawa (CKM) angle .
Here the recent status of the measurements of CP-violating asymmetry
parameters using time-dependent analyses in
and decays [5] and
the perspectives of a measurement are presented.
2 decays
The decay is one of the important modes for the measurement of
.
The KM model predicts CP-violating asymmetries in the time-dependent rates
for and decays to a common CP eigenstate, .
In the decay chain , in which
one of the mesons decays at time to and the other decays at
time to a final state that distinguishes between
and ,
the decay rate has a time-dependence given by
(1)
where is the lifetime, is the mass difference between the two
mass eigenstates, , and the -flavor charge
when the tagging meson is a ).
The CP-violating asymmetry parameters and [6]
defined
in Eq. (2) are expressed as
(2)
where is a complex parameter that depends on both - mixing and
on the amplitudes for and decay to .
A measurement of time-dependent CP-violating asymmetries
in the mode is sensitive to direct CP violation and the
CKM angle .
If the decay proceeded only via a tree amplitude, and , or equivalently
.
The situation is complicated by the possibility of significant contributions
from gluonic penguin amplitudes that have a different weak phase
and additional strong phases.
In general, is given by
Here (=) depends on the magnitudes and
relative weak and strong phases of the tree and penguin amplitudes.
As a result, may not be equal to and direct CP
violation, , may occur.
Candidate mesons are reconstructed kinematically using two variables,
the energy difference
and the beam-energy constrained mass [7], where
is the cms beam energy, and and are the cms
energy and momentum of the candidate.
Charged tracks in candidates are identified
as charged pions or kaons.
Here and represent a or . The
Belle Collaboration uses the likelihood ratio (KID)
for a particle to be a meson,
which is based on the combined information from the Aerogel Cherenkov counter
and CDC measurement.
Tracks are positively identified as pions with KID0.4 for candidates.
The BaBar Collaboration uses the Cherenkov angle measurement
from a detector of internally reflected Cherenkov light.
The probability density function (PDF) from the difference between measured and
expected values of is used in the extended likelihood function
for the fit to extract yields and CP parameters.
Background from the process continuum are suppressed by their
event topology.
The Belle Collaboration forms signal and background likelihood functions
and from a Fisher discriminant determined from six modified
Fox-Wolfram moments [8] and
the cms flight direction with respect to the beam axis.
The continuum background is reduced by imposing requirements on the likelihood ratio
= for different flavor-tagging dilution factor
intervals.
The BaBar Collaboration uses the angle between the sphericity axis of the
candidate and the sphericity axis of the remaining particles in the cms frame, and
cut on .
The shapes of Fisher discriminant [9] for
signal and background events are included as PDFs in the maximum likelihood fit.
Leptons, kaons, and charged pions that are not associated with the reconstructed
candidate are used to identify the flavor of the accompanying meson.
The vertex reconstruction algorithm is the same as that used for the
( ) analysis.
The time difference is obtained from the measured distance
between the positions along the beam direction of the
and decay vertices and the boost factor of the
system.
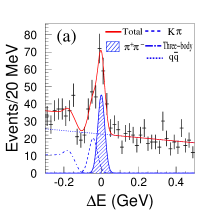
Fig. 1 and Fig. 2
show distributions of for events enhanced
in signal and decays
from the Belle Collaboration [10] and
the BaBar Collaboration [11], respectively.
The Belle and BaBar Collaborations obtained the following
results using an unbinned maximum likelihood fit based on 85 and
88 pairs, respectively,:
The first and the second errors correspond to statistical and systematic errors,
respectively, unless otherwise stated.
The average values of and are
and the difference of the results between the Belle and BaBar Collaborations
is 2.2 [12].
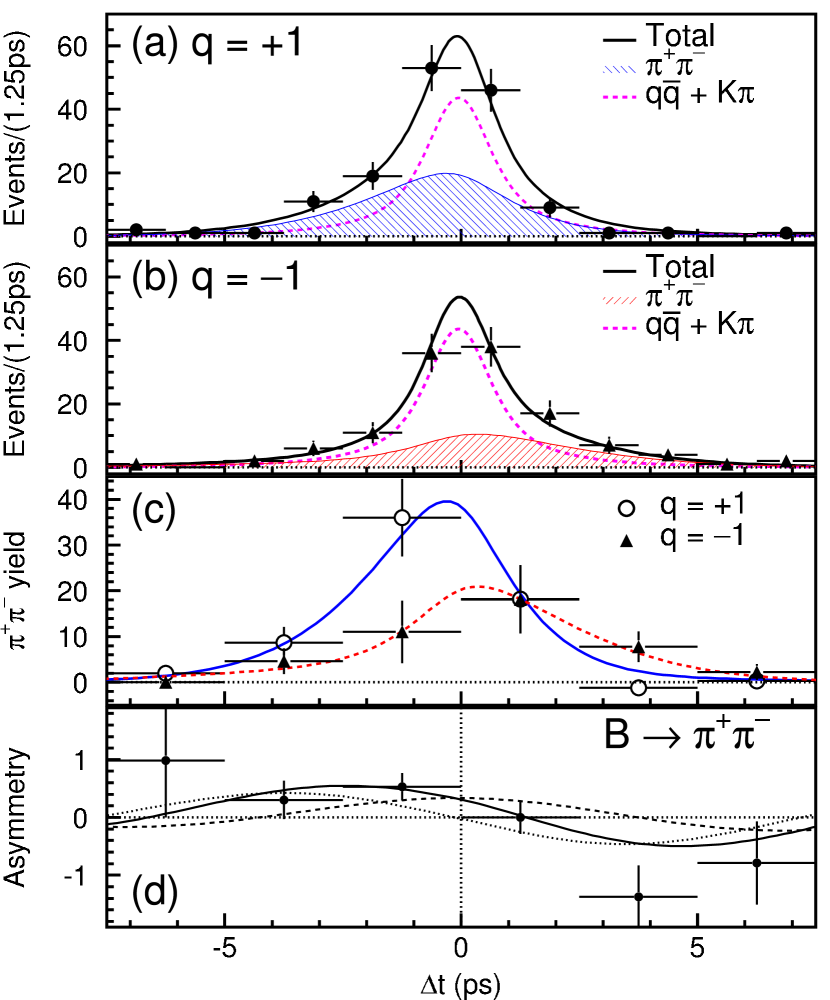
In Fig. 3 and Fig. 4 the distributions for events
enhanced in signal decays are shown for
the Belle Collaboration [10] and the
BaBar Collaborations [11], respectively.
Figure 1: distributions in the signal region
for (a) candidates and (b)
candidates with
from the Belle Collaboration.
The sum of the signal and background functions is shown as a solid curve.
The solid curve with hatched area represents the component,
the dashed curve represents the component, the dotted curve represents
the continuum background, and the dot-dashed curve represents the charmless
three-body decay background component.
Figure 2: distributions for events enhanced in signal
(a) and (b) candidates
from the BaBar Collaboration.
Solid curves represent projections of the maximum likelihood fit,
dashed curves represent and cross-feed background.
Figure 3: The raw, unweighted distributions for candidates
with in the signal region from the Belle Collaboration:
(a) candidates with , i.e. the tag side is identified as ;
(b) candidates with ;
(c) yields after background subtraction;
(d) the CP asymmetry for after background subtraction.
In Figs. (a) through (c), the solid curves show the results of the unbinned maximum likelihood fit to the
distributions of the whole candidates. In Fig. (d),
the dashed (dotted) curve is the contribution from the cosine (sine) term.
Figure 4: Distributions of for events enhanced in signal
decays from the BaBar Collaboration:
the tag side is identified as (a) or (b) ,
and (c) the asymmetry as a function of . Solid curves represent
projections of the maximum likelihood fit, dashed curves represent
the sum of and background events.
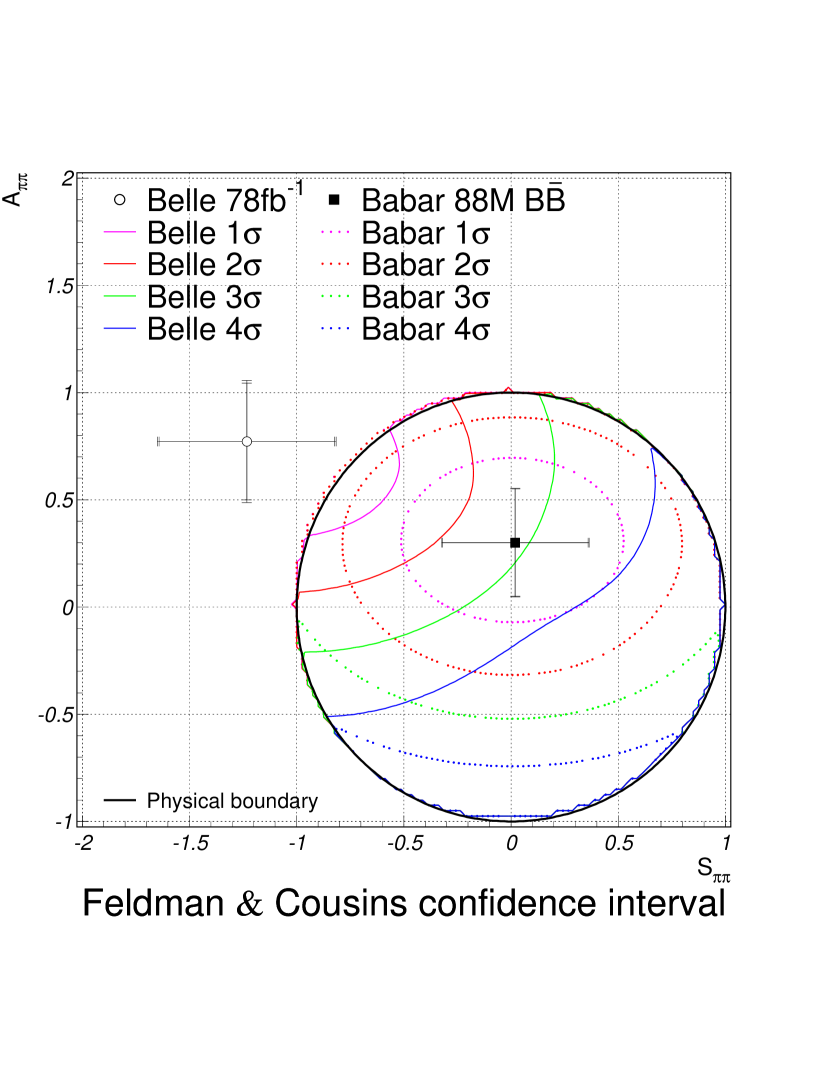
Fig. 5 shows the two-dimensional confidence regions in
the vs. plane
using the Feldman-Cousins frequentist
approach [13].
In order to form confidence intervals, the and
distributions of the results of fits to MC pseudo-experiments for various input
values of and are used for the Belle result, and
the obtained errors of and are used for the BaBar result.
The case that CP symmetry is conserved, , is ruled out at the
99.93 confidence level (C.L.), equivalent to 3.4 significance for
Gaussian errors from the Belle result.
More data is necessary to clarify the difference between the Belle result and
the BaBar result.
The decay amplitudes for and to
can be written by using the -convention notation [14]:
(3)
where and are the amplitudes for the tree and penguin
graphs and and are their strong phases.
The expressions for and are
(4)
where the strong phase difference .
When is positive and , is
negative.
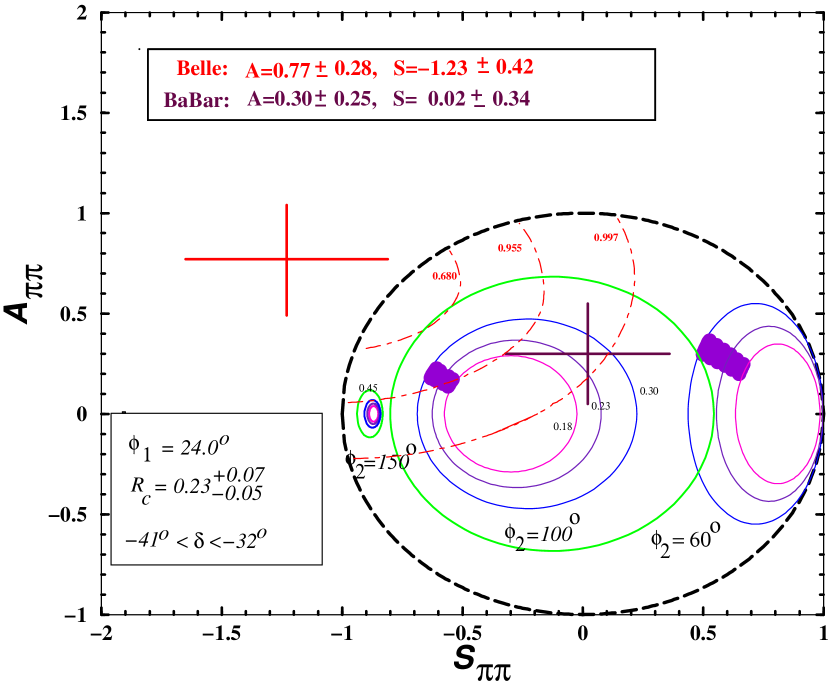
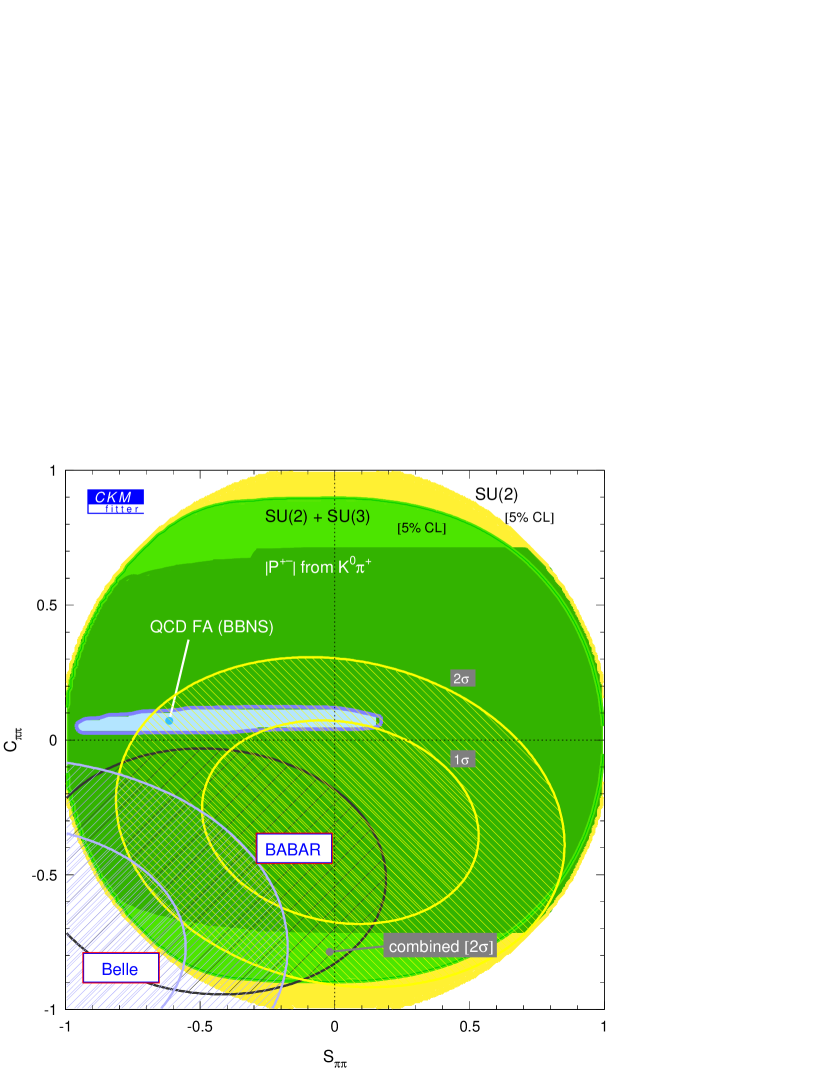
Fig. 6 shows the two-dimensional confidence regions in the
vs. plane together with the pQCD prediction [15]
for various values of .
Fig. 7 shows predictions for and
for several analysis steps with experimental and theoretical
constraints [16].
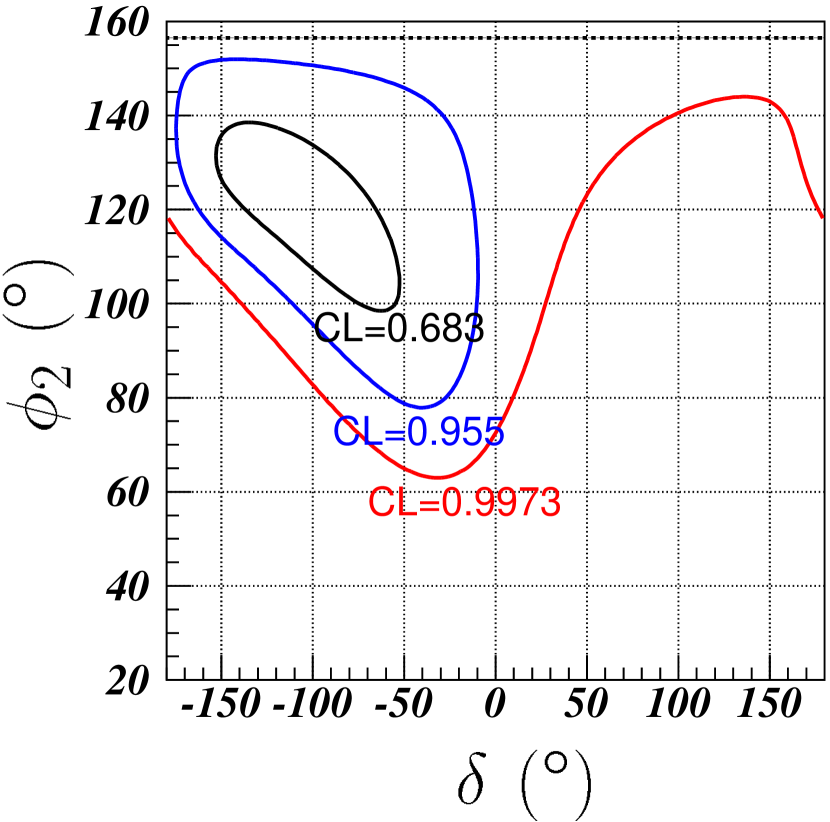
In Fig. 8, the interpretation
of the confidence regions of vs. is shown
in terms of and
for the Belle data [10].
The range of that corresponds to the 95.5 C.L. region of
and is for
[17] and
[18].
The result is in agreement with constraints on the unitarity triangle from other
measurements [19].
Other interpretations for the current results
can be found in ref. [16].
Figure 5: Confidence regions for and from the Belle
and BaBar results.
Figure 6: Plot of versus for various values of
with =24.0∘, ,
and in the pQCD method.
Here .
Dark areas are allowed regions in the pQCD method for different values.
The results of and from the Belle
and BaBar Collaborations and the confidence regions from the Belle Collabolation are
also shown.
Figure 7: Predictions for and
for several analysis steps with experimental and theoretical constraints.
The Belle and BaBar results are shown.
Figure 8: The region for and which corresponds to
the 68.3, 95.5, and 99.73 C.L. regions of
and from the Belle result in Fig. 6.
and .
The horizontal dashed line corresponds to .
Using isospin relations [20], we can constrain the difference, between
and . From the central values of the
recent world average values of the
branching ratios of , and the
90 C.L. upper limit on the branching ratio [21]
together with ,
the upper limit on is 54∘.
3 decays
In principle, the CKM angle can be measured in the presence of penguin
contributions using a full Dalitz plot analysis of the final state.
However, there are difficulties of combinatorics and lower efficiency in three-body
topology with and large backgrounds from misreconstructed signal events and
other decays. In order to extract cleanly, data with large statistics are
required.
Unlike decay, decay is not a CP
eigenstate, and four flavor-charge configurations
() must be considered.
Following a quasi-two-body approach [22],
the analysis is restricted to the two regions of the
Dalitz plot ( = or ) that are dominated by .
The decay rate is given by
(5)
where = as the time interval
between the decay of and that of the other meson in the event,
.
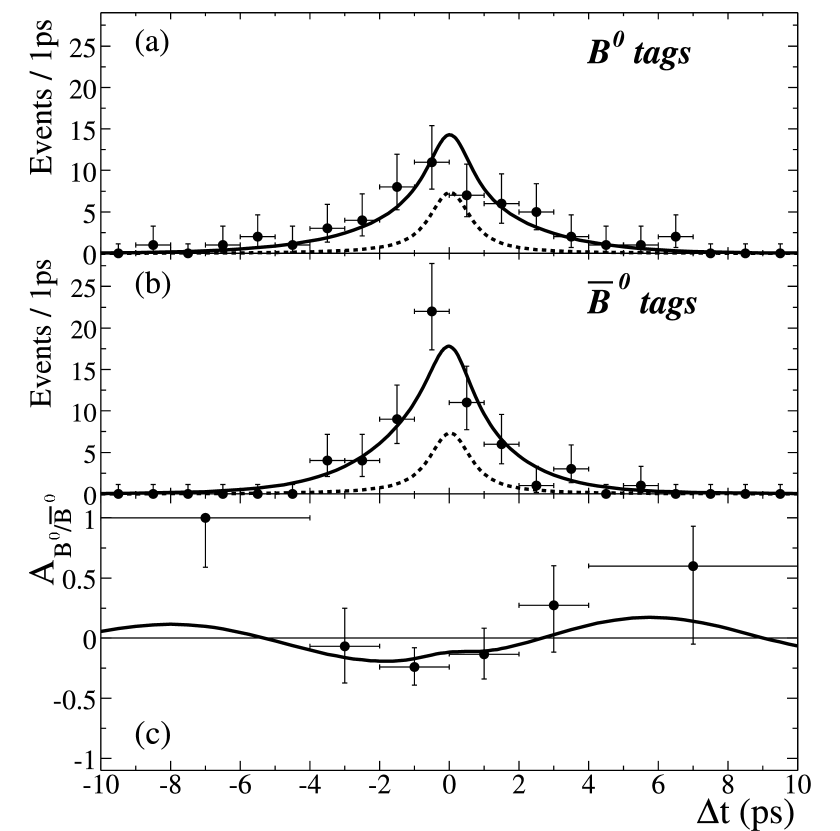
Figure 9:
Time distributions for events selected to enhance the signal tagged as
(a) -tag and (b) -tag, and (c) time-dependent asymmetry
between -tag and -tag from the BaBar Collaboration [23].
The solid curve is a likelihood projection of the fit result.
The dashed line is the sum of - and continuum-background contributions.
The time- and flavor-integrated charge asymmetries and measure
direct CP violation.
For the mode, the quantities and parameterize
mixing-induced CP violation related to the CKM angle , and
flavor-dependent direct CP violation, respectively.
describes the asymmetry between the rates
and
.
is related to the strong phase difference between the
amplitudes contributing to decays.
One finds the relations =
,
where 2 =
arg[],
= arg[],
arg[q/p] is the - mixing phase, and
and
are the transition amplitudes of the
processes and
, respectively.
The angles are equal to
if contributions from penguin amplitudes are absent.
For the self-tagging mode, the values of the four time-dependent
parameters are , , , and .
The results on direct CP violation can be expressed using the asymmetries
(6)
(7)
With a data sample of 89 million pairs [23],
the BaBar Collaboration found
428(stat)
and 120(stat) events
and
the following measurements of the CP violation parameters are obtained:
For the other parameters in the description of the
decay-time dependence,
are found.
For the asymmetries and , which probe direct CP violation,
are measured.
The raw time-dependent asymmetry in the tagging categories dominated by
kaons and leptons is shown in Fig. 9.
4 Prospects
Table 1 shows the expected error on CP-violating
parameters in and decays with accumulated
luminosities of 140 fb-1,
400 fb-1, 3000 fb-1 (3 ab-1), and 30000 fb-1 (30 ab-1)
in the future.
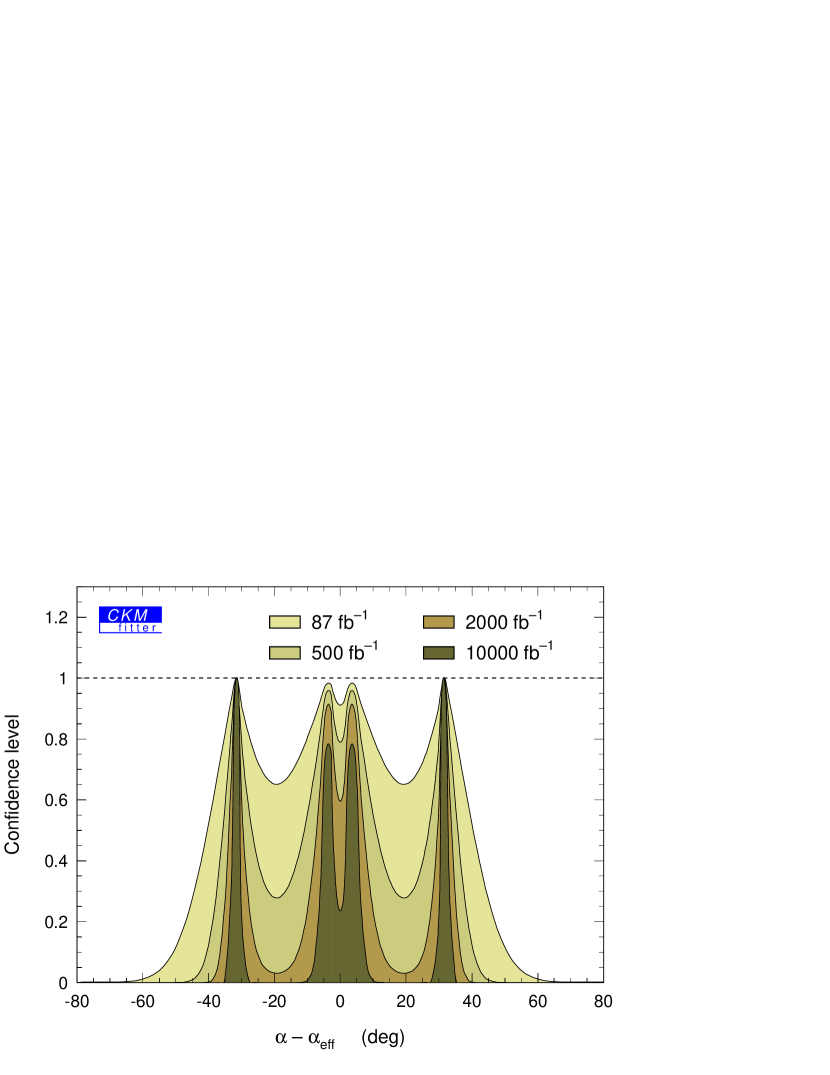
Fig. 10 shows the prospects of
for the ICHEP′02 central values of the branching ratios and
the central values of and from the BaBar measurement at
luminosities of the current and future B-factories
( 87 fb-1, 500 fb-1, 2 ab-1, 10 ab-1 ).
The inner and outer boarders can be obtained from the isospin analysis
when flavors are tagged and not tagged, respectively.
Only a luminosity of around 10 ab-1
allows to separate the solutions.
For decays, the isospin analysis
is not feasible yet with the present statistics of the factories.
In [24], the projections into
the future full SU(2) analysis was demonstrated.
If the branching fraction of is below the experimental
sensitivity, a strong constraint on is expected above luminosity of
around 2 ab-1.
In this workshop, theoretical problems such as form factors and
meson [25],
and experimental problems for several sources of backgrounds were pointed out.
Detailed discussions can be found in [27] for
and in [24] for
at this workshop.
parameters
140 fb-1
400 fb-1
3 ab-1
30 ab-1
0.21
0.13
0.05
0.02
0.31
0.19
0.07
0.03
0.07
0.04
0.02
0.008
0.14
0.09
0.03
0.013
0.18
0.11
0.04
0.014
Table 1: The
errors of CP-violating parameters in
and decays at 140 fb-1, 400 fb-1,
3 ab-1, and 30 ab-1, assuming
that statistical and systematic errors are proportional to
1/ and 1/, respectively.
Here L is accumulated luminosity.
Figure 10:
for the ICHEP′02 central values of the branching fractions
and the central values of and from the BaBar measurement at
luminosities of the current and future B-factories
( 87 fb-1, 500 fb-1, 2 ab-1, and
10 ab-1 ).
5 Summary
In summary,
the Belle and BaBar Collaborations obtain the following measurements of the
CP-violating asymmetry parameters in decays:
The following measurements of the CP-violating asymmetry parameters in
decays using a quasi two-body analysis
are obtained by the BaBar Collaboration:
For the asymmetries and , which probe direct violation,
are obtained.
References
[1]
M. Kobayashi and T. Maskawa, Prog. Theor. Phys. 49, 652 (1973).
[2]
() arg,
()
arg, and
() arg.
[3]
Belle Collaboration, K. Abe , Phys. Rev. D 66, 071102 (2002).
[4]
BaBar Collaboration, B Aubert , Phys. Rev. Lett. 89, 201802
(2002).
[5]
Throughout this paper, the inclusion of the charge conjugate mode decay is implied
unless otherwise stated.
[6]
.
The BaBar Collaboration uses and the Belle Collaboration uses .
Usually the partial-rate asymmetry or direct CP violation parameter
is defined by . Its sign is consistent with the sign of .
Here B represents either a or meson,
represents a flavor-specific final state, and
and are their conjugates.
[7]
The Belle Collaboration uses the beam-energy constrained mass .
The BaBar Collaboration uses
the beam-energy substituted mass
,
where is the total cms energy , and the momentum and
the four-momentum of the initial state are defined in the laboratory frame.
[8]
The Fox-Wolfram moments were introduced in G.C. Fox and S. Wolfram,
Phys. Rev. Lett. 41, 1581 (1978).
The Fisher discriminant used by the Belle Collaboration is described in
Phys. Lett. B 511, 151 (2001) and Phys. Rev. D 66, 092002 (2002).
[9]
, where is the momentum of
particle and is the angle between its momentum and the thrust
axis in the cms frame.
The sum is over all particles in the event excluding
those of the candidate.
[10]
Belle Collaboration, K. Abe et al., hep-ex/0301032, to appear in Phys. Rev. D.
[11]
BaBar Collaboration, B. Aubert et al., Phys. Rev. Lett. 89, 281802 (2002).
[12]
Heavy Flavor Averaging Group, http://www.slac.stanford.edu/xorg/hfag.
[13]
G.J. Feldman and R.D. Cousins, Phys. Rev. D 57, 3873 (1998).
[14]
M. Gronau and J.L. Rosner, Phys. Rev. D 65, 093012 (2002).
[15]
Y.-Y. Keum and A.I. Sanda, Phys. Rev. D 67, 054009 (2003); private communication
with Y.-Y. Keum.
[16]
The CKMfitter site on the web: http://ckmfitter.in2p3.fr/.
[17]
Using the recent average values of from
the Belle [3] and BaBar [4] Collaborations,
.
[18]
The recent theoretical estimates prefer .
[19]
Y. Nir, Nucl. Phys. B (Proc. Suppl.) 117, 111 (2003).
[20]
M. Gronau, D. London, N. Sinha, R. Sinha, Phys. Lett. B 514, 315 (2001).
[21]
Heavy Flavor Averaging Group Rare Decays,
Pre Winter 2003 in http://www.slac.stanford.edu/xorg/hfag/rare/index.html.
[22]
The BaBar Physics Book, Editors P.F. Harrison and H.R. Quinn, SLAC-R-504 (1998).
[23]
BaBar Collaboration, B. Aubert et al., hep-ex/0306030, submitted to Phys. Rev. Lett.
[24]
J. Stark, these proceedings.
[25]
A.D. Polosa, these proceedings.
The meson was introduced as a very broad light resonance.
The E791 Collaboration had an evidence of a very broad scalar resonance
with
and
[26].
can spoil the penguin relation on
the isospin analysis in .
[26]
E791 Collaboration, E.M. Aitala et al., Phys. Rev. Lett. 86, 770 (2001).