Workshop on the CKM Unitarity Triangle, IPPP Durham, April 2003
Advances in measurements
Abstract
We report the current status of measurements at -factories. The most recent world average is ps-1 (1.4% accuracy). An estimate of the errors for 500 fb-1 data is also given.
1 Introduction
In the Standard Model, - oscillations occur through second-order weak interactions, mainly through internal loops containing virtual quarks. The mixing parameter , the mass difference between the two mass eigenstates, is thus related to the and CKM matrix elements. The measurement of can therefore in principle provide a means to extract . In addition, plays a role in the parameterization of the asymmetries in the system: a precise measurement of is also needed for violation measurements (see [1, 2]).
In this article, we present different measurements of from the time distributions of opposite-flavor (OF – ) and same-flavor (SF – , ) neutral decays at the resonance. The theoretical time-dependent probabilities for observing OF and SF states are given by:
where is the lifetime and is the proper time difference between the two meson decays. This assumes CP and CPT conservation in the mixing, as well as negligible (decay width difference between the two meson mass eigenstates).
The analyses presented here were performed on data collected with the BaBar and the Belle detectors [3]. A 9 GeV (resp. 8 GeV) electron beam and a 3.1 GeV (resp. 3.5 GeV) positron beam are collided in the PEPII (resp. KEKB) storage ring, resulting in a Lorentz boost of the center-of-mass of (resp. ) with respect to the laboratory frame. Since mesons are nearly at rest in the frame, the proper time difference is approximated by , being the (signed) distance between the decay vertices of the two mesons along the beam axis. The flavor of the mesons is determined using flavor-specific decays.
2 Dilepton measurement
In this analysis [4, 5], semi-leptonic decays from both mesons are used to tag the flavor with the sign of the lepton. Two fast leptons are searched for. The decay vertex position of the meson is determined from the interception of the lepton track with the profile of the interaction point. Because of the large semi-leptonic branching fraction, this analysis offers the largest statistics. However, the purity of the signal is affected by the background coming from charged mesons.
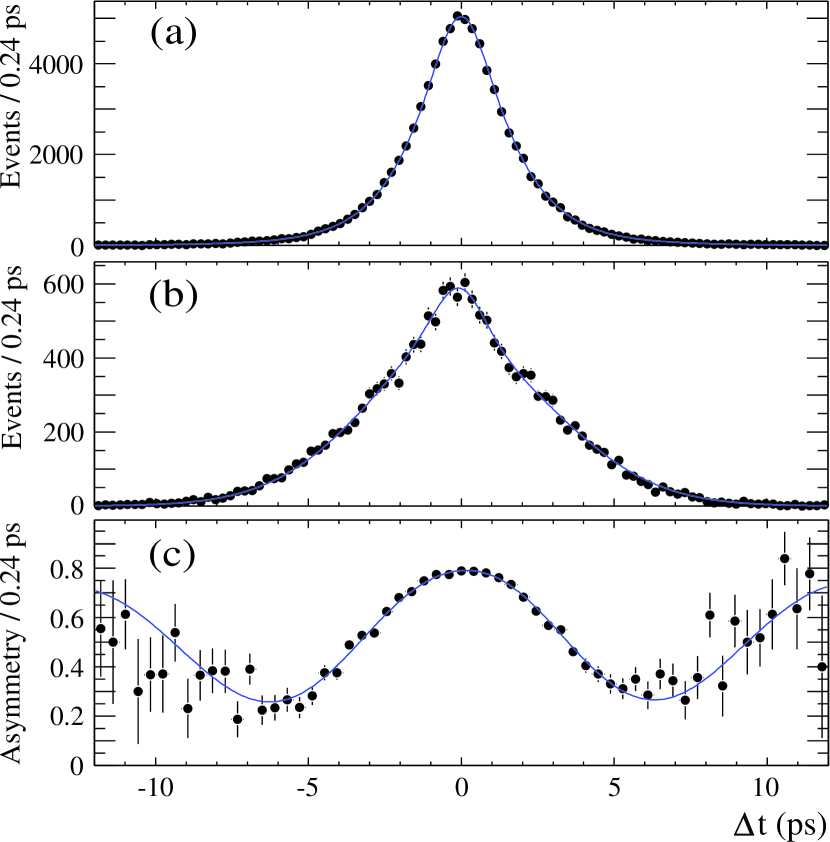
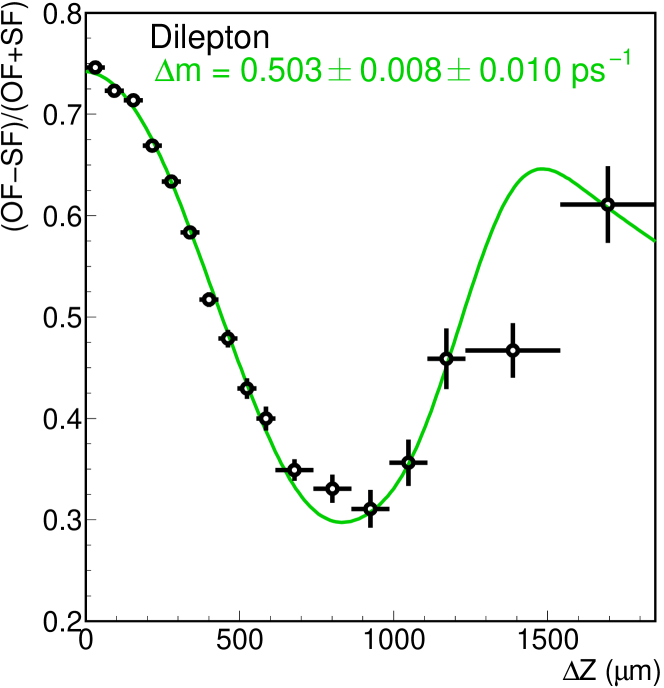
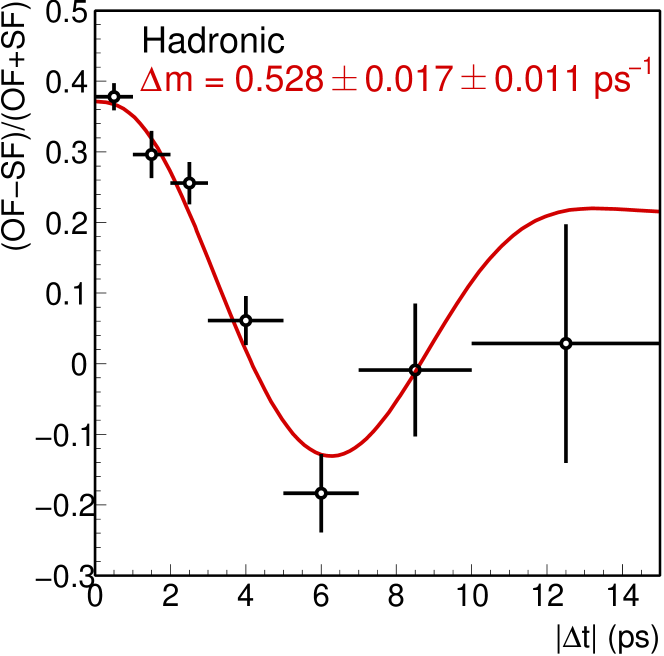
This selection has been applied on 20 fb-1 on-resonance data from BaBar (about 22 million meson pairs), yielding ps-1 (see Fig. 1, also showing the mixing asymmetry ). Belle obtains ps-1 from 29.4 fb-1 on-resonance data (see Fig. 2). At present, the latter is the most precise single measurement of (with an accuracy of about 2.5%).
3 partial reconstruction
Belle uses another partial reconstruction method [6] to extract from decays. The information is extrapolated from the soft pion of , and then combined with the fast pion and the beam information to reconstruct the meson. The flavor is given by the charge of the fast pion. The other side is tagged by simply looking for a fast lepton. 31 fb-1 on-resonance data was used in this measurement.
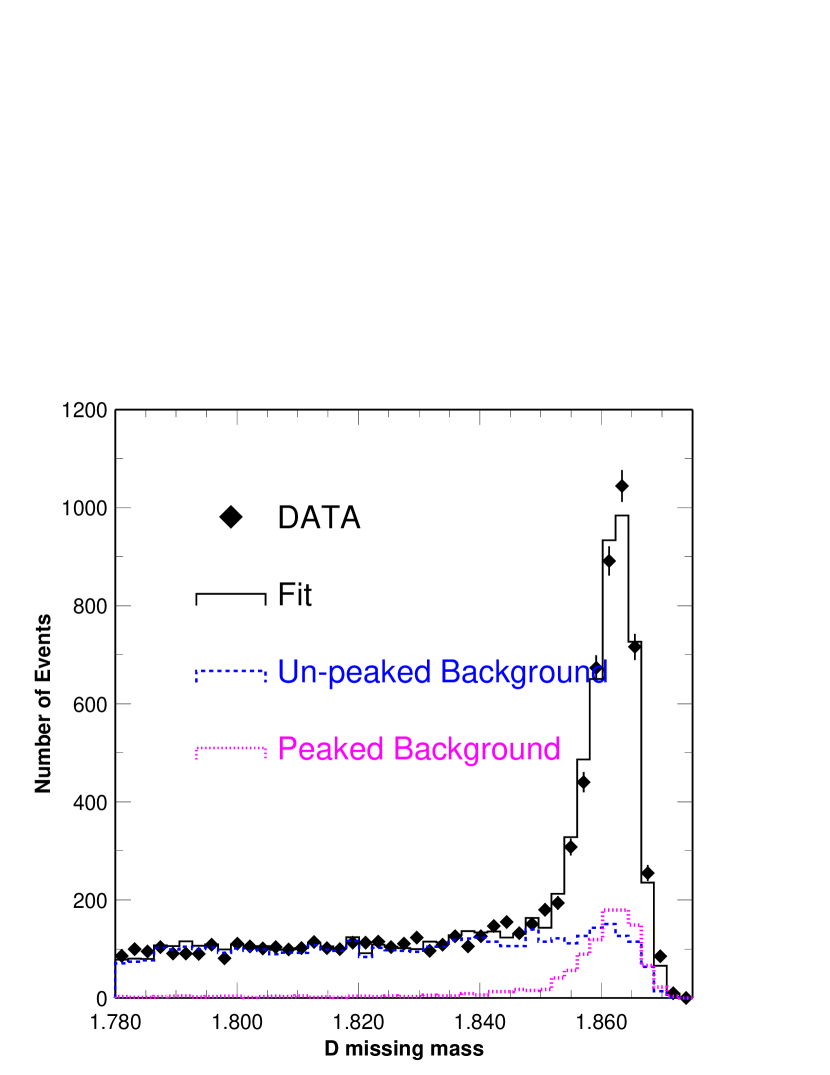
Contributions of various backgrounds can be estimated from the “missing mass” (see Fig. 3). A simultaneous unbinned maximum likelihood fit to OF and SF events yields: ps-1.
4 full reconstruction
This method [7, 8] fully reconstructs , with and , , or (BaBar also reconstructs ). The flavor of the other meson is tagged using the same algorithms as in Ref. [1, 2] (a neural network for BaBar, a multidimensional likelihood for Belle).
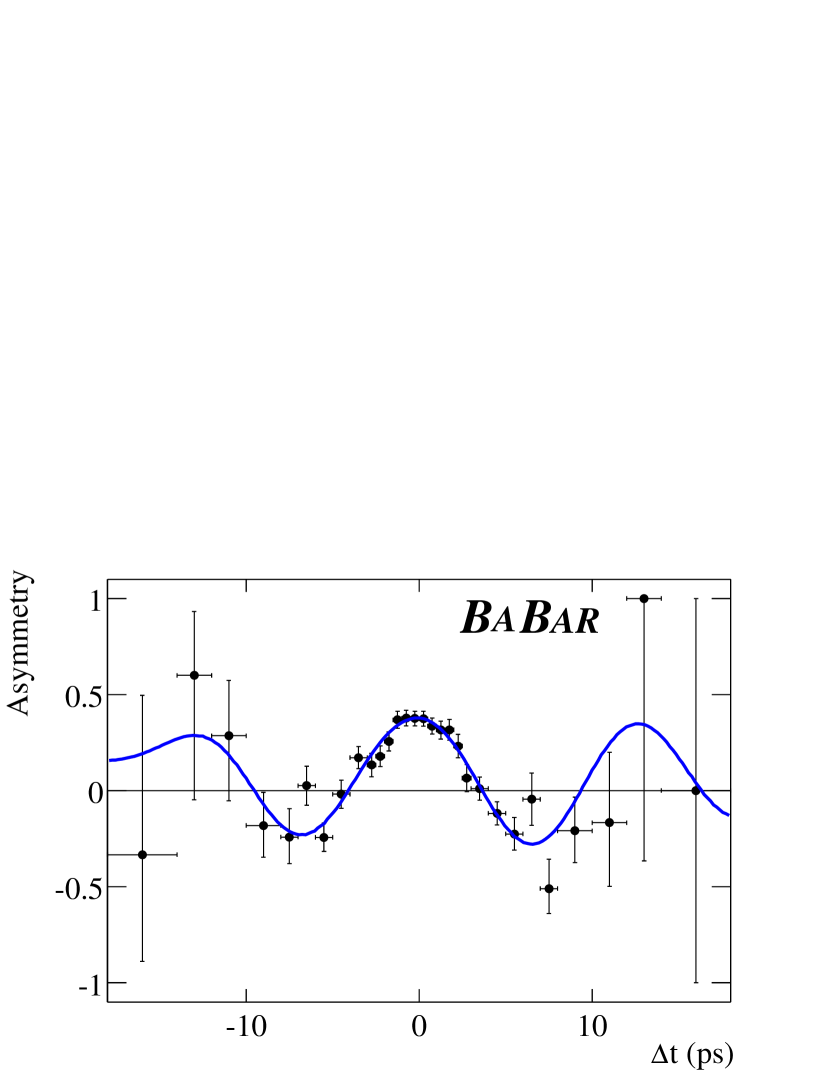
The cosine of the angle between the reconstructed system and the meson momenta in the frame is used to separate the signal from various backgrounds (, fake , random and continuum). An unbinned maximum likelihood fit is then performed on the distributions. The results of the fit by BaBar, shown on Fig. 4, yields ps-1 (from 20 fb-1). Belle obtains ps-1 from 29 fb-1.
5 Hadronic modes
The exclusive reconstruction of mesons decaying into flavor specific hadronic states has also been used to measure [9, 10]. Neutral mesons are reconstructed in the decay modes and (and also by BaBar), with decaying into and decaying into , or (or also in BaBar’s case). The and are formed of and , respectively. Finally, BaBar also includes decaying into . The other side is tagged using a flavour tagging algorithm, as in the previous analysis (see [1, 2]).
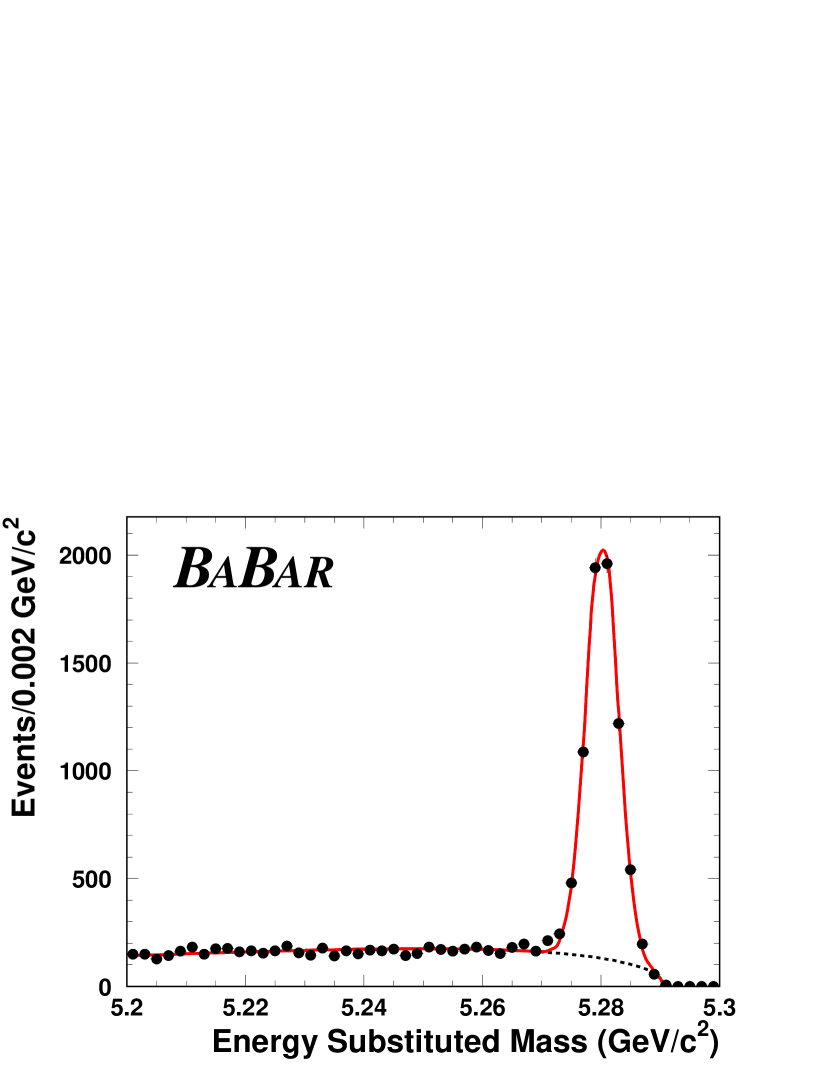
The signal region is defined by constraints on and , where and are the center-of-mass energy and momentum of the fully reconstructed candidate, and is the center-of-mass energy of the beam. The background contributions can be fitted from , the “energy-substituted mass”, as shown on Fig. 5.
6 Summary and prospects
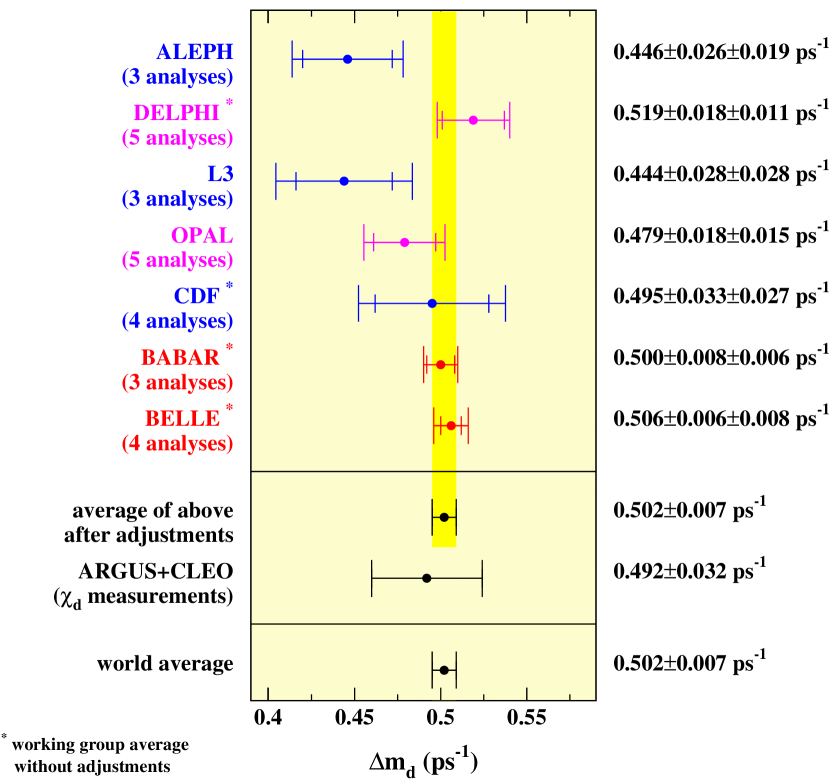
Fig. 7 shows the most up-to-date summary of the results, as selected for the 2003 issue of the PDG review. The world average is: ps-1 [12] (including statistical and systematical errors), with an accuracy of .
Within 3 years, BaBar and Belle will have collected 500 fb-1 each (about 15 times more than what was used here). An extrapolation of the systematic errors for each individual measurement has been made in order to estimate the accuracy on that could be reached. Improvement of the current limiting systematic errors are evaluated from: a better precision on the lifetime, a larger amount of Monte-Carlo statistics, an accurate measurement of some branching fractions (e.g. ). In addition, resolution parameters are expected to be better extracted from data. The average value is then computed in the same way as for the world average, with the central value fixed to the present average. A total error of ps-1 is found, which corresponds to of ps-1.
These extrapolations do not take into account possible improvements of the existing analyses. On the other hand, the evolution of systematic errors is hard to predict. This accuracy should therefore be treated carefully.
7 Conclusion
A number of measurements of have been performed by the BaBar and Belle collaborations. These efforts have lead to a world average of ps-1. The error takes into account statistical and systematical correlations between the measurements. The current accuracy on is currently 1.4%, and is expected to reduce to about half a percent within a few years.
In the future, will be measured with high precision. The error on may then become a limiting factor on the determination of related CKM matrix parameters (see discussion in [13], chapters 4 and 5). In the meanwhile, as the accuracy on is approaching the percent level, efforts are moving to more fundamental tests of underlying assumptions. Limits on violating parameters have been set [5], and measurements of have started [14].
References
- [1] B. Aubert et al. (BaBar collab.), Phys. Rev. Lett. 89 201802 (2002).
- [2] K. Abe et al. (Belle collab.), Phys. Rev. D 66 032007 (2002).
- [3] B. Aubert et al. (BaBar collab.), Nucl. Instr. and Meth. A479 1 (2002), A. Abashian et al. (Belle collab.), Nucl. Instr. and Meth. A479 117 (2002).
- [4] B. Aubert et al. (BaBar collab.), Phys. Rev. Lett. 88 221803 (2002).
- [5] N. Hastings et al. (Belle collab.), Phys. Rev. D67, 052004 (2003).
- [6] Y. Zheng et al. (Belle collab.), Phys. Rev. D67, 092004 (2003).
- [7] B. Aubert et al. (BaBar collab.), Phys. Rev. D67, 072002 (2003).
- [8] K. Hara, M. Hazumi et al. (Belle collab.), Phys. Rev. Lett. 89 251803 (2002).
- [9] B. Aubert et al. (BaBar collab.), Phys. Rev. Lett. 88 221802 (2002).
- [10] T. Tomura et al. (Belle collab.), Phys. Lett. B542 (2002) 207.
- [11] K. Abe et al. (Belle collab.), Phys. Rev. Lett. 88 (2002) 171801.
- [12] K. Hagiwara et al. (Particle Data Group), Phys. Rev. D66, 010001 (2002) and 2003 partial update for edition 2004 (URL: http://pdg.lbl.gov)
- [13] M. Battaglia, A.J. Buras, P. Gambino and A. Stocchi, eds. Proceedings of the First Workshop on the CKM Unitarity Triangle, CERN, Feb 2002, hep-ph/0304132.
- [14] B. Aubert et al. (BaBar collab.), hep ex/0303043.