Measurement of Inclusive Momentum Spectra and Multiplicity Distributions of Charged Particles at 2 - 5 GeV
Abstract
Abstract: Inclusive momentum spectra and multiplicity distributions of charged particles measured with the BESII detector at center of mass energies of 2.2, 2.6, 3.0, 3.2, 4.6 and 4.8 GeV are presented. Values of the second binomial moment, , obtained from the multiplicity distributions are reported. These results are compared with both experimental data from high energy , and experiments and QCD calculations.
1 Introduction
Inclusive hadron production from annihilations is very valuable for testing Quantum Chromodynamics (QCD). Perturbative QCD (pQCD) can give quantitative analytical predictions based on the Modified Leading Logarithmic Approximation (MLLA) [1] under the assumption of Local Parton Hadron Duality (LPHD) [2]. Many experimental results have been reported from high energy experiments [3] [4], which are in good agreement with pQCD predictions. However, hadron production has not been studied well at low energies due to insufficient data, particularly at the boundary region between pQCD and non-pQCD. It is therefore very interesting to test pQCD in this region with low energy data.
Here we study the inclusive momentum spectrum, the hadron multiplicity distribution, and the second binomial moment. The inclusive momentum spectrum is defined in terms of the variable , where and are the momentum of the charged particles and center-of-mass (c.m.) energy respectively. The second binomial moment [5], a measure of the strength of hadron-hadron correlations and a sensitive probe for higher order QCD or non-perturbative effects [6], is defined as , where is the charged particle multiplicity. There has been a long standing discrepancy between the values of calculated to next to leading order (NLO) and those measured in experiments [3].
In this paper, we report measurements of the inclusive momentum spectra and multiplicity distributions of charged particles obtained with the upgraded Beijing Spectrometer (BESII) at the Beijing Electron-Positron Collider (BEPC) with center-of-mass energies of 2.2, 2.6, 3.0, 3.2, 4.6 and 4.8 GeV. Results are compared with pQCD calculations, as well as those from high energy , and experiments.
2 Detector and trigger
The measurements were done using the data collected for the scan [7, 8] with BESII, a conventional solenoidal magnet detector that is described in detail in Ref. [9]. A vertex chamber comprising 12 tracking layers surrounds a beryllium beam pipe and provides input to the trigger system, as well as coordinate information. The primary tracking device is the cylindrical main drift chamber (MDC). It has 40 layers of sense wires and yields precise measurements of charged particle trajectories; it also provides information which is used for charged particle identification. Outside the MDC, there is a barrel time-of-flight system (BTOF) consisting of an array of 48 plastic scintillator counters that are read out at both ends by fine-mesh photomultiplier tubes. Electron and photon showers are detected in a sampling barrel shower counter (BSC) that covers of the total solid angle. It consists of 24 layers of self-quenching streamer tubes interspersed with lead; each layer has 560 tubes. The outermost component of BESII is a muon identification system consisting of three double layers of proportional tubes interspersed in the iron flux return of the magnet.
The triggers and the measurement of the trigger efficiencies for Bhabha, dimuon and hadronic events are the same as those described in Ref. [7]. The efficiencies are measured by comparing the responses to different trigger requirements in special runs taken at the peak of the resonance, and are determined to be 99.96%, 99.33% and 99.76% for Bhabha, dimuon, and hadronic events, respectively. Their uncertainties are about .
3 Hadronic event selection and background subtraction
The hadronic event samples are almost the same as those used for the measurement of values at these energies. Sources of background are cosmic rays, pair produced leptons, two-photon processes, and single-beam associated processes. First, clear Bhabha events are rejected from the sample. Next, hadronic events are selected. Special attention is paid to two-prong events, where cosmic ray and lepton pair backgrounds are especially severe, and additional requirements are imposed to provide extra background rejection [7].
The hadron selection proceeds by first selecting charged tracks and then selecting events. For the track-level selection, we require the track polar angle satisfy , the track must not be identified as an electron or a muon, and the distances of closest approach to the beam in the transverse plane and along the beam axis should be less than 2.0 and 18 cm, respectively. The following criteria are also used to define “good” charged tracks:
-
(i)
, where and are the momenta of the track and the beam energy, respectively, and is the momentum resolution for charged tracks at ;
-
(ii)
, where is the energy in the BSC that is associated with the track;
-
(iii)
(in ns), where and are the time-of-flight for the track and a nominal time-of-flight calculated for the track assuming a proton hypothesis, and is the BTOF time resolution.
-
(iv)
0.08GeV, where is the transverse momentum.
The event-level selection requires at least two charged tracks with at least one “good” track satisfying the above requirements, the total deposited energy in the BSC should be greater than , and the tracks selected should not all point along either the or direction. These criteria help reject background. For two-prong events, cosmic-ray and lepton pair events are removed by requiring that tracks should not be back-to-back and that there should be at least two isolated neutral clusters with MeV and with the differences in azimuthal angle with charged tracks more than . This last requirement rejects radiative Bhabha events. The above selection procedures remove most backgrounds. Backgrounds from two-photon processes are negligible after hadron selection.
Residual background contributions from Bhabha processes and tau pair production are subtracted using a Monte Carlo analysis, e.g. for Bhabha events, the number of Bhabhas in the hadronic events is
| (1) |
where is the number of Bhabha events surviving hadronic event selection, is the total number of generated Bhabha events, is the integrated luminosity at each energy point, and is the total Bhabha cross-section calculated by the Monte Carlo program. A detailed comparison between data and Monte Carlo data shows that the maximum discrepancy in any momentum bin is 10%; hence the error due to the Monte Carlo simulation of Bhabha events and tau decays is less than 1% in any bin, far less than the 5-10% statistical uncertainty.
The beam-associated background is treated by fitting the distribution of event vertices along the beam direction with a Gaussian for real hadronic events and a second order polynomial for the background, as described in Refs. [8][10]. Table 1 summarizes the background contributions to the hadron samples from Bhabhas, tau decays, and beam-associated events. The typical background is a few percent below threshold and about above.
We do not subtract the contributions from the , , or the resonances to the high energy points. Using the resonance parameters from the Particle Data Group [11] and varying them within errors, the contribution to the 4.6 GeV point is expected to be below 2.2 %, while that at the 4.8 GeV point is less than 1 %.
| Beam-assoc. | pair | |||
|---|---|---|---|---|
| (GeV) | (%) | (%) | (%) | |
| 2.2 | 1410 | 3.82 | 0.61 | — |
| 2.6 | 4968 | 3.72 | 0.48 | — |
| 3.0 | 2030 | 3.01 | 0.56 | — |
| 3.2 | 1828 | 4.53 | 0.35 | — |
| 4.6 | 1315 | 6.86 | 0.18 | 6.98 |
| 4.8 | 1282 | 8.72 | 0.14 | 6.34 |
4 Hadronic event generator and initial state radiative correction
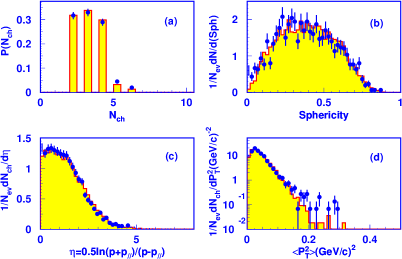
Hadronic events are simulated by the JETSET7.4 [12] and LUARLW [13] Monte Carlo programs. LUARLW is used for energies at 3 GeV or lower. JETSET with tuned parameters is used in the region from 3 to 4 GeV, and JETSET with default parameters is used for 4 GeV and higher energy points [8]. The detector response is based on EGS for electromagnetic interactions, while for hadronic interactions, parameterizations are used. Above 3.77 GeV, the production of and is included in the generator according to the Eichten Model [14]. A Monte Carlo event generator has been developed to handle decays of the resonances in the “radiative return” processes or [15]. Four distributions comparing experimental data and Monte Carlo data at 2.2 GeV are shown in Fig. 1. The data and Monte Carlo distributions agree reasonably well.
Initial state radiation effects are simulated by a Monte Carlo program which is based on the scheme described in Ref. [16]. The error on the effective radiative correction factor is estimated to be less than by comparing different formalisms [17][18] and using different cuts.
5 spectrum
The charged particle inclusive hadron momentum spectrum can be expressed as a function of . A purely analytical approach giving quantitative predictions for is a QCD calculation using MLLA [1] under the assumption of LPHD [2], expressed as
| (2) |
where is an overall normalization factor describing hadronization, is a complex function of and the effective scale parameter , is the color factor, and is the number of active quarks. Eq. 2 is only valid in the range .
The spectrum at each center-of-mass energy is obtained using the following:
| (3) |
where, is the total number of hadronic events observed, is the number of charged tracks in bin-, is the bin width chosen commensurate with the detector resolution to avoid significant migration between bins, and is a multi-source correction factor including effects from the detector, ISR, and hadronic event selection. This correction is determined by two Monte Carlo samples: sample I (hadron level) includes neither initial state radiation (ISR) nor detector simulation and sample II (detector level) includes both ISR and detector simulation . Events of sample II are reconstructed in the same way as for data and subjected to the same selection criteria. Distributions at the hadron level are only from particles with a lifetime greater than s, which are considered as stable [19].
The correction factors for each bin are given by
| (4) |
where is the total number of generated Monte Carlo events for sample I, is the number of events which pass the hadron selection in II, and and are the number of entries in the ith bin, respectively. These correction factors are determined with the LUARLW and JETSET Monte Carlo simulations at 3 GeV, where both Monte Carlo generators are valid. Their differences are included as systematic errors for all center-of-mass energies. Other systematic errors include variations due to selection criteria changes, etc.
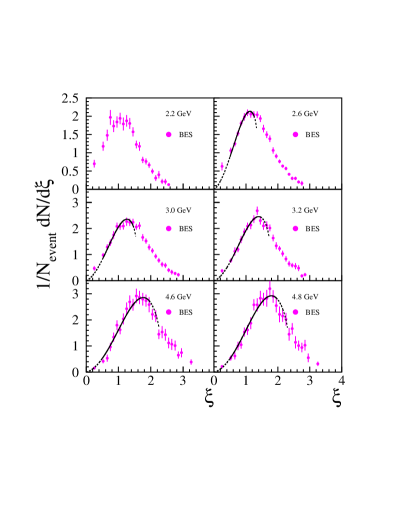
The measured spectra at the six energies between 2.2 and 4.8 GeV are shown in Fig. 2. For each point, we add the statistical and systematic errors in quadrature. These spectra are fitted with Eq. 2 in the range , where GeV. The solid lines in the plots indicate the actual fitting range while the dashed line (outside the fitted range) indicate the QCD calculations using the fitted parameters, and , which are shown in Table 2. At 2.2 GeV the fit range is very restricted and little of the peak region remains for comparison with MLLA; therefore this point is excluded. The fitted values of increase with decreasing . The differences from varying fitting ranges are included as systematic errors.
| Ecm | (MeV) | |
|---|---|---|
| 2.6 | 342 7 23 | 1.523 0.018 0.023 |
| 3.0 | 325 9 25 | 1.573 0.027 0.026 |
| 3.2 | 286 17 37 | 1.532 0.028 0.052 |
| 4.6 | 239 14 32 | 1.472 0.029 0.039 |
| 4.8 | 238 15 32 | 1.482 0.029 0.038 |
Eq. 2 has a maximum in each spectrum as shown in Fig. 2. Using the fitted parameters from Table 2, the peak positions, , can be determined directly from the limiting spectrum (Eq. 2).
The peak positions can also be obtained by fitting a Gaussian or distorted Gaussian [20] over a limited range of . We choose the Gaussian fit since the distorted Gaussian gives consistent results but with larger errors due to the larger number of free parameters. The changes found when the fitting range is varied are included as systematic uncertainties. Table 3 lists the fitted results. The results of the two methods (pQCD prediction of Eq. 2 and fitted Gaussian form) are consistent at higher energies, and the differences between the two methods are also included in the systematic uncertainties.
| Ecm (GeV) | |
|---|---|
| 2.2 | 1.063 0.017 0.032 |
| 2.6 | 1.189 0.012 0.076 |
| 3.0 | 1.304 0.017 0.049 |
| 3.2 | 1.361 0.021 0.057 |
| 4.6 | 1.646 0.025 0.134 |
| 4.8 | 1.633 0.037 0.193 |
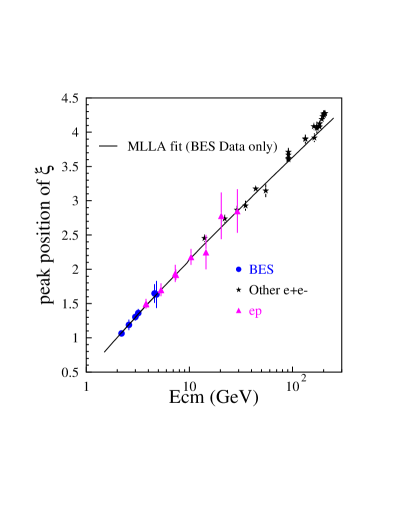
The measured peak positions from this work are plotted in Fig. 3, together with those of high energy and data. MLLA/LPHD predicts the energy dependence of the peak position, , as [1]
| (5) |
where and is 0.2915 (0.3190) for three (four) active flavors. By fitting our data to Eq. 5 , we obtain MeV. This value is consistent with the results from OPAL [21], ZEUS [22] and CDF [23], which are , , and MeV, respectively. However, our value disagrees with L3 [24] and the result of Ref. [4], which are and , respectively. Figure 3 shows that is approximately linear in . A straight line fit of the BES results to as a function of gives a gradient of . The gradients reported by OPAL [25], ZEUS [26] and H1 [27] are , , and , respectively. Our result is somewhat larger.
6 Momentum spectrum
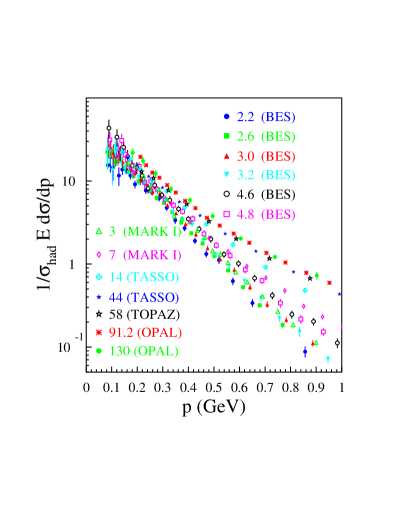
In order to study the behavior of low momentum particles, MLLA/LPHD introduces a Lorentz invariant variable , where and GeV [28]. The six BES Lorentz invariant, charged particle momentum spectra are plotted in Fig. 4, together with those measured by other experiments at higher energy, up to 130 GeV. The tendency of the spectra to approximately converge at lower momenta is cited as evidence that hadron production at very small momentum GeV is approximately energy independent. [29]. This behavior has been explained in Ref. [28] as the coherent emission of low energy (i.e. long wavelength) gluons by the total color current.
7 Charged particle multiplicity and the second binomial moment
According to a NLO QCD calculation, the second binomial moment is given by [5]
| (6) |
with for five (three) active flavors.
The charged multiplicity distributions are obtained using a method which was first employed by TASSO [34] and modified by H1 [27]. Three steps are used to correct the measured unnormalized charged multiplicity distribution , where is the number of observed tracks. The first step is to correct for detector effects and selection criteria. It is performed using Monte Carlo sample II with its hadron level information. For each event, the number of observed tracks with distribution is compared to the number of generated tracks with distribution . Denoting as the number of events generated with tracks when tracks are observed and as the number of observed events with tracks, the correction matrix is expressed as
| (7) |
This matrix relates to by
| (8) |
The second step is to correct for the presence of QED initial state radiation which results in a reduction of the nominal c.m. energy and thus changes the charged multiplicity. Therefore another set of correction factors is calculated according to
| (9) |
where is the normalized multiplicity distribution for events generated at fixed c.m. energy without detector simulation and is the distribution after normalization. Finally, the corrected multiplicity distribution reads
| (10) |
The final step is done to reduce bias that might be introduced by the Monte Carlo generator used [27]. An iterative procedure is used where the predicted multiplicity at the hadron level is reweighted using the previously unfolded multiplicity. This is repeated until convergence is reached.
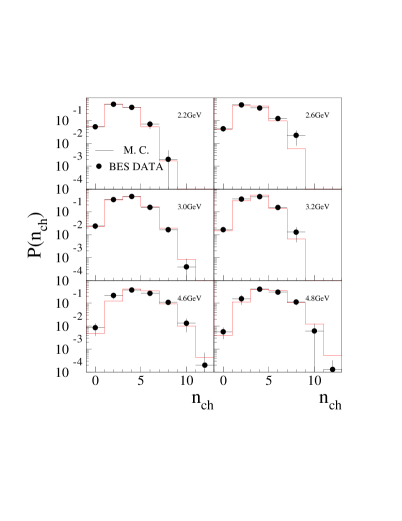
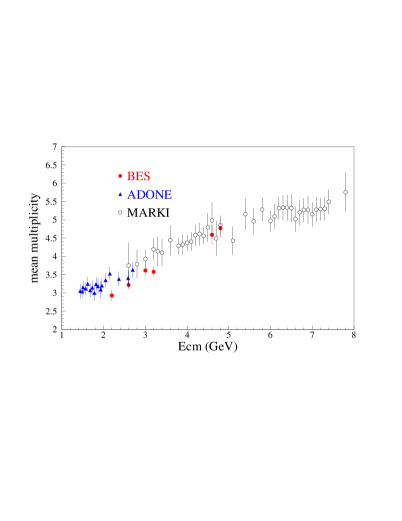
The measured multiplicity distributions at different energies are shown in Fig. 5 along with the Monte Carlo predictions. Figure 6 shows the energy dependence of the mean multiplicity defined as , where is the probability to have tracks.
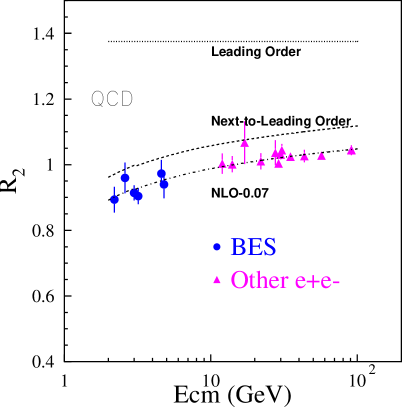
Based on the measured multiplicity distributions, we obtain the second binomial moments , which are displayed in Fig. 7, together with both NLO calculations and published data at higher energies up to 100 GeV from other experiments. Our measured values, though with large errors, are consistent with other measurements at higher energies. The value predicted by leading order QCD is significantly higher than the measured data, and while the NLO calculation comes closer to the data, the remaining disagreement of about in may indicate that is a sensitive probe for higher order QCD or non-perturbative effects.
8 Summary
Using BESII scan data, we have measured the inclusive momentum spectra, multiplicity distributions, and the second binomial moments at 2 - 5 GeV in the continuum. These results are compared with data from other experiments at higher energies, and with QCD model calculations.
The parameters and obtained by fitting the limiting spectra are compatible with those of the ZEUS, CDF, and OPAL experiments. However, the deviations become larger at energies below GeV.
The second binomial moment determined by the BES experiment, though with large errors, are lower than what is predicted to NLO. This is consistent with the long standing discrepancy between the NLO calculation and high energy data from experiments [3].
9 Acknowledgment
We thank the IHEP Accelerator, Computing and BES/BEPC Support divisions. We are especially grateful to Prof. W. Ochs for his help on MLLA/LPHD theory and providing the experimental data at high energy in Fig. 4.
This work is supported in part by the National Natural Science Foundation of China under contracts No. 19991480, No. 19805009 and No. 19825116; the Chinese Academy of Sciences under contract No. KJ 95T-03, No. E-01 (IHEP) and No. X-45 (IHEP); and by the Department of Energy under Contract No. DE-FG03-93ER40788 (Colorado State University), DE-AC03-76SF00515 (SLAC), DE-FG03-94ER40833 (U Hawaii), DE-FG03-95ER40925 (UT Dallas).
References
- [1] V. A. Khoze and W. Ochs, Int. J. Mod. Phys. A12 (1997) 2949.
- [2] Ya. I. Azimov, Yu. L. Dokshitzer, V. A. Khoze and S. I. Troyan, Phys. Lett. B165 (1985) 147; Z. Phys. C27 (1985) 65.
- [3] M. Schmelling, Physica Scripta 51 (1995) 683.
- [4] O. Biebel, Phys. Rep. 340 (2001) 165.
- [5] E. D. Malaza and B. R. Webber, Phys. Lett. B149 (1984) 501; ibid. Nucl. Phys. B267 (1986) 702.
- [6] ALEPH, D. Decamp et al., Phys. Lett. B273 (1991) 181.
- [7] BES Collaboration, J. Z. Bai et al., Phys. Rev. Lett. 84 (2000) 594.
- [8] BES Collaboration, J. Z. Bai et al., Phys. Rev. Lett. 88 (2002) 101802.
- [9] BES Collaboration, J. Z. Bai et al. Nucl. Instr. Meth. A458 (2001) 627.
- [10] W. B. Yan et al., High Ener. Phys. and Nucl. Phys. 26 (2002) 998.
- [11] K. Hagiwara et al., Physical Review D66, (2002) 010001.
- [12] T. Sjostrand, Computer Physics Communications 82 (1994) 74.
- [13] H. M. Hu et al., High Ener. Phys. and Nucl. Phys., 25 (2001) 1035.
- [14] E. Eichten et al., Phys. Rev. D21 (1980) 203.
- [15] J. C. Chen et al., Phys. Rev. D62 (2000) 034003.
- [16] F.A. Berends and R. Kleiss, Nucl. Phys. B178 (1981) 141.
- [17] G. Bonneau and F. Martin, Nucl. Phys. B27 (1971) 387.
- [18] E.A. Kureav and V.S. Fadin, Sov. J. Nucl. Phys. 41 (1985) 3.
- [19] “Z Physics at LEPI”, CERN 89-08, Vol. 3, p. 331-332.
- [20] C. P. Fong and B. R. Webber, Phys. Lett. B229 (1989) 289.
- [21] OPAL Collaboration, G. Abbiendi et al., Eur. Phys. J. C16 (2000) 185.
- [22] V. A. Jamieson, Ph. D thesis, DESY F35 D-95-01.
- [23] A. Safonov, talk at 8th International Workshop on Deep Inelastic Scattering and QCD (DIS2000), Fermilab-Conf-00-131-EM.
- [24] L3 Collaboration, M. Acciarri et al., Phys. Lett. B444 (1998) 569.
- [25] OPAL Collaboration, M. Z. Akrawy et al., Phys. Lett. B247 (1990) 617.
- [26] ZEUS Collaboration, M. Derrick et al., Z. Phys. C67 (1995) 93.
- [27] H1 Collaboration, S. Aid et al., DESY 95-072 (hep-ex/9505003).
- [28] V. A. Khoze, S. Lupia and W. Ochs, Eur. Phys. J. C25 (1988) 77.
- [29] P. Abreu et al., Phys. Lett. B459 (1999) 397.
- [30] MARKI, J. Siegrist et al., Phys. Rev. D26 (1982) 969.
- [31] TASSO, W. Braunschweig et al., Z. Phys. C47 (1990) 187.
- [32] TOPAZ, R.Itoh et al., Phys. Lett. B345 (1995) 335.
- [33] OPAL, G. Alexander et al., Z. Phys. C72 (1996) 191.
- [34] TASSO Collaboration, W. Braunschweig et al., Z. Phys. C45 (1989) 193.
- [35] C. Bacci et al., Phys. Lett. B86 (1979) 234.
- [36] CLEO-C and CESR-C: A New Frontier of Weak and Strong Interactions, CLNS-01-1742 (2001).
- [37] Preliminary Design Report of the BESIII Detector, talk at ICHEP02 (2002).