Frederick A. Harris1 for the BES Collaboration
1 Department of Physics and Astronomy1 Department of Physics and Astronomy
The University of Hawaii
Honolulu
The University of Hawaii
Honolulu HI 96822
HI 96822
Abstract
Measurements of branching fractions for decays
into , , , , , ,
, , and final states, based
on a data sample of
events collected with the BESI detector at the Beijing
Electron-Positron Collider, are reported.
Using the same event sample,
radiative decays of the radially excited charmonium resonance,
into , and final states have been
measured. The branching ratios
and
are obtained.
Cross sections for , hadrons, , and
have been measured in the vicinity of the resonance
using the BESII detector. The total width; partial widths to
hadrons, , and muons; and corresponding branching fractions
have been determined to be keV; keV, keV, and
keV; and ,
, ,
respectively.
Decays of are used to determine
the mass and width of the using a sample of 58 M
events: MeV and
MeV.
The first observation of (J=0,1,2) decays to is
reported using data collected with the BESII detector at the
BEPC. The branching ratios are determined to be , and . Results are compared with model
predictions.
1 Introduction
The Beijing Spectrometer (BES) is a general purpose solenoidal
detector at the Beijing Electron Positron Collider (BEPC). BEPC
operates in the center of mass energy range from 2 to 5 GeV with a
luminosity at the energy of approximately
cm-2s-1. BES (BESI) is described in detail in Ref.
\citenbes1, and the upgraded BES detector (BESII) is described in
Ref. \citenbes2. This paper presents some recent results; details
can be found in the references.
2 Hadronic decays
Both and decays to light hadrons are expected to
proceed dominantly via , with widths that are
proportional to the square of the
wave function at the origin. [3] This yields the expectation that
It was first observed by MarkII [4] that the
vector-pseudoscalar and channels are
suppressed with respect to the expectation - the “ puzzle”. BES finds a suppression factor of 60; this and
many other BES branching ratio results can be found in
Refs. \citenrhopi,VT,eta,VP,bbbar.
Channel
X
()
Table 1: Branching fractions of and values
for and
hadronic decays. The are taken from
the PDG. [10] To determine , we use
(PDG’96).
Here, we report measurements of branching fractions for decays
involving an or a , including , , , , , , , , and
final states, based on a data sample of
events collected with the BESI
detector at the Beijing Electron-Positron Collider. Events are
selected using particle identification and kinematic fitting.
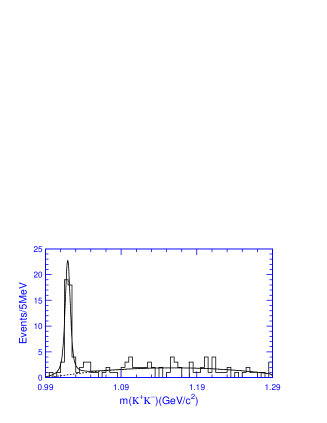
As an example, the
invariant mass distribution for candidate events
is shown in Fig. 2, where a clear peak can
be seen. In Fig. 2, the mass
distribution for events is shown; there is a clear
peak.
We obtain the branching ratios and values
shown in Table 1.
The branching fractions for and
update previous BES results, while those for other
decay modes are first measurements. The ratios of and
branching fractions are smaller than the expected 12% rule
by a factor of six for ,
by a factor of two for , , and ,
while for other studied channels the ratios are
consistent with expectations within errors.
For more detail on this analysis, see Ref. \citenla1.
Figure 1: The invariant mass distribution for candidate
events.
Figure 2: The mass distribution for candidate
events.
In perturbative QCD, the radiative and decays should
be similar to hadronic decays except instead of decaying into three gluons,
the radiative mode decays via two gluons and one photon.
Thus one power of the coefficient is replaced by
in the cross section formula, and it is expected that the
“12%” rule should also work for radiative decay modes [12].
Hence the ratio of to
for different final states should be
roughly 12%.
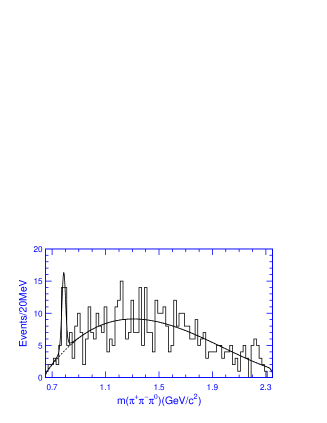
Figure 3:
(a): fit result.
The four curves presented in
the figure are the following: a background curve, a
Breit-Wigner function to describe the on top of the
background, a Breit-Wigner function to describe the
on top of the background, and the total of the two
Breit-Wigners and the background. The fitting range is 0.9 GeV
to 2.5 GeV, since there is some background
below 0.9 GeV. The background at higher mass is due to
processes such as neutrals ,
.
(b): fit result. The curves shown are a
Breit-Wigner to describe the and a polynomial to
describe the background.
Here we report measurements of branching fractions for , , ,
, and . The invariant
mass distributions for are shown in Fig. 3, where
a clear is seen. Results are summarized in
Tables 2 through 4.
First measurements of the and
and
branching fractions are given.
A clear signal
in radiative decay into final states is observed.
The results are consistent with the “12%” rule.
In addition, first measurements of the
branching fractions of and decay into ,
decay into , and an upper limit of the branching
fraction of decay into are reported (see Table
4). For more detail, see Ref. \citenyangwei.
Final state
%
%
Table 2: Values for and
and comparison with the 12% rule.
Mode
from
from
from
from
Table 3: Branching fractions for
modes ( stands for pseudo-scalar).
Mode
Table 4: The decay branching fractions
for or .
3 BES Scan Results
Figure 4: The cross section for (a) hadrons, (b)
, and (c)
versus center-of-mass energy.
The solid curves represent the results of the fit to the data.
In 1999, after the -scan, [14] BES did a careful
scan. The purpose was to improve the accuracies of the
parameters: the total width (), and partial widths
into hadrons (), (), and (), and the corresponding
branching fractions, , , and . and are important because
these decays are used to identify in B decays ().
A total of 24 energy points between 3.67 and 3.71 GeV were scanned.
The total integrated luminosity was 760 nb-1. We assume
, along
with lepton universality: . The cross sections versus scan point energy
and fit curves are shown in Fig. 4, and the fit
results are given in Table 5. We obtain a first
measurement of , and , ,
and have improved precision compared to the
PDG values. [10] The value for agrees within
errors with a
previous BES value of () keV. [15]
A complete description of this work can be found in Ref. \citenla2.
Value
BES
PDG2002
(keV)
(keV)
(keV)
(keV)
Table 5: scan results and comparison with the PDG2002.
[10] value given using the assumption .
4 Parameters
The mass and width of the are rather poorly known; the
confidence level for the PDG weighted average mass is only 0.001.
[10] Previously BES measured the mass using the BESI
4.02 M sample and obtained . [17] BES also used 7.8 M BESI
events and obtained MeV.
[18] For the two data sets combined, MeV and the total width MeV. [18]
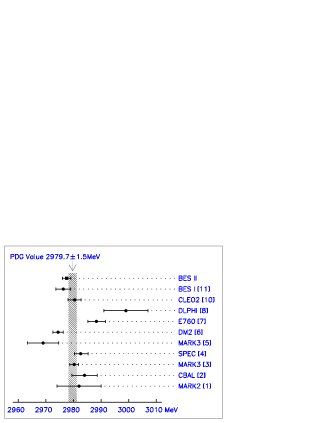
Here, the mass and width have been determined using our BESII 58 M
event sample. We use the channels , with , , ,
, and . Events are selected using
particle identification and kinematic fitting. Figs. 6 and
6 show the mass distributions in the mass region for
, and , respectively. Combining the five decay
channels, we obtain MeV and
MeV, to be compared to the current PDG values: MeV and MeV.
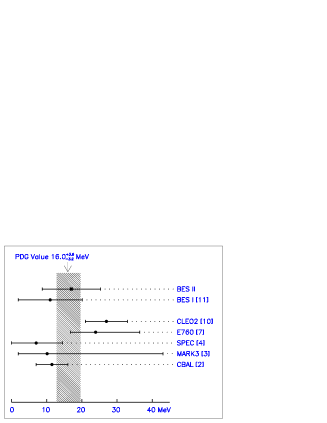
[10] The results for the mass and width are compared with
previous measurements, including previous BES measurements, in
Figs. 8 and 8. The results are in good
agreement with previous BES measurements and the PDG fit values.
More detail on this analysis can be found in Ref. \citenetanew.
Figure 5: The invariant mass distribution in the
region.
Figure 6: The invariant mass distribution
in the region.
Figure 7: Mass measurements of the meson.
Figure 8: Width measurements of the meson.
5
It has been shown both in theoretical calculations and experimental
measurements that the lowest Fock state expansion (color singlet
mechanism, CSM) of charmonium states is insufficient to describe
P-wave quarkonium decays. Instead, the next higher Fock state (color
octet mechanism, COM) plays an important role. [20, 21] Our
earlier measurement [21] of the total width of the agrees
rather well with the COM expectation. The calculation of the partial
width of , by taking into account the COM of
decays and using a carefully constructed nucleon wave
function, [22] obtains results in reasonable agreement with
measurements. [10] The nucleon wave function was then
generalized to other baryons, and the partial widths of many other
baryon anti-baryon pairs predicted. Among these predictions, the
partial width of is about half of that of (J=1,2). [22]
Figure 9: Scatter plot of versus invariant
mass for selected events with the mass in the mass
region.
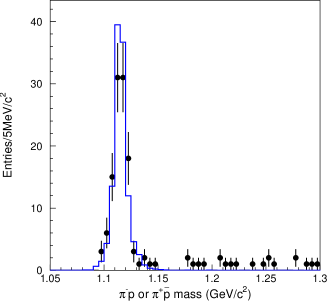
Figure 10: Mass distribution of ()
recoiling against a ()
(mass GeV) for events in the mass region.
Dots with error bars are data and the histogram is the
Monte Carlo simulation, normalized to the signal
region (two entries per event).
Fig. 10 shows a scatter plot of the
versus the invariant mass for events with mass
between GeV/ and GeV/, using the BESII 15
million event sample. The cluster of events
in the lower left corner shows a clear signal.
Selecting events in mass region and requiring the mass
of () to be smaller than 1.15 GeV/, the
() mass distribution shown in
Fig. 10 is obtained. A clear signal can be seen, and the
background below the peak is very small.
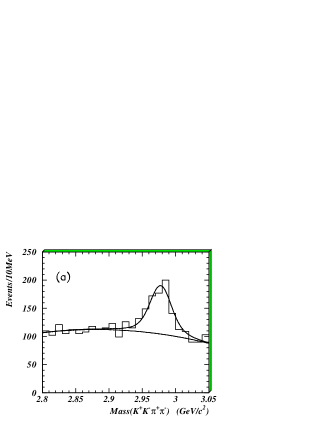
Figure 11: Mass distribution of candidates fitted with three
resolution smeared Breit-Wigner functions and background, as
described in the text.
After requiring that both the and the
mass lie within twice the mass resolution around the nominal
mass, the invariant mass distribution shown in
Fig. 11 is obtained. There are clear , , and
signals. The highest peak around the mass is
due to with a fake photon.
Background from non events is estimated from the mass
sidebands, and this can be described in fitting the mass
spectrum by a linear background. The background from channels with
production, including , , , , , and , are
simulated by Monte Carlo.
Fixing the , and mass resolutions at their
Monte Carlo predicted values, and fixing the widths of the three
states to their world average values, [10] the mass
spectrum (Fig. 11) was fit with three Breit-Wigner functions
folded with Gaussian resolutions and background, including a linear
term representing the non background and a component
representing the background. The unbinned maximum likelihood
method was used to fit the events with mass between 3.22 and
3.64 , and a likelihood probability of 27% was
obtained, indicating a reliable fit. Fig. 11 shows the fit
result, and the fitted masses are ,
and
for , and , respectively, in agreement with
the world average values. [10]
The branching ratios of obtained are
where the first errors are statistical and the second are
systematic.
Compared with the corresponding branching ratios of , [10] the branching ratios of
and agree with the corresponding
branching ratios to within two sigma. This is somewhat
in contradiction with the expectations from Ref. \citenwong,
although the errors are large.
As for , the measured value agrees with the
measurements from BES and E835 [21, 23] within 2 standard
deviations. One should also note that there is no prediction for
. More detail may be
found in Ref. \citengll.
6 Summary
Branching fractions are determined, many for the first time, using the
4.2 million BESI event sample. They are used to test the
“12 %” rule. Results from a fit to a careful scan in the vicinity
of the are presented. The 58 million BESII event
sample is used to measure the mass and width of the .
Finally,
events are observed for the first time in decays using
the BESII 15 million event sample, and corresponding branching ratios
are determined.
Acknowledgements.
The author would like to thank Prof. S. Ishida, Prof.
K. Takamatsu, and all the other members of the Sigma Group for their
support during the Symposium.
References
[1] J. Z. Bai et al., (BES Collab.), Nuc. Inst. Meth. A344, 319 (1994).
[2] J. Z. Bai et al., (BES Collab.), Nuc. Inst. Meth. A458, 627 (2001).
[3] T. Appelquist and H.D. Politzer
Phys. Rev. Lett. 34, 43 (1975); and A. De Rujula and S. L.
Glashow, ibid, page 46.
[4] M.E.B. Franklyn et al., (MarkII Collaboration),
Phys. Rev. Lett. 51, 963 (1983).
[5] Y. S. Zhu, Proceedings of the 28th International
Conference on High Energy Physcis, ed. Z. Adjuk and A. K. Wroblewski,
World Scientific, 507 (1997).
[6] J. Z. Bai et al., (BES Collab.), Phys. Rev. Lett. 81,
5080 (1998).
[7]
J.Z. Bai et al.,
(BES Collab.),
Phys. Rev. D58, 097101 (1998).
[8] J. Z. Bai et al., (BES Collab.), Phys. Rev. Lett. 83,
1918 (1999).
[9]
J.Z. Bai et al.,
(BES Collab.),
Phys. Rev. D63, 032002 (2001).
[10] K. Hagiwara et al., Phys. Rev. D66, 010001 (2002).
[11]
J.Z. Bai et al.,
(BES Collab.), Phys. Rev. D67, 052002 (2003).
[12] T. Appelquist, A. De Rújula, H.D. Politzer.
S.L. Glashow. Phys. Rev. Lett. 34, 365 (1975);
M. Chanowitz. Phys. Rev. D
12, 918 (1975); L. Okun and M. Voloshin, ITEP-95-1976 (unpublished); S.J.
Brodsky, T.A. DeGrand, R.R. Horgun, D.G. Coyne, Phys. Lett. 73B,
203 (1978);
K. Koller and T. Walsh. Nucl. Phys. B140, 449 (1978).
[13]J. Z. Bai et al., (BES Collab.), Phys. Rev. D67,
032004 (2003).
[14]J. Z. Bai et al., (BES Collab.), Phys. Rev. Lett. 84, 594 (2000);
J. Z. Bai et al., (BES Collab.), Phys. Rev. Lett. 38, 101802 (2002).
[15] J. Z. Bai et al., (BES Collab.), Phys. Rev. D65,
052004-1 (2002).
[16] J. Z. Bai et al., (BES Collab.), Phys. Lett. B550,
24 (2002).
[17] J. Z. Bai et al., (BES Collab.), Phys. Rev. D60,
72001 (1999).
[18] J.Z. Bai et al., (BES Collab.), Phys. Rev. D 62,
72001 (2000).
[19] J.Z. Bai et al., (BES Collab.),
Phys. Lett. B555, 174 (2003).
[20] See, for example G.T. Bodwin,
E. Braaten and G.P. Lepage,
Phys. Rev. D51, 1125 (1995);
Han-Wen Huang and Kuang-Ta Chao,
Phys. Rev. D54, 6850 (1996);
J. Bolz, P. Kroll and G. A. Schuler,
Phys. Lett. B392, 198 (1997).
[21] J. Z. Bai et al. (BES Collab.),
Phys. Rev. Lett. 81, 3091 (1998).
[22] S. M. Wong, Eur. Phys. J. C14, 643 (2000).
[23] S. Bagnasco et al. (E835 Collab.),
Phys. Lett. B533, 237 (2002);
M. Ambrogiani et al. (E835 Collab.),
Phys. Rev. Lett. 83, 2902 (1999).
[24] J.Z. Bai et al., (BES Collab.),
accepted by Phys. Rev. D, hep-ex/0304012.