RECENT CLEO and RESULTS
Recent CLEO results on the observation of the state and a search for the state from a data sample of decays collected with the CLEO-III detector, and a measurement of the production spectrum using decays collected with the CLEO-II detector are described.
1 Introduction
CLEO is concluding a 1-year program to collect of integrated luminosity distributed over the and resonances. These datasets will augment the world supply of quark-antiquark bound state data for these resonances by more than an order of magnitude. The data is produced by the symmetric collider CESR and collected by the CLEO-III detector, a configuration of the CLEO detector with excellent electromagnetic calorimetry and enhanced particle identification capabilities.
2 Observation
Heavy quarkonia (e.g., quark pairs) are an appealing physical system for probing the strong interactions. Bound states below open flavor threshold are narrow, leading to long lifetimes and little mixing between excitation levels. The constituent quarks are essentially non-relativistic, making the bound state system particularly appropriate for analysis by lattice QCD calculations and by effective theories via potential models.
We present evidence for the observation of the state, the first observation of a narrow bound state since the early 1980’s, using the following radiative 5-stage cascade decay that ultimately produces 4 photons and a lepton pair in the final state:
| (1) |
The theoretical product branching fraction for this sequential decay is . The dominant background reaction is . An additional background mode, the same cascade chain as Eq. 1 except that the intermediate is replaced by the state, must also be rejected.
Measuring the branching fraction for the background transitions is a useful check of the technique used to reconstruct our cascade signal mode. A key analysis variable used to reconstruct decays is the minimal mass deviation chi-squared formed from among the three possible photon pairs formed from four individual photons. After cutting on , the ratio is formed from the deviation of the four-photon recoil mass from the mass and its expected mass resolution . The distribution is shown for data in Fig. 1 fit with a Monte Carlo determined shape. Combining the yield of events with a 13.6% Monte Carlo determined efficiency implies a branching fraction %, consistent with, but more precise than, previous measurements .

Confident that our technique for reconstructing multiple photons in a single event is robust, we select events by constructing a chi-squared based variable that is a function of the unknown mass and the total angular momentum of the states on either side of the in the cascade chain. Other chi-squared based variables are used to reject background. Surviving events are shown in the left hand side of Fig 2 as the histogram with the signal region . The fit of the signal on top of the background is shown as the heavy and dashed lines, respectively, producing a significance of 9.7.


The mass is estimated by plotting for each event in the signal region of the left hand plot in Fig. 2 the value of the mass that minimizes . Monte Carlo studies predict a peak at the true mass plus two satellite peaks due to mis-reconstructed photons from shower leakage in the calorimeter. The mass distribution for data is shown as the histogram in the right hand plot of Fig. 2. Although the can be produced in any of the states, our selection efficiency is largest for the and states while theory predicts that the state should be preferentially produced in the decay cascade. Fitting the histogram with two peaks, each with two satellites, produces a peak at and at , with an overall 58% C.L. Fitting under the assumption that there is no low mass peak produces a 0.04% C.L. and the difference in significance between these two fits implies a significance of the low mass peak of . Fitting the histogram with just a single peak plus two satellites yields a 43% C.L. fit with a peak at .
Averaging over the different fits yields a mass of with the state favored, but the state not excluded. Based on our measured yields and Monte Carlo determined efficiency, the preliminary overall branching fraction for the 5-stage decay cascade of the via the is .
3 Search for
The spin-singlet state of the system, including the ground state , has yet to be observed. The reaction produces states with the same quantum numbers as the photon so the state cannot be produced directly at CESR. However, the state is accessible through decays from the spin-triplet states via magnetic dipole (M1) radiative transitions which occur between states with opposite quark spin configuration but the same orbital angular momentum. The rate for M1 transitions between the and the is given by
| (2) |
where and are the principal quantum numbers of the respective systems, is an overlap integral between initial and final states and is the energy of the emitted photon.
With a data sample of events, CLEO searches for transitions with to avoid photon energies in the MeV range which are susceptible to background contamination from decays. The inclusive photon search technique for is tuned using the electric dipole (E1) transitions where the photon energy is MeV, similar to what is expected for the signal M1 transition.
The inclusive photon spectrum between approximately and is shown in the left hand side of Fig. 3 where the dots indicate data and the dashed line is background. A logarithmic energy scale is used to preserve energy resolution. The central peak is a superposition of three gaussians for the three E1 transitions and the search window is also indicated.


The right hand side of Fig. 3 shows the background subtracted central peak and the search region fitted with a Crystal Ball lineshape. Multiple fits are performed for various photon energies in the search region and no signal is seen. This lack of signal is converted into a 90% C.L. upper limit shown in Fig. 4, excluding a variety of phenomenological models .

4 Production
An unexpectedly large inclusive decay rate in the momentum range GeV/c observed by CLEO and BABAR is possibly described by an anomalously large coupling between the and two gluons , in the underlying mechanism thought responsible for production. Here the process is followed by the two gluon coupling to the shown in Fig. 5.
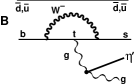
The effective coupling can be written as
| (3) |
where is the transition form factor, is the four-momentum of the virtual hard gluon () and is the momentum of the soft gluon (). Workers have shown that the region relevant to the process is accessible in high energy production in decays so that constraints can be placed on from the fast spectrum in decays. Various choices , are available for .
We use decays collected with the old CLEO II detector and detect mesons through the decay channel . This data sample can be divided into three parts:
where the last piece is the most problematic background to correct for. We do this by using of off-resonance data collected just below the resonance by a process that maps the production spectra at the higher energy to the lower energy by a procedure analogous to what is done when one maps one normalized probability distribution into another one with a different domain. The remapping is done with the aid of the variable , the fractional energy of the .
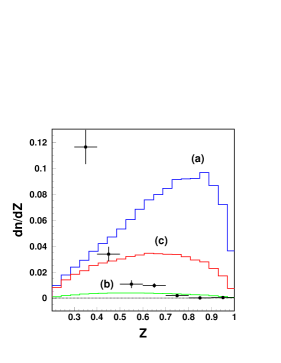
Defining three differential branching fractions
permits us to use the spectrum of and discriminate among the various phenomenological models that predict different forms of . Fig. 6 shows the comparison between the measured spectrum (dots) and various phenomenological predictions (histograms). Only the region is relevant for comparison since the models require the be “fast.” The model labeled “b” is representative of perturbative QCD and fits the data best. There is no evidence for any anomalously high coupling at large energies.
Acknowledgments
The author acknowledges support by the U.S. Department of Energy under grant DE-FG03-95ER40908.
References
References
- [1] S. Godfrey and J.L. Rosner, PRD 64, 097501 (2001); W. Kwong and J.L. Rosner, PRD 38, 279 (1988).
- [2] F. Butler et al., (CLEO II), PRD 49, 40 (1994).
- [3] U. Heintz et al., (CUSB), PRD 46, 1928 (1992).
- [4] S. Godfrey and J.L. Rosner, PRD 64, 074011 (2001).
- [5] T.E. Browder et al., PRL 81, 1786 (1998).
- [6] B. Aubert et al., hep-ex/0109034.
- [7] D. Atwood and A. Soni, PLB 405, 150 (1977).
- [8] W.S. Hou and B. Tseng, PRL 80, 434 (1998).
- [9] A.L. Kagan and A.A. Petrov, hep-ph/9707354.
- [10] A.L. Kagan, hep-ph/0201313.
- [11] A. Ali and A.Y. Parkhomenko, PRD 65, 074020 (2002).
- [12] T. Muta and M.-Z. Yang, PRD 61, 054007 (2000).