VIOLATION IN DECAY
We present an improved measurement of -violating asymmetries in decays based on a data sample collected at the resonance with the Belle detector at the KEKB asymmetric-energy collider. We reconstruct one neutral meson as a eigenstate and identify the flavor of the accompanying meson from its decay products. From the asymmetry in the distribution of the time intervals between the two meson decay points, we obtain the -violating asymmetry amplitudes and , where the statistical uncertainties are determined from Monte Carlo pseudo-experiments. We rule out the -conserving case, , at the confidence level. We discuss how these results constrain the value of the CKM angle .
1 INTRODUCTION
Kobayashi and Maskawa (KM) proposed, in 1973, a model where violation is incorporated as an irreducible complex phase in the weak-interaction quark mixing matrix . The KM model predicts -violating asymmetries in the time-dependent rates for and decays to a common eigenstate, , as
| (1) |
where () is the partial decay rate of pure () state at , and is the mass difference between the two mass eigenstates . The -violating parameters and defined in Eq. (1) are expressed by and , where is a complex parameter that depends on mixing, on eigenvalue of and on the amplitudes for and decay to . In the mode , the Standard Model predicts and . Recent measurements of the -violating parameter by the Belle and BaBar collaborations established violation in the that is consistent with KM expectations. In the mode , we would have and , or equivalently , if the tree amplitude were dominant. The situation is complicated by the possibility of significant contributions from gluonic penguin amplitudes that have a different weak phase and additional strong phases . As a result, may not be equal to and direct violation, , may occur.
2 EXPERIMENTAL APPARATUS
In this paper, we report an updated measurement that is based on a data sample, containing 85106 pairs, which were collected with the Belle detector at the KEKB asymmetric-energy collider at resonance. KEKB archives the highest peak luminosity of as of March, 2003. The Belle detector is a large-solid-angle general purpose spectrometer that consists of a silicon vertex detector (SVD), a central drift chamber (CDC), an array of aerogel threshold Čerenkov counters (ACC), time-of-flight scintillation counters, and an electromagnetic calorimeter comprised of CsI(Tl) crystals located inside a superconducting solenoid coil that provides a 1.5 T magnetic field. An iron flux return located outside of the coil is instrumented to detect mesons and muons.
3 EXPERIMENTAL METHOD
Experimental method in this report is very similar to the well-established measurement in . In the decay chain , where one of mesons decays at time to and the other decays at time to a final state that distinguishes between and , the decay rate has a time dependence given by
| (2) |
where is the lifetime, = , and the -flavor charge = +1 () when the tagging meson is a (). As described below in Section 4, we reconstruct one of mesons with two tracks identified as pion. We determine the flavor of the accompanying from the information of its decay products. is determined from , the displacement in between the decay vertices of two mesons: , where is a Lorentz boost factor of . In flavor tagging and measurement, we apply the same method used for the Belle measurement .
The asymmetry parameters, and , are obtained from an unbinned maximum likelihood fit to the observed distribution. For this purpose, we use probability density functions, (PDFs) that are based on theoretical distributions given by Eq.(2). PDFs are diluted with the background and smeared by the detector response. We use the same detector response as those used for the measurement . In the fit, and are free parameters determined by maximizing the likelihood function , where the product is over all candidates.
4 RECONSTRUCTION
The event selection is described in detail elsewhere . We use oppositely charged track pairs that are positively identified as pions according to the combined information from the ACC and the CDC measurement. The efficiency of the pion identification is 91% and the contamination from miss-identified kaon is 10% for the track momentum from 1.5 to 4.5 . Candidate mesons are reconstructed using the energy difference and the beam-energy constrained mass , where is the cms beam energy, and and are the cms energy and momentum of the candidate. The major sources of the background in are decays where kaons are misidentified as pions, and the background from the continuum ().
In order to suppress the continuum background, we form signal and background likelihood functions, and , from two variables. One is a Fisher discriminant determined from six modified Fox-Wolfram moments ; the other is the cms flight direction with respect to the axis. We determine from a GEANT-based Monte Carlo (MC) simulation , and from - sideband data dominated by the continuum background. We reduce the continuum background by imposing requirements on the likelihood ratio = for candidate events. We optimize requirement for each flavor tagging category to maximize the expected sensitivity.
5 SIGNAL YIELD
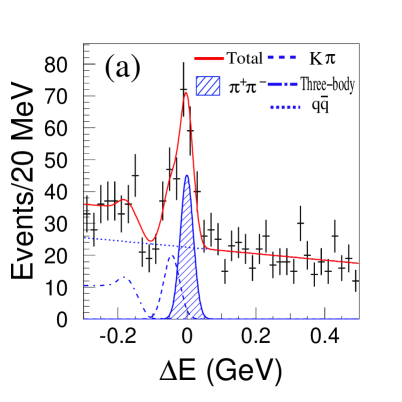
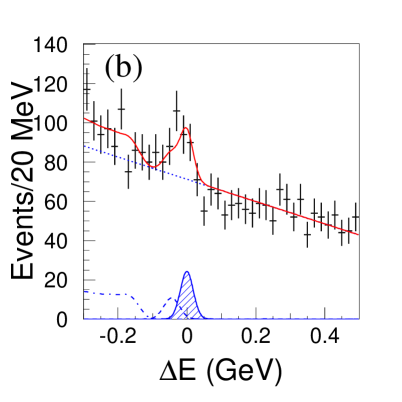
Figures 1(a) and (b) show the distributions for the candidates that are in the signal region with 0.825 and with 0.825, respectively, after flavor tagging and vertex reconstruction. In the and signal region, we find 275 candidates for 0.825 and 485 candidates for 0.825. The signal yield for 0.825 is extracted by fitting the distribution with a Gaussian signal function plus contributions from misidentified events, three-body -decays, and continuum background. The fit yields events, events and continuum events in the signal region. The errors do not include systematic uncertainties unless otherwise stated. Here the error on the yield of continuum events in the signal region is obtained by scaling the error of the yield from the fit that encompasses the entire range. For , we fix the level of signal by scaling the number by a MC-determined factor and that of the continuum background from the sideband. The ratio of the background to the signal is fixed to the value measured with the sample. We obtain events, events and continuum events in the signal region for . The contribution from three-body -decays is negligibly small in the signal region.
6 FIT RESULTS
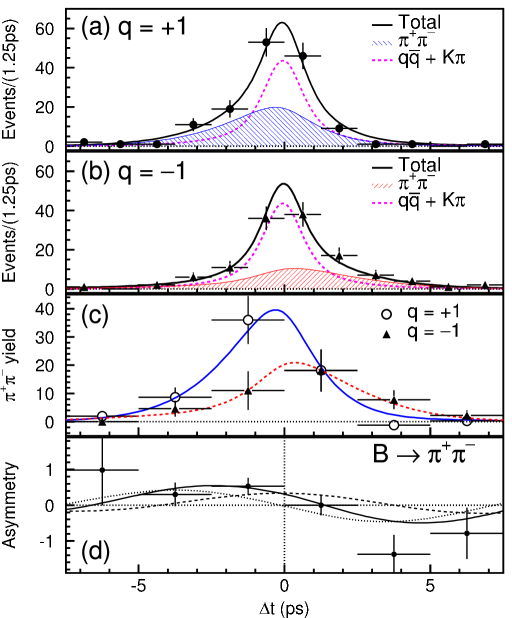
The unbinned maximum likelihood fit to the 760 candidates (391 - and 369 -tags), containing 163 signal events, yields
| (3) | |||||
| (4) |
Here we quote the rms values of the MC and distributions as the statistical errors of our measurement, because the log-likelihood ratio curves from our data deviates from parabolic behavior and the statistical error estimation using log-likelihood ratio, 2ln(, is not appropriate.
7 CROSS CHECKS
We perform a number of cross checks. We measure the meson lifetime using the same vertex reconstruction method. In addition, we check for biases in the analysis using samples of non- eigenstates, decays, and sideband data.
We perform a lifetime measurement with the candidate events that uses the same background fractions, vertex reconstruction methods, and resolution functions that are used for the fit. The result, , is consistent with the world-average value . We also perform measurement of lifetime and - mixing with the 1371 candidate events (610 signal events), that are selected using positively identified the charged kaons. we use the same vertex reconstruction method and wrong-tag fractions as and determine ps and ps-1, which are in agreement with the world average values .
We also use samples of non- eigenstate , and decays, selected with the same event-shape criteria, to check for biases in the analysis. The combined fit to this control sample of 15321 events yields and . As expected, neither mixing-induced nor direct -violating asymmetry is observed. A fit to the candidates candidates yields , in agreement with the counting analysis mentioned above , and , which is consistent with zero. A comparison of the event yields and distributions for - and -tagged events in the sideband region reveals no significant asymmetry.
8 SIGNIFICANCE
We use the Feldman-Cousins frequentist approach to determine the statistical significance of our measurement. In order to form confidence intervals, we use the and distributions of the results of fits to MC pseudo-experiments for various input values of and . The distributions incorporate possible biases at the boundary of the physical region as well as a correlation between and ; these effects are taken into account by this method. The distributions are also smeared with Gaussian functions that account for systematic errors. Figure 3 shows the resulting two-dimensional confidence regions in the vs. plane. The case that symmetry is conserved, , is ruled out at the confidence level (C.L.), equivalent to significance for Gaussian errors. The minimum confidence level for = 0, the case of no direct violation, occurs at ) = ( and is 97.3, which corresponds to 2.2 significance.
9 DISCUSSION
Using the standard definitions of weak phases , , and , the decay amplitudes for and to are
| (5) | |||||
| (6) |
where and are the amplitudes for the tree and penguin graphs and and are their strong phases. Here we adopt the notation of Ref. and use the convention in which the top-quark contributions are integrated out in the short-distance effective Hamiltonian. In addition, the unitarity relation + = is applied. Using the above expressions and = , we determine . Explicit expressions for and are
| (7) | |||||
| (8) | |||||
| (9) |
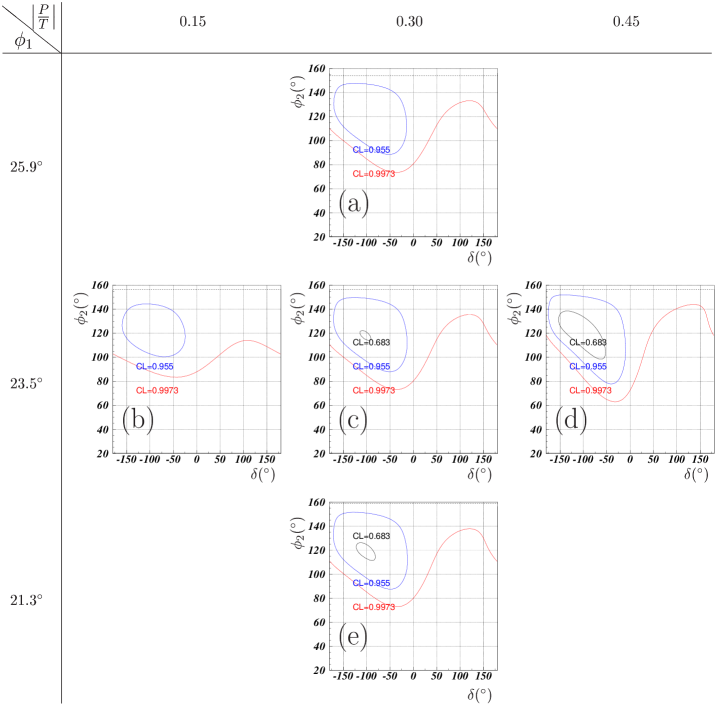
where . We take . When is positive and , is negative. Recent theoretical estimates prefer with large uncertainties . Figures 4(a)-(e) show the regions for and corresponding to the 68.3 C.L., 95.5 C.L. and 99.73 C.L. region of and (shown in Fig. 3) for representative values of and . Note that a value of (,) inside the 68.3 C.L. contour requires a value of greater than 0.3. The allowed region is not very sensitive to variations of within the errors of the measurements, as can be seen by comparing Figs. 4(a), (c) and (e). The range of that corresponds to the 95.5 C.L. region of and in Fig. 3 is
| (10) |
for and . The result is in agreement with constraints on the unitarity triangle from other measurements .
10 CONCLUSION
In summary, we have performed an improved measurement of violation parameters in decays. An unbinned maximum likelihood fit to 760 candidates, which contain (stat) signal events, yields , and , where the statistical uncertainties are determined from MC pseudo-experiments. This result is consistent with our previous measurement and supersedes it. We obtain confidence intervals for -violating asymmetry parameters and based on the Feldman-Cousins approach where we use MC pseudo-experiments to determine acceptance regions. We rule out the -conserving case, , at the confidence level.
The result for indicates that mixing-induced violation is large, and the large term is an indication of direct violation in meson decay. Constraints within the Standard Model on the CKM angle and the hadronic phase difference between the tree () and penguin () amplitudes are obtained for values that are favored theoretically. We find an allowed region of that is consistent with constraints on the unitarity triangle from other measurements.
REFERENCES
References
- [1] M. Kobayashi and T. Maskawa, Prog. Theor. Phys. 49, 652 (1973).
- [2] A. B. Carter and A. I. Sanda, Phys. Rev. D 23, 1567 (1981); I. I. Bigi and A. I. Sanda, Nucl. Phys. B 193, 85 (1981).
- [3] Throughout this paper, the inclusion of the charge conjugate mode decay is implied unless otherwise stated.
- [4] () arg and () arg.
- [5] Belle Collaboration, K. Abe et al., Phys. Rev. Lett. 87, 091802 (2001); Belle Collaboration, K. Abe et al., Phys. Rev. D 66, 032007 (2002).
- [6] BaBar Collaboration, B. Aubert et al., Phys. Rev. Lett. 87, 091801 (2001); BaBar Collaboration, B. Aubert et al., Phys. Rev. D 66, 032003 (2002); BaBar Collaboration, B. Aubert et al., Phys. Rev. Lett. 89, 201802 (2002).
- [7] M. Gronau, Phys. Rev. Lett. 63, 1451 (1989); D. London and R. Peccei, Phys. Lett. B 223, 257 (1989); M. Beneke, G. Buchalla, M. Neubert and C. T. Sachrajda, Nucl. Phys. B 606, 245 (2001); Y. Y. Keum, H-N. Li and A. I. Sanda, Phys. Rev. D 63, 054008 (2001); M. Ciuchini et al., Phys. Lett. B 515, 33 (2001); M. Gronau and J. L. Rosner, Phys. Rev. D 65, 013004 (2002).
- [8] Belle Collaboration, K. Abe et al., hep-ex/0301032, submitted to Phys. Rev. D
- [9] Belle Collaboration, A. Abashian et al., Nucl. Instrum. Methods A 479, 117 (2002).
- [10] E. Kikutani ed., KEK Preprint 2001-157 (2001), to appear in Nucl. Instrum. Methods A
- [11] A general review of the formalism is given in I.I. Bigi, V.A. Khoze, N.G. Uraltsev, and A.I. Sanda, “ Violation” page 175, ed. C. Jarlskog, World Scientific, Singapore (1989).
- [12] Belle Collaboration, K. Abe et al., Phys. Rev. D 66, 071102 (2002).
- [13] H. Tajima et al., hep-ex/0301026, submitted to Nucl. Instrum. Methods A.
- [14] Belle Collaboration, B.C.K Casey et al., Phys. Rev. D 66, 092002 (2002).
- [15] The Fox-Wolfram moments were introduced in G. C. Fox and S. Wolfram, Phys. Rev. Lett. 41, 1581 (1978). The Fisher discriminant used by Belle is described in and Belle Collaboration, K. Abe et al., Phys. Lett. B 511, 151 (2001).
- [16] CERN Program Library Long Writeup W5013, CERN, 1993.
- [17] Particle Data Group, K. Hagiwara , Phys. Rev. D 66, 010001-1 (2002).
- [18] Belle Collaboration, K. Suzuki, to appear in the proceedings of XXXI International Conference on High Energy Physics, Amsterdam, the Netherlands, July 24-31, 2002.
- [19] G. J. Feldman and R. D. Cousins, Phys. Rev. D 57, 3873 (1998).
- [20] M. Gronau and J.L. Rosner, Phys. Rev. D 65, 093012 (2002).
- [21] M. Gronau and J.L. Rosner, Phys. Rev. D 65, 013004 (2002).
- [22] Z. Luo and J.L. Rosner, Phys. Rev. D 65, 054027 (2002).
- [23] M. Beneke, G. Buchalla, M. Neubert, and C. T. Sachrajda, Nucl. Phys. B 606, 245 (2001).
- [24] The authors of Ref. use flavor symmetry to estimate from the measured decay rate, and factorization to estimate from the decay rate for .
- [25] Using the average of recent values of sin2 from Belle and BaBar , we obtain .
- [26] Y. Nir, hep-ph/0208080, to appear in the proceedings of XXXI International Conference on High Energy Physics, Amsterdam, Netherlands, July 24-31, 2002.
- [27] Belle Collaboration, K. Abe et al., Phys. Rev. Lett. 89, 071801 (2002). (stat)(syst) and (stat)(syst). In this paper, the statistical uncertainties were determined from the observed fitting errors rather than from MC pseudo-experiments as in the analysis described here. Thus, the errors here are larger than those obtained by scaling the previous errors by the integrated luminosities.