Studies of correlations between and mesons in high energy photoproduction
Abstract
Studies of correlations for a large sample of events containing fully and partially reconstructed pairs of charmed mesons recorded by the Fermilab photoproduction experiment FOCUS (FNAL-E831) are presented. Correlations between and mesons are used to study heavy quark production dynamics. We present results for fully and partially reconstructed charm pairs and comparisons to a recent version of Pythia with default parameter settings. We also comment on the production of in our data.
††thanks: See http://www-focus.fnal.gov/authors.html for additional author information.
, , , , , , , , , , , , , , , , , , , , , , , , , , , , , , , , , , , , , , , , , , , , , , , , , , , , , , , , , , , , , , , , , , , , , , , , , , , , , , , , , , , , , , , , , , , , , , , , , , , , , , , , ,
1 Introduction
Heavy quark production continues to present itself as a challenge to our understanding of the strong interaction. While Quantum Chromodynamics (QCD) provides a theoretical framework for our understanding and perturbative QCD can be applied to some aspects of heavy quark production, other aspects remain elusive and cannot be described without including a variety of non-perturbative effects. This is especially true for charm production, where perturbative QCD calculations involve large uncertainties and non-perturbative effects play a significant role in modeling physical observables. Until we achieve a fundamental understanding of the strong interaction, accurate models that are able to reproduce properties of the strong interaction—such as heavy quark production—are crucial for our understanding of this fundamental force.
In this paper, we present new results from FOCUS (FNAL-E831) on charm-pair correlations between and mesons. Charm-pair correlations have received considerable theoretical attention [1, 2, 3, 4, 5, 6], and have been studied in both hadroproduction [7, 8, 9, 10, 11, 12] and photoproduction [13, 14] experiments. We present our photoproduction results by comparing data distributions to predictions from a recent version of a Monte Carlo based on the Lund Model [15], which includes non-perturbative effects that have been shown to be important in charm production. We select default settings for charm photoproduction in the Monte Carlo to facilitate comparisons with theoretical predictions and results from other experiments.
2 Experimental method
The data for our studies of correlations were recorded by the FOCUS experiment during the 1996–1997 fixed-target run at the Fermi National Accelerator Laboratory. The experiment ran with a photon beam111The photon beam was produced from the bremsstrahlung of secondary electrons and positrons with an endpoint energy of 300 GeV. The average photon energy for the recorded data was 180 GeV with a width of 50 GeV. and a spectrometer that was upgraded from a previous photoproduction experiment, E687 [16]. The FOCUS spectrometer had a target that consisted of four BeO target elements for most of the recorded data222Early in the run a few different targets were used, and less than 5 of the charm-pair data were recorded with Be (instead of BeO) target elements.. A vertex detector, which was located in the target region, had a total of 16 planes of silicon strip detectors. Four of the planes were interleaved with the BeO target elements, and 12 were located downstream of the target. Tracks that were reconstructed in the vertex detector were linked to particle tracks that were found in five multiwire proportional chambers. Particle momenta were determined by measuring the deflection of tracks in two analysis magnets of opposite polarity, and particle identification was accomplished using measurements from three multicell threshold Čerenkov counters, details of which are described elsewhere [17].


Here we describe, for the first time, the candidate-driven algorithm that was used to collect a large sample of 7000 pairs of fully reconstructed charmed mesons. The sample consists of pairs of mesons: , , , and . For this paper, we considered the decay modes , , , and charged-conjugate modes. The algorithm considered all combinations of two, three, and four charged tracks to find a combination that could be associated with the decay of a single meson, and a second combination of tracks that could be associated with a second decay vertex in the same event. The successful reconstruction of two vertex candidates was followed by the reconstruction of a primary interaction vertex, particle identification cuts, and detachment cuts for the vertices relative to the primary vertex. The goal was to achieve low background levels for each decay mode using a minimum number of cuts.
The first step of the candidate-driven algorithm considers all pairs of two-, three-, and four-track combinations in an event. Each combination of tracks represents a possible decay. For each track the algorithm considers all possible combinations of charged K or assignments such that the assignments are consistent with the decay of a charged or neutral meson. A particular combination of tracks and the associated particle assignments is referred to as a candidate. The mass of each candidate is calculated using the measured track momenta, and is required to fall within a wide range of 1.6–2.4 . To select events with a and a , the kaons for the two candidates are required to have opposite charge.


The second step is vertex reconstruction. The goal is to find a pair of -decay vertices that can be associated with a primary interaction vertex, and to find all other tracks in the event that can be associated with that primary vertex. This part of the algorithm starts by performing a vertex fit for each candidate. The tracks for each candidate are required to form a vertex with confidence level greater than 1. Pairs of candidates that satisfy the confidence level cut are subjected to two additional vertex cuts. The first cut requires that the momentum vectors of the two candidates intersect with a confidence level greater than 1. The second cut rejects background by rejecting pairs of candidates for which the reconstructed daughter tracks for both candidates form a single vertex with confidence level greater than 0.1. This rejects background events in which tracks for both candidates all come from a common vertex. The final phase of the vertex reconstruction treats the two candidates as seed tracks to find the primary vertex. Vertex fits are performed by including the two seed tracks as well as combinations of all other tracks in the event. As many tracks as possible are added to the primary vertex as long as the confidence level is greater than 1.
Pairs of candidates that survive the vertex reconstruction are subjected to particle-identification cuts, which are based on measurements from three multicell threshold Čerenkov counters. The Čerenkov algorithm [17] calculates four likelihoods that correspond to the four hypotheses (electron, pion, kaon, proton) that are considered for each charged track. The algorithm produces a -like variable , where is the index used to represent each hypothesis. For the kaon in each candidate, we require that the kaon hypothesis is favored over the pion hypothesis by more than a factor of exp(0.5) by requiring . For the pions in each candidate we apply a pion consistency cut, which requires that no particle hypothesis is favored over the pion hypothesis with a greater than , where is the with the smallest value.
After applying particle-identification cuts, we impose cuts based on the significance of detachment () between each candidate and the primary vertex. We calculate by using the measured value of , the distance between the decay vertex and the primary vertex, and dividing by the associated error . The cuts for range from to depending on the decay mode, whether the -decay vertex is located between target elements (for which background levels are low) or in target material, and whether a candidate can be associated with a decay.


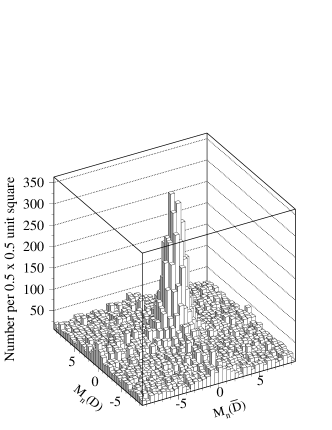
Figure 1a shows the signal that we obtain after all of the aforementioned cuts have been applied to the FOCUS data. Figure 1a shows the normalized invariant mass333The normalized mass, , is defined as the difference between the reconstructed mass and the central value of the or mass distribution divided by the reconstructed-mass error , which is calculated for each candidate. opposite the normalized invariant mass . Figure 1b shows a Gaussian fit to over a linear background after applying a background subtraction procedure that is used to determine the number of pairs of charmed mesons in the FOCUS data. The procedure consists of performing a sideband subtraction and fit for one normalized mass distribution by selecting entries in the signal and sideband regions of the other normalized mass distribution. In Fig. 1b we plot by assigning unit weight to candidates with a reconstructed mass in the signal region ( about the central value of the or mass of the candidate), and a weight of to candidates with mass in the two 4–8 sideband regions444An equivalent approach to determine the yield is a fit to after selecting signal and sideband regions for . Using this approach we obtain a yield of , which is consistent with the yield mentioned in the text.. The yield that we obtain from our fit is (statistical error).
In addition to our study of correlations between pairs of fully reconstructed mesons, we study correlations between two mesons where one is fully reconstructed and the other is kinematically tagged by a slow pion coming from the decay . In these decays, the need not be reconstructed, and therefore we refer to this sample of charmed mesons as partially reconstructed charm pairs555The partially reconstructed sample consists of , , , and pairs. . The reason for including this sample in our studies of correlations is that charm-pair correlations can be studied over a larger kinematic range compared to the fully reconstructed sample.
For partially reconstructed charm pair events [14] we begin by considering all two-, three-, and four-track combinations for the fully reconstructed (recoil ) in an event. We consider the decay modes , , , and charged-conjugate modes. A candidate-driven algorithm uses the recoil candidates to find the primary vertex, requiring the vertex confidence level to be greater than 1. The same Čerenkov particle identification criteria used for the fully reconstructed charm-pair sample (see above) are applied to the recoil candidates. However, a more restrictive detachment cut of is applied to all three decay modes in the partially reconstructed charm-pair sample. Figure 1c shows the invariant mass distribution, which includes all three decay modes, with a total of candidates satisfying the selection criteria.
The next step in the analysis treats each track that is assigned to the primary vertex (excluding the recoil ) as a slow-pion candidate from the decay . The momentum of the track is multiplied by 13.8 to approximate the momentum of the 666Due to the low value of the decay, the momentum of the soft pion approximates the momentum of the when multiplied by the inverse of its energy fraction, which is 13.8. . If the charge of the slow pion is the same as the charge of the kaon from the recoil , then the combination of the slow pion and recoil is designated as a right-sign combination. Otherwise, it is a wrong-sign combination. This assignment of right- and wrong-sign combinations is used for background subtraction.
A double subtraction method is used to reduce backgrounds. First, to handle non-charm background, a sideband subtraction is applied to recoil candidates. A Gaussian fit is applied to the invariant mass distribution for each of the three decay channels. Entries in the 4–8 sideband regions are subtracted from those in the peak region by using a weight factor of . Second, the assignment of right- and wrong-sign combinations is used to subtract wrong-sign background from right-sign combinations. To avoid distortion of the wrong-sign background we exclude all slow-pion candidates that can be associated with a decay involving the recoil . This anti- cut is imposed by excluding combinations of slow pions and recoil -mesons that have a mass difference, , in the range 0.142–0.149 . To further enhance the selection procedure, a maximum cut of 4 (GeV/)2 is applied to , where and are transverse momentum components of the recoil and slow pion, respectively. This cut enhances the selection of signal since genuine events balance (see reference [14] for more details). This is shown in Fig. 1d, which shows a prominent excess of right-sign combinations close to compared to the wrong-sign background. After applying the double subtraction and the cut, we obtain a sample of partially-reconstructed charm pairs.
3 correlations
For our study of correlations between pairs of fully reconstructed mesons, we compare FOCUS data to predictions from a Monte Carlo based on the Lund Model. The Monte Carlo consists of a Pythia 6.203 [15] generator with default settings, and detector simulation algorithms for the FOCUS apparatus. The Monte Carlo generator produces charm events using a tree-level photon-gluon fusion process applied to beam photons and target nucleons. We use default options for charm photoproduction in the generator (instead of using a Monte Carlo tuned to match our data) to facilitate comparisons with theoretical predictions and results from other experiments. In this paper, we also compare our results to previously published charm photoproduction results from experiment E687 [14].


To improve comparisons between data and model predictions based on photon-gluon fusion, we eliminate our lowest multiplicity events by requiring a minimum number of particles assigned to the primary interaction vertex. We define as the number of particles assigned to the primary vertex. With this definition, has a minimum value of two since it includes the and mesons (each charm meson counts as a single particle) in addition to charged tracks assigned to the primary vertex. To eliminate our lowest multiplicity events we require an cut. The cut eliminates features observed in data that are not present in Pythia 6.203. This is illustrated in Fig. 2a, which shows the background-subtracted777The background subtraction procedure assigns unit weight to candidates in the signal region in Fig. 1a ( about the center of the distribution), a weight of to candidates in the single and single sidebands (four regions defined as about the axis and 4–8 about the axis, and about the axis and 4–8 about the axis), and a weight of to candidates in the four regions where both the and candidates are 4–8 away from the center of the distribution. The weight factor of accounts for the over-subtraction of the single- and single- backgrounds and the subtraction of random combinatoric background. invariant mass for mass combinations with a net charge of zero ( and ) for FOCUS data, and for Pythia events that have passed through a software simulation of the FOCUS detector and have survived the event selection procedure described earlier in this paper. The mass distribution has an enhancement near threshold that is not present in Pythia. This enhancement is evident for events with , especially when we apply additional cuts that remove events with energy deposited in electromagnetic calorimeters (see inset in Fig. 2a). The enhancement seems to arise from the diffractive production of decaying to , and will be the subject of a future paper (additional information can be found in conference proceedings [18]). Another significant difference between data and Pythia is shown in Figs. 2a and 2b. This is the excess of events in data compared to Pythia, some of which can be attributed to the production of . By eliminating events, we get fairly good agreement for the distribution in Fig. 2b, which shows the histogram for Pythia (solid line) normalized to the number of pairs in the data (data points with error bars) with . By eliminating the bin the agreement between data and Pythia is significantly improved (a slight excess of events with persists in the data).
Previous studies [7, 8, 9, 10, 11, 12, 13, 14] of charm-pair correlations have presented distributions for , the transverse momentum squared of the pair, and , the azimuthal angle between the and momentum vectors in the plane transverse to the beam direction. These distributions are significant, since and radians in leading-order QCD, where the charm-quark pair is produced back-to-back. In QCD these distributions are broadened by NLO corrections and non-perturbative effects, as illustrated in references [3] and [4]. Photoproduction results from E687 [14] have been compared to results from NLO calculations [1] and Pythia version 5.6 [19]. The E687 comparisons between data and Pythia 5.6 are reproduced in Figs. 2c and 2d, but with a different normalization to match FOCUS data (shown as open circles with error bars). The figures show good agreement between FOCUS and E687 data, and a significant discrepancy between data and Pythia 5.6.
Agreement between FOCUS data and the more recent Pythia 6.203 is significantly better, but minor discrepancies persist. Figure 3 shows comparisons for , , rapidity difference defined as = , and invariant mass, . FOCUS data are plotted as data points with error bars. Pythia parent distributions (dashed lines) are shown without acceptance or resolution effects, so that parent distributions can be compared to the distributions that are obtained for Monte Carlo events that have survived detector simulation, event selection and analysis cuts (solid histograms).
Figure 3a shows good agreement for . There is an enhancement in the first bin, which is not present in Pythia and may suggest the presence of an additional production mechanism. There is good agreement for in Fig. 3b, except that the data tend to have slightly larger values of . Compared to Pythia 5.6, the agreement between data and Pythia 6.203 for and is significantly better. Some of the improvement can be attributed to a larger value for the intrinsic transverse momentum of the incoming partons, referred to as the kick888A value of = was introduced with Pythia version 6.135, while previous versions had a value of = , but a number of other Pythia modifications that affect these distributions have also occurred over time. Figure 3c shows fairly good agreement for 999The agreement between data and Pythia improves slightly for mesons with larger values of , however a more restrictive cut also reduces the number of charm-pair events that are available for correlation studies., but also shows significant acceptance losses for (acceptance losses are less severe in the partially reconstructed charm-pair sample). Acceptance losses are also significant for large values of in Fig. 3d, but here there is a discrepancy between data and Pythia for smaller values of where the acceptance is good.
Figure 4 shows results for the partially reconstructed charm-pair sample, comparing data (asterisks with error bars) to Pythia 6.203 (solid lines). For (see Fig. 4a) we also include a comparison to the distribution that we obtain for fully reconstructed charm pairs after accounting for resolution broadening effects101010The distribution for the fully-reconstructed sample is obtained by taking the momentum vector of the or in an event and treating it as the momentum of a that decays isotropically to a and a pion. The pion momentum vector is then used to determine as is done in the analysis of partially reconstructed charm pair events.. This shows that the two samples are in agreement, and that the enhancement that we observe in the first bin for fully reconstructed charm pairs (see Fig. 3a) disappears due to resolution broadening and selection cuts applied to the partially reconstructed charm-pair sample. Figures 4a and 4b are both affected by resolution broadening (the effects are reproduced by our Monte Carlo), and the agreement between data and Pythia 6.203 is good. As before, the data tend to have slightly larger values of .
In Figs. 4c and 4d we show results for and , and include Pythia parent distributions (dashed lines) to show how acceptance losses in this sample compare to acceptance losses in the fully-reconstructed sample (see Fig. 3). The partially reconstructed charm pairs are less affected by acceptance losses, and thus extend the kinematic range of our correlation studies. The distributions in Fig. 4c show good agreement, while the distributions in Fig. 4d exhibit a mismatch between data and Pythia that is similar to the mismatch that is observed in Fig. 3d.
4 Conclusions
We have extracted two large samples of photoproduced charm-pair events for studies of correlations between and mesons. The first sample consists of more than 7000 fully reconstructed pairs. The second sample consists of over partially reconstructed charm pairs, where one meson is fully reconstructed and the other is tagged by a slow pion coming from a decay. For the fully reconstructed sample we impose an cut to eliminate our lowest multiplicity events, while the partially reconstructed sample has an implicit cut of due to the presence of the slow pion. The significance of the cut is that it improves our comparisons to model predictions based on photon-gluon fusion by eliminating low multiplicity events in which we observe the production of decaying to pairs. The events, which are not included in Pythia, appear to be produced diffractively, and will be the subject of a future paper.
The FOCUS results on charm-pair correlations presented in this paper are in good agreement with previous measurements from experiment E687, which displayed significant discrepancies compared to an older version of Pythia (version 5.6). Comparisons of FOCUS data to a more recent version of Pythia (version 6.203) are significantly better, due to changes in parameters that affect the modeling of photon-gluon fusion. One notable change that improves the agreement with data is that the intrinsic transverse momentum () of incoming partons was increased from = to = . Although minor discrepancies persist when FOCUS data are compared to Pythia, the modeling of heavy quark photoproduction is fairly good for correlations between and mesons.
5 Acknowledgments
We wish to acknowledge the assistance of the staffs of Fermi National Accelerator Laboratory, the INFN of Italy, and the physics departments of the collaborating institutions. This research was supported in part by the U. S. National Science Foundation, the U. S. Department of Energy, the Italian Istituto Nazionale di Fisica Nucleare and Ministero dell’Istruzione dell’Università e della Ricerca, the Brazilian Conselho Nacional de Desenvolvimento Científico e Tecnológico, CONACyT-México, and the Korea Research Foundation of the Korean Ministry of Education.
References
- [1] S. Frixione, M.L. Mangano, P. Nason, and G. Ridolfi, Adv. Ser. Direct. High Energy Phys. 15 (1998) 609 [arXiv:hep-ph/9702287].
- [2] S. Frixione, M.L. Mangano, P. Nason, and G. Ridolfi, Nucl. Phys. B 431 (1994) 453.
- [3] S. Frixione, M.L. Mangano, P. Nason, and G. Ridolfi, Nucl. Phys. B 412 (1994) 225.
- [4] M. Mangano, P. Nason, and G. Ridolfi, Nucl. Phys. B 405 (1993) 507.
- [5] M. Mangano, P. Nason, and G. Ridolfi, Nucl. Phys. B 373 (1992) 295.
- [6] P. Nason, S. Dawson, and R.K. Ellis, Nucl. Phys. B 327 (1989) 49.
- [7] E791 Collaboration, E.M. Aitala et al., EPJdirect C4 (1999) 1.
- [8] WA92 Collaboration, M. Adamovich et al., Phys. Lett. B 385 (1996) 487.
- [9] E653 Collaboration, K. Kodama et al., Phys. Lett. B 263 (1991) 579.
- [10] NA32 Collaboration, S. Barlag et al., Phys. Lett. B 257 (1991) 519; Phys. Lett. B 302 (1993) 112.
- [11] WA75 Collaboration, S. Aoki et al., Phys. Lett. B 209 (1988) 113; Prog. Theor. Phys. 87 (1992) 1315.
- [12] NA27 Collaboration, M. Aguilar-Benitez et al., Z. Phys. C40 (1988) 321; Phys. Lett. B 164 (1985) 404.
- [13] NA14 Collaboration, M.P. Alvarez et al., Phys. Lett. B 278 (1992) 385.
- [14] E687 Collaboration, P.L. Frabetti et al., Phys. Lett. B 308 (1993) 193.
- [15] Pythia 6.203, T. Sjöstrand et al., Comput. Phys. Commun. 135 (2001) 238.
- [16] P.L. Frabetti et al., Nucl. Instr. Meth., A 320 (1992) 519.
- [17] FOCUS Collaboration, J.M. Link et al., Nucl. Instr. Meth., A 484 (2002) 270.
- [18] FOCUS Collaboration, E. Gottschalk et al., FERMILAB-CONF-02-279-E, to be published in the proceedings of the International Conference on High Energy Physics Amsterdam, ICHEP, 24–31 July 2002.
- [19] Pythia 5.6 and Jetset 7.3, T. Sjöstrand et al., Comput. Phys. Commun. 82 (1994) 74.