Measurement of : experimental procedures and baryon resonance analysis
Abstract
The cross section for the reaction was measured in the resonance region for 1.4W2.1 GeV and 0.51.5 GeV2/c2 using the CLAS detector at Jefferson Laboratory. The data show resonant structures not visible in previous experiments. The comparison of our data to a phenomenological prediction using available information on and states shows an evident discrepancy. A better description of the data is obtained either by a sizeable change of the properties of the (1720) resonance or by introducing a new baryon state, not reported in published analyses.
pacs:
13.60.Le, 13.40.Gp, 14.20.GkElectromagnetic excitation of nucleon resonances is sensitive to the spin and spatial structure of the transition, which in turn is connected to fundamental properties of baryon structure, like spin-flavor symmetries, confinement, and effective degrees of freedom. In the mass region above 1.6 GeV, many overlapping baryon states are present, and some of them are not well known; measurement of the transition form factors of these states is important for our understanding of the internal dynamics of baryons. Many of these high-mass excited states tend to decouple from the single-meson channels and to decay predominantly into multi-pion channels, such as or , leading to final states Pdg96 . Moreover, quark models with approximate (or “broken”) SU(6)O(3) symmetry Kon80 ; Gia90 predict more states than have been found experimentally; QCD mixing effects could decouple these unobserved states from the pion-nucleon channel Kon80 while strongly coupling them to two-pion channels Kon80 ; Cap94 ; Sta93 . These states would therefore not be observable in reactions with in the initial or final state. Other models, with different symmetry properties and a reduced number of degrees of freedom, as e.g. in ref. Kir97 , predict fewer states. Experimental searches for at least some of the “missing” states predicted by the symmetric quark models, which are not predicted by models using alternative symmetries, are crucial in discriminating between these models. Electromagnetic amplitudes for some missing states are predicted to be sizeable Kon80 as well. Therefore, exclusive double-pion electroproduction is a fundamental tool in measuring poorly known states and possibly observing new ones.
In this paper we report a measurement of the reaction studied with the CEBAF Large Acceptance Spectrometer (CLAS) at Jefferson Lab. CLAS consists of a six-coil superconducting magnet producing an approximately toroidal magnetic field, allowing detection of electrons and hadrons and full 4-momentum recontruction. Three sets of drift chambers allow the determination of the momenta of the charged particles with polar angles from 10o to 140o. A complete coverage of scintillators allows the discrimination of particles by a time-of-flight technique described in ref. Smi99 . The magnetic field was set to bent positive particles outwards, away from the primary beam. We analyzed data taken in the so-called ’e1c’ running period, corresponding to about two months of data taking in the spring of 1999. Beam currents of a few nA were delivered to Hall B on a liquid-hydrogen target, corresponding to luminosities up to cm-2s-1. The beam energies selected for this analysis were: 2.567 GeV at a torus current of 1500 A (’low’ field), with the goal of obtaining two bins, between 0.5 and 0.8 and between 0.8 and 1.1 , with up to 1.9 GeV; 4.247 GeV at a field of 2250 A (’low’ field), to obtain between 1.1 and 1.5 , with up to 2.1 GeV. Important features of the CLAS Bro99 are its large kinematic coverage for multi-charged-particle final states and its good momentum resolution (1%). Using an inclusive electron trigger, many exclusive hadronic final states were measured simultaneously. Scattered electrons were identified through cuts on the calorimeter energy loss and the Cerenkov photo-electron distribution. Different channels were separated through particle identification using time-of-flight information and other kinematic cuts.
The hardware trigger in CLAS was based on a coincidence between Cherenkov counter and electromagnetic forward calorimeter. The discriminator threshold in the Cherenkov was put at a signal level of less than a single photoelectron produced on the photocathode, to avoid losing good events while rejecting most of the pion background. The energy threshold in the calorimeter was set to cut off events as close as possible to the kinematic edges of the W and Q2 domain covered by the measurement, but sufficiently high to keep the low energy contamination due to hadronically interacting particles at a reasonable limit. A cut on the energy deposited in the calorimeter was applied to eliminate part of the remaining pion background, mostly due to knock-off electrons giving a signal in the Cherenkov counter. We studied the effect of this cut on the electron detection efficiency, deriving a correction that was applied to the data. The Cherenkov efficiency was also studied by means of the shape of the photoelectron distribution in each module. This way, we evaluated the effect of a cut on the photoelectron number on the electron detection efficiency on each single Cherenkov module, as well as the module-to-module uniformity, deriving the appropriate corrections to be applied to the data.
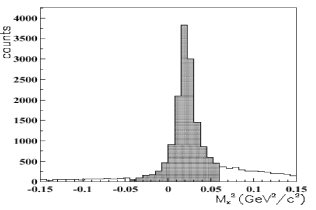
Another cut was applied in the versus momentum plot, to select pions and protons in the reaction analyzed. All Time of Flight (ToF) scintillator paddles were carefully inspected to make sure that the cut applied was appropriate for all of them. To identify the final state, we used the missing-mass technique, requiring detection in CLAS of at least . The good resolution allowed selection of the exclusive final state, . After applying all cuts, our data sample included about two-pion events. Fig. 1 shows the missing mass distribution obtained from CLAS, together with the applied cut. The tail at higher mass is due to radiative effects and to multiple pion production.
In order to check the stability of CLAS in the detection of different reactions, we defined a set of histograms representing various reaction yields, i.e. electron inclusive, electron-proton inclusive, electron elastic (W cut), electron-proton elastic (W plus - correlation cut), electron-proton from the (W cut) and finally electron-proton- with a cut on the missing , each single yield being normalised to the Faraday cup charge obtained from the so called “live-gated” signal, where the signal from the Faraday cup is only integrated during the live-time: this way, the charge is already corrected for the data acquisition dead-time. Such normalised yields were calculated, using the PID procedures described in the previous subsection, for each data file inside a run (a run being typically a data taking over a period of an hour), therefore providing a very accurate monitoring of stability even inside a single run. “Good files” were selected requiring that the normalised yield for a single file should not deviate more than a few percent from the average. Subsequent analysis was performed only on the good files.
To obtain the cross section from the raw data, it is necessary to correct for detector non-uniformity, which has origin both in the geometry and in the response of the equipment to different particles. The geometrical and kinematic non-uniformity can be very well described by means of fiducial cuts that describe regions of the detector where the response of the various subsystems is well known. Fiducial cuts will eliminate dead regions like the torus coils in the first place. The detector response inside the fiducial regions was simulated using a GEANT-based representation of the detector containing a detailed description of particle interaction with the various subsystems. To evaluate all detector corrections, we divided the particle yield into kinematic bins defined through a complete set of independent kinematic variables of the hadronic state, plus and . This corresponds to binning all four-momenta of the particles involved (with the exception of the electron, for which no binning is applied to azimuthal angle for symmetry reasons). This way, the folding of the detector response to the cross sections is done in narrow kinematic regions, where the cross section variation will be limited. The dependence of the results on the assumed particle distributions will therefore be much reduced. However, events still have to be generated according to a realistic Monte Carlo, in order to minimize the model dependence of acceptance and efficiency.
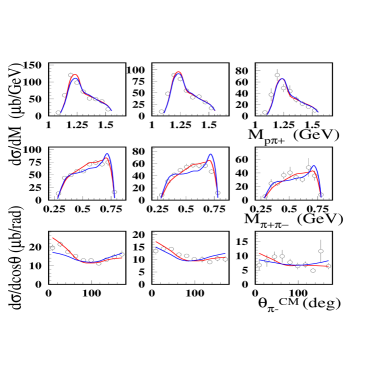
The event generator used for simulations in this experiment contains several electroproduction cross sections, including single, double and triple pion electroproduction. The code relies on cross section tables that describe measured total and differential cross sections from the literature, scaled by a virtual photon flux and a dipole form factor to provide a reasonable fall off with . Therefore our code gives a realistic description of cross sections and their relative weights, as well as backgrounds generated from competing channels. Radiative effects were also included in the simulation. As an example of how the Monte Carlo reproduces the main features seen in the data, we reproduce here the comparison of some kinematic distributions from the data at 2.567 GeV beam energy, 1500 A field, with the corresponding simulation. As specific example we report the case of the bin 1.6-1.625 GeV, and between 0.5 and 0.8 GeV2/c2. Figure 2 shows the invariant mass distribution for the pion-pion pair. Figure 3 shows the invariant mass distribution for the proton- pair. Figure 4 shows the CM angle of the pair (which would correspond to the CM angle of a in the specific case that a is produced).


A particularly important issue regards the percentage of events lost in the binning process due to bins with zero acceptance: of course, for such bins it is not possible to correct the data and obtain a cross section; being the kinematic variable space multidimensional in the case of double pion production, extrapolating the cross sections from neighboring bins with non-zero acceptance to bins with zero acceptance can be unreliable. Therefore, we checked carefully, using our realistic Monte Carlo, the percentage of cross section lost because of bins with zero acceptance. It turned out that with the adopted binning, the percentage of unmeasured cross section in bins with vanishing acceptance was below 10 % and typically of the order of a few percent. Actually, the fact that a cell has zero acceptance or efficiency may be just connected to insufficient statistics in the simulation, as many cells end up with very few generated events; nevertheless, for those cells it is not possible to perform a correction to the data. To get the final cross sections, we therefore performed an extrapolation to the empty bins using the MonteCarlo distributions as an estimate of the missing cross section. This extrapolation is typically only a few percent and we quoted as systematic error a quantity equal to one half of the extrapolation, assuming that the extrapolated cross section may be wrong by plus or minus 50 %, due to the assumptions in the MonteCarlo.
The range of invariant hadronic center-of-mass (CM) energy (in 25 MeV bins) was 1.4-1.9 GeV for the first two bins in the invariant momentum transfer , 0.5-0.8 (GeV/c)2 and 0.8-1.1 (GeV/c)2, and 1.4-2.1 GeV for the highest bin, 1.1-1.5 (GeV/c)2. Following the procedures schematically described above, data were corrected for acceptance, reconstruction efficiency, radiative effects, and empty target counts. They were further binned in the following set of hadronic CM variables: invariant mass of the pair (10 bins), invariant mass of the pair (10 bins), polar angle (10 bins), azimuthal angle (5 bins), and rotation freedom of the pair with respect to the hadronic plane (5 bins). The fully differential cross section is of the form:
| (1) |
| (2) |
where is the virtual photon flux, is the virtual photon cross section, is the fine structure constant, is the electron beam energy, is the proton mass, and is the virtual photon transverse polarization Ama89 .


Since existing theoretical models Ose00 are limited to 1.6 GeV, we have employed a phenomenological calculation Mok01 for a first interpretation of the data. This model describes the reaction in the kinematic range of interest as a sum of amplitudes for and , while all other possible mechanisms are parameterized as phase space. A detailed treatment was developed for the non-resonant contributions to , while for production they were described through a diffractive ansatz. For the resonant part, a total of 12 states, classified as 4∗ Pdg96 , with sizeable and/or decays, were included based on a Breit-Wigner ansatz. A few model parameters in non-resonant production were fitted to CLAS data at high , where the non-resonant part creates a forward peaking in the angular distributions, and kept fixed in the subsequent analysis. The phase between resonant and non-resonant mechanisms was fitted to the CLAS data as well. To simplify the fits, we reduced eqn. (1) to three single-differential cross sections, , , and , by integrating over the other hadronic variables. These three 1-D distributions were then fitted simultaneously. Here and are both connected with the dominant production reaction, while is connected with production. For each and bin, a total of 26 data points from the three single-differential cross sections were used in our fits. The two edge points in both the and mass distributions were excluded as the model did not take into account the kinematic smearing in the versus plot caused by the bin width.
The physics analysis included the following steps: (A) We produced reference curves using the available information on the and resonances in 1.2-2 GeV mass range. Discrepancies between the CLAS data and our calculation were observed, which led to the subsequent steps B and C. (B) Data around =1.7 GeV were fitted using the known resonances in the PDG but allowing the resonance parameters to vary in a number of ways. The best fit, corresponding to a prominent partial wave, could be attributed to the PDG (1720) resonance, but with parameters significantly modified from the PDG values. (C) As an alternative description, we introduced a new baryon state around 1.7 GeV. In what follows we describe each of the steps above in more detail.
Step (A) - To produce our reference curves, the evolution of the and electromagnetic couplings for the states was taken either from parameterizations of existing data Bur94 , or from Single Quark Transition Model (SQTM) fits Bur94 where no data were available. For the (1440) (Roper), given the scarce available data, the amplitude was taken from a Non-Relativistic Quark Model (NRQM) Clo90 . Partial decay widths were taken from a previous analysis of hadronic data Man92 and renormalized to the total widths from Ref. Pdg96 . Results from step (A) are reported in Figs. 5 to 9 for the specific one-dimensional differential cross sections analysed and for a sample of bins. In Fig. 10 (left), we report the total cross section data and the corresponding curves from step (A). As demonstrated by the plots, our calculation, even without performing any adjustment of the resonance parameters, is able to give a good accounting of the main features of the data in a wide and region. The total cross section strength for 1.65 GeV (except for the region close to threshold), and for 1.8 GeV is well reproduced. However, a strong discrepancy is evident at around 1.7 GeV. Moreover, at this energy the reference curve exhibits a strong peak in the invariant mass (Fig. 10, right), connected to sizeable meson production. This contribution was traced back to the 70-91% branching ratio of the (1720) into this channel Pdg96 ; Man92 ; Dyt00 .
Step (B) - We then considered whether the observed discrepancy around 1.7 GeV could be accomodated by varying the electromagnetic excitation of one or more of the PDG states. In our code, interference effects between continuum and resonances like those reported in Ref. Ose00 , are taken into account automatically inside the model frame Mok01 . Therefore, our investigation at this stage was including the possibility of accounting for the 1.7 GeV structure via interference effects, although the peaking of such an interference pattern at the same for all bins would be rather surprising. All fit values were calculated from the 8 bins between 1.64 and 1.81 GeV and from the 3 bins (624 data points). The number of free parameters ranged from 11 to 32, depending on the fit, corresponding to =613 to 592 degrees of freedom. Assuming the resonance properties given by the PDG, the bump at about =1.7 GeV cannot be due to the (1675), (1680), or (1700) states; the first because its well known position cannot match the peak; the second because of its well known position and photocouplings Bur01 ; the third due to its large width (300 MeV). The remaining possibilities from the PDG are the (1700), the (1720), and the (1710) (the latter was not included in step (A)), as there are no data available on the dependence of or Bur01 . If no configuration mixing occurs, the (1700) cannot be excited in the SQTM from proton targets, while the SQTM prediction for the (1720) relies on ad hoc assumptions. According to the literature Pdg96 ; Man92 ; Dyt00 , hadronic couplings of the (1700) and the total width of the (1710) are poorly known, while the (1720) hadronic parameters should be better established. Several other partial waves were investigated in step (C).
| M (MeV) | (MeV) | (%) | (%) | |
| PDG (B) | 172520 | 11419 | 6312 | 199 |
| PDG Pdg96 | 1650-1750 | 100-200 | N/A | 70-85 |
| new (C) | 172020 | 8817 | 4113 | 1710 |
To improve our reference curves before fitting the bump at around 1.7 GeV, the following steps were carried out: the (1440) strength was fitted to our low W data; the (1675) and the (1700) photocouplings (which vanish in the SQTM) were replaced by NRQM values from Ref. Clo90 ; an empirically established SQTM fitting uncertainty or NRQM uncertainty of 10 or 20% () was applied to all states; the hadronic parameters were allowed to vary for the (1700) according to Ref. Man92 ; and finally, the curves providing the best were selected as the starting points. First we performed three fits, (B1), (B2), and (B3), where the photocouplings of only one resonance at a time were varied. In (B1), we varied A1/2, A3/2, hadronic couplings, and position of the D13(1700) in a wide range. In (B2), the same was done for the P13(1720), and in (B3) for the P11(1710). In both fits (B2) and (B3), we also varied the hadronic parameters and the position of the D13(1700) over a range consistent with their large uncertainties from Ref. Man92 . Fits (B1) and (B3) gave a poor description of the data, with =5.2 and 4.3, respectively. The best fit ( =3.4) was obtained in (B2) (Fig. 11). However, the resulting values for the branching fractions of the P13(1720) were significantly different from previous analyses reported in the literature and well outside the reported errors Pdg96 ; Man92 ; Dyt00 . Starting from (B3), we then performed a final fit, (B4), for which the (1720) hadronic couplings were fixed from the literature, and varying the photocouplings of all three candidate states, D13(1700), P13(1720), and (1710), by 100% (). No better solution was found, the being 4.3 (Fig. 11). In Fig. 12 we report the final comparison of fits (B2) and (B4) with the total cross section data.
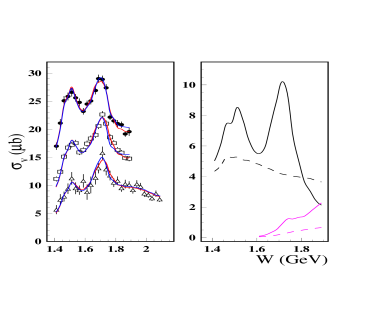
Table 1 shows our results (first row) with statistical uncertainties, in comparison with the PDG values (second row). Our fits were not providing an unambigous separation of , , and the longitudinal , so we report as result the total photocoupling strength, . The resulting value for the (1720) fit is reported in the first three rows of Table 2. The errors reflect the statistical uncertainties in the data and the correlations among the different resonances.
As discussed above, fitting the data around 1.7 GeV with established baryon states leads either to a poor fit or to a drastic change in resonance parameters with respect to published results. In the framework of our analysis, there is no way to assess the reliability of the previously determined hadronic parameters of the PDG (1720). The resonant content of the reaction , which is used to obtain the hadronic parameters, may be different from that of reactions initiated by an electromagnetic probe. In particular, the (1720) state seen in may not be excited in electroproduction, while some other state that decouples from may be excited electromagnetically. This possibility is studied in the next step.
| step | ||
| (GeV/c)2 | () | |
| B2 | 0.65 | 835 |
| B2 | 0.95 | 638 |
| B2 | 1.30 | 4527 |
| C | 0.65 | 769 |
| C | 0.95 | 547 |
| C | 1.30 | 4118 |
Step (C) - We investigated whether our data could be fitted by including another baryon state, while keeping the hadronic parameters of the (1720) as in Refs. Pdg96 ; Man92 . The quantum numbers ,,,,, , were tested on an equal footing, where /2 is the isospin, undetermined in our measurement. We then simultaneously varied the photocouplings and the hadronic parameters of the new state and the (1700). The total decay width of the new state was varied in the range of 40-600 MeV, while its position was varied from 1.68-1.76 GeV. The best fit (=3.3) was obtained with a state, while keeping the (1720) hadronic parameters at published values. Other partial waves gave a 4.2. Curves obtained from the best fit were nearly identical with the red solid lines in Figs. 11 and 12. In order to avoid the unobserved production peak (Fig. 10, right), the photocouplings of the PDG (1720) had to be reduced by about a factor of two with respect to the SQTM prediction, making its contribution very small. Instead, in this fit the main contribution to the bump came from the new state. Resonance parameters and total photocoupling value obtained from the assumed new state are reported in Table 1 (last row) and 2 (last 3 rows), respectively.
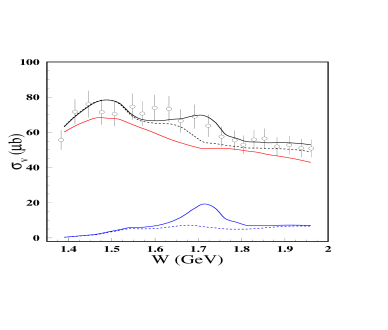
At this point, one could wonder whether a similar discrepancy between the calculation and the data is present in the real photon case, and whether introduction of a new state is compatible with the existing real photon data as well. To this purpose, we reproduce in Fig. 13 the old data from Ref. ABB68 , together with curves obtained from our model. The red solid curve in the graph represents the overall contribution from the non-resonant processes, while the blue dashed line corresponds the resonant contribution only, without introducing any new state. The black dashed line shows the result of our model when including both non-resonant and resonant processes, without new states. Finally, the black solid curve shows our fit of the real photon data when introducing a new state, and the blue solid curve shows the corresponding modification in the pure resonant excitation curve. The photocouplings of the new (1720) state were determined extrapolating the values obtained from the CLAS experiment with virtual photons. An additional adjustment, within 10 %, was applied to reproduce the invariant mass distributions of the pairs and , measured at =1.7 GeV ABB68 . It is clear how, due to the stronger dominance of the non-resonant mechanisms at the photon point, as well as due to the particular interference effects, a new state can be accomodated into the picture. In fact, the agreement between data and our calculation is even improved by the introduction of the new state.
A second state was indeed predicted in Ref. Cap94 , with a mass of 1870 MeV, and in Ref. Gia01 , with a mass of 1816 MeV. The presence of a new three-quark state with the same quantum numbers as the conventional (1720) in the same mass range would likely lead to strong mixing. However, as mentioned above, a different isospin and/or partial wave cannot be excluded. The new state may also have a different internal structure, such as a hybrid baryon with excited glue components. Such a hybrid state is predicted in the flux tube model Pag00 . Finally, in Ref. Wal03 the existence of a pentaquark () configuration with a mass in the range 1.76-1.78 GeV is predicted. Yet another possibility is that some resonance parameters established in previous analyses may have much larger uncertainties than reported in the literature. In this case, outlined in our step (B), our analysis would establish new, more precise parameters for a known state, and invalidate previous results.
In conclusion, in this paper we presented data on the reaction in a wide kinematic range, with higher quality than any previous double pion production experiment. Our phenomenological calculations using existing PDG parameters provided a poor agreement with the new data at 1700 MeV. We explored two alternative interpretations of the data. If we dismiss previously established hadronic parameters for the (1720) we can fit the data with a state having the same spin/parity/isospin but strongly different hadronic couplings from the PDG state. If, alternatively, we introduce a new state in addition to the PDG state with about the same mass, spin , and positive parity, a good fit is obtained for a state having a rather narrow width, a strong coupling, and a small coupling, while keeping the PDG (1720) hadronic parameters at published values. In either case we determined the total photocoupling at . A simultaneous analysis of single and double-pion processes provides more constraints and may help discriminate better between alternative interpretations of the observed resonance structure in the CLAS data. Such an effort is currently underway.
We would like to acknowledge the outstanding efforts of the staff of the Accelerator and the Physics Divisions at JLab that made this experiment possible. This work was supported in part by the Istituto Nazionale di Fisica Nucleare, the U.S. Department of Energy and National Science Foundation, the French Commissariat à l’Energie Atomique, and the Korea Science and Engineering Foundation. U. Thoma acknowledges an “Emmy Noether” grant from the Deutsche Forschungsgemeinschaft. The Southeastern Universities Research Association (SURA) operates the Thomas Jefferson National Accelerator Facility for the United States Department of Energy under contract DE-AC05-84ER40150.
References
- (1) D.E. Groom et al., Eur. Phys. J C 15, 1 (2000).
- (2) R. Koniuk and N. Isgur, Phys. Rev. Lett. 44, 845 (1980); Phys. Rev. D21, 1868 (1980).
- (3) M.M. Giannini, Rep. Prog. Phys. 54, 453 (1991).
- (4) S. Capstick, W. Roberts, Phys. Rev. D49, 4570 (1994).
- (5) F. Stancu and P Stassart, Phys. Rev. D47, 2140 (1993).
- (6) M. Kirchbach, Mod.Phys.Lett. A12, 3177 (1997).
- (7) E. Smith et al., Nucl. Instr. and Meth. A432, 165 (1999).
- (8) B. Mecking et al., accepted for publication in: Nucl. Inst. and Meth. A; W. Brooks, Proc. of PANIC ’99, Uppsala, Sweden, 10-16 June 1999, Nucl. Phys. A 663&664, 29c (2000).
- (9) E. Amaldi, S. Fubini, and G. Furlan, Pion Electroproduction, Springer Tracts in Modern Physics 83 (1989).
- (10) V. Eckart et al., Nucl. Phys. B55, 45 (1973); P. Joos et al., Phys. Lett. B52, 481 (1974); K. Wacker et al., Nucl. Phys. B144, 269 (1978).
- (11) J.C. Nacher and E. Oset, Nucl. Phys. A674, 205 (2000).
- (12) M. Ripani et al., Nucl. Phys. A672, 220 (2000); V. Mokeev et al., Phys. of Atomic Nucl. 64, 1292 (2001); V. Mokeev et al., to be published in Phys. of Atomic Nucl.
- (13) V.D. Burkert, Czech. Journ. of Phys. 46, 627 (1996).
- (14) F. Close and Z.P. Li, Phys. Rev. D42, 2194 (1990).
- (15) D.M. Manley, E.M. Saleski, Phys. Rev. D45, 4002 (1992).
- (16) T.P. Vrana et al., Phys. Rept. 328, 181 (2000).
- (17) V. Burkert, Nucl. Phys. A684, 16c (2001).
- (18) ABBHHM collaboration, Phys. Rev. 175, 1669 (1968).
- (19) M.M. Giannini et al., Eur. Phys. J. A12, 447 (2001).
- (20) S. Capstick, P. Page, Phys. Rev. C66, 065204 (2002).
- (21) H. Walliser, V.B. Kopeliovich., hep-ph/0304058.