15 April 2003 UCD-EXPH/030401
hep-ex/0304023
![[Uncaptioned image]](/html/hep-ex/0304023/assets/x1.png)
Electroweak Precision Data
Global Higgs Analysis
Martin W. Grünewald
Department of Experimental Physics
University College Dublin
Belfield, Dublin 4
Ireland
Abstract
The status of published and preliminary precision electroweak measurements as of winter 2002/03 is presented. The new results on the mass of the W boson as measured at LEP-2 and on atomic parity violation in Caesium are included. The experimental results are compared with the predictions of the minimal Standard Model and are used to constrain its parameters, including the mass of the Higgs boson. The agreement between measurements and expectations from theory is discussed.
Invited talk presented at the Mini-Workshop
“ELECTROWEAK PRECISION DATA AND THE HIGGS MASS”
DESY Zeuthen, Germany, February 28th to March 1st, 2003
Electroweak Precision Data - Global Higgs Analysis
Martin W. Grünewald
Department of Experimental Physics,
University College Dublin,
Belfield, Dublin 4,
Ireland
Abstract
The status of published and preliminary precision electroweak measurements as of winter 2002/03 is presented. The new results on the mass of the W boson as measured at LEP-2 and on atomic parity violation in Caesium are included. The experimental results are compared with the predictions of the minimal Standard Model and are used to constrain its parameters, including the mass of the Higgs boson. The agreement between measurements and expectations from theory is discussed.
1 Introduction
On the level of realistic observables such as measured cross sections, ratios and asymmetries, the set of electroweak precision data, all obtained within the last 15 years, consists of over thousand measurements with partially correlated statistical and systematic uncertainties. This large set of results is reduced to a more manageable set of twenty precision so-called pseudo observables in a largely model-independent procedure, allowing for tests of the Standard Model (SM) and other theories of nature at the fundamental level.
About 2/3 of all pseudo observables arise from measurements performed in electron-positron collisions at the Z pole, by the SLC experiment SLD and the four LEP experiments ALEPH, DELPHI, L3 and OPAL. The Z-pole observables are: 5 observables describing the Z lineshape and leptonic forward-backward asymmetries, 2 observables describing polarised leptonic asymmetries measured by SLD with polarised beams and at LEP exploiting tau polarisation, 6 observables describing b-quark and c-quark pair production at the Z pole, and the inclusive hadronic charge asymmetry. The six remaining measurements are: the mass and total width of the W boson measured by the TEVATRON experiments CDF and DØ and the four LEP-2 experiments, the top quark mass measured at the TEVATRON, the neutrino-nucleon scattering cross section ratio as measured by NuTeV, atomic parity violation in Caesium, and the hadronic vacuum polarisation at the Z pole. Also, “constants” such as the Fermi constant are used.
2 Atomic Parity Violation
The interaction between an electron and the atomic nucleus receives a parity-violating contribution due to /Z interference. The weak charge, , of the nucleus is measured:
| (2.1) |
with for in the limit of zero momentum transfer. Thus is defined simply as the sum of the weak charges of up- and down-quark in a nucleus containing protons and neutrons and thus up-quarks and down-quarks. Therefore, the raw measurement must be corrected for nuclear many-body effects and QED radiative corrections. The most precise measurement is performed for Caesium [3]. Recent progress in QED self-energy and vertex radiative corrections to order and results in a significant shift in the experimental result for ; the new result [3]:
| (2.2) |
is now in perfect agreement with the SM expectation.
3 Neutrino Nucleon Scattering
The NuTeV collaboration studies -channel neutrino-nucleon scattering at an average momentum transfer of , analysing both charged current (CC) and neutral current (NC) reactions. Using both a neutrino and an anti-neutrino beam with high statistics, it is possible to exploit the Paschos-Wolfenstein relation [4]:
| (3.1) |
where the sum runs over the valence quarks, u and d. This relation holds for iso-scalar targets and up to small electroweak radiative corrections. In the ideal case this measurement is insensitive to the effects of sea quarks, which cancel. Charm production, uncertain due to charm mass effects, enters only through CC scattering off valence d quarks, a CKM suppressed process. Using beams, CC reactions are discriminated from NC reactions by the presence of a primary in the final state.
Assuming , NuTeV’s final results reads [5]:
where the first error is statistical and the second is systematic. NuTeV’s final result is still statistics limited. The result is in excellent agreement with the previous world average [6] but differs by 2.9 standard deviations from the prediction of the global SM analysis presented in Section 7. Further details on NuTeV’s measurement are given in [7].
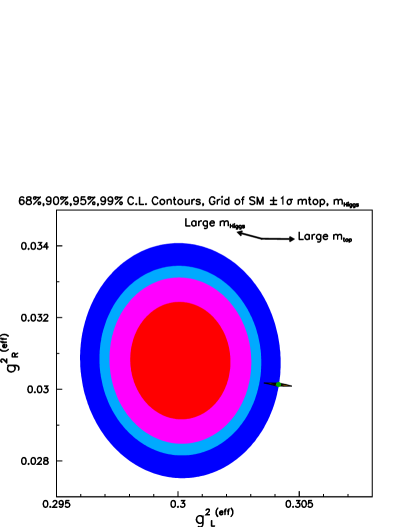
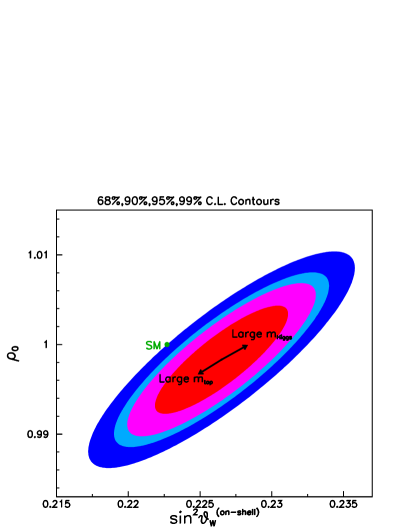
When quoting the result in terms of , as done historically, it must be assumed that . In a more flexible ansatz allowing model-independent interpretations, the NuTeV result is also presented in terms of effective left- and right-handed couplings, shown in Figure 1 (left) and defined as: for . Here the deviation is confined to the effective left-handed coupling product. Modifying all parameters by a scale factor shows that either or the mixing angle, but not both, could be in agreement with the SM, as visible in Figure 1 (right). Assuming the electroweak mixing angle to have it’s expected value, the change in the factors can be absorbed in , i.e., interpreted as a change in the coupling strength of neutrinos, then lower than expected by about . A similar trend is observed with the neutrino coupling as measured by the invisible width of the Z boson at LEP-1, yielding a smaller and less significant deficit of in . Various explanations besides being a statistical fluctuation, have been put forward and reviewed at this workshop, ranging from old and new physics effects, but it seems none is able to explain the result naturally [7, 8].
4 Mass of the Top Quark
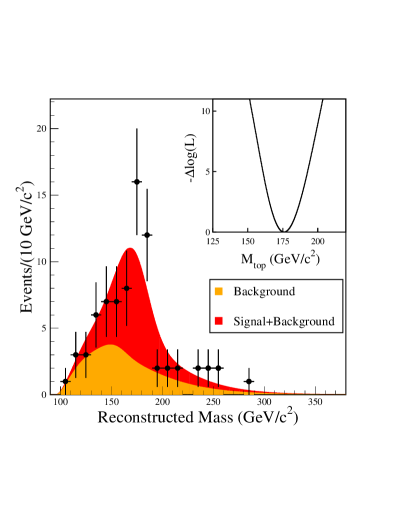
In 1995, the TEVATRON experiments CDF and DØ discovered the top quark in proton-antiproton collisions at centre-of-mass energy, by observing the reaction . Depending on the decay modes of the two W bosons, the event signatures are two b-jets plus either di-leptons, lepton plus jets, or all jets. The distribution of the reconstructed top-quark mass as measured by CDF is shown in Figure 2 (left). The results published based on data collected in Run-I are combined taking correlated systematic uncertainties into account [9]:
| (4.1) |
The DØ collaboration has recently presented a new preliminary Run-I based result in the lepton-plus-jets channel, which has a reduced uncertainty and a central value a few GeV higher than that of their previous analysis in this channel entering the above average [10].
The systematic uncertainties are dominated by the jet energy scale (2 to depending on channel), which will reduce with more data. Signal and background modelling, including hard matrix elements, parton distribution functions and MC generators account for a smaller part. Top-quark mass measurements with an uncertainty of less than are expected from the ongoing TEVATRON Run-II.
5 Mass and Width of the W boson
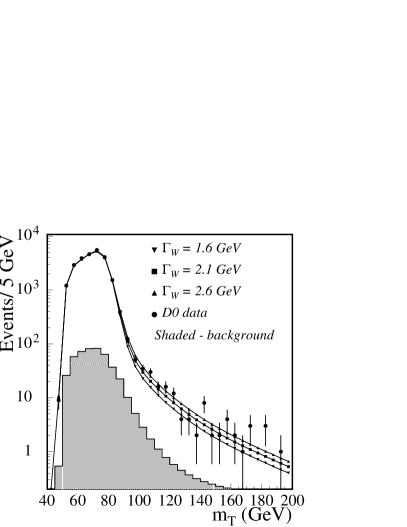
Until 1996, the W boson mass and width was measured at hadron colliders only, most recently by the experiments CDF and DØ. Leptonic W decays with electrons and muons are selected and reconstructed. The transverse mass, i.e., the invariant mass of the lepton and the missing momentum vector in the plane transverse to the beam axis is unaffected by the unknown longitudinal boost of the W boson and bounded from above by the invariant mass of the decaying W boson. The distribution of the transverse mass as measured by DØ is shown in Figure 2 (right). The sharp upper edge of the so called Jacobian peak yields the mass of the W boson, while the W-boson width is derived from the high-mass tail of this distribution. Final results on and from CDF and DØ are now available for the complete Run-I data set. They are combined taking correlations properly into account [11].
The uncertainties on both mass and width of the W boson are dominated by the limited data statistics. The largest systematic uncertainty arises from the energy measurement of the leptons, and this energy scale uncertainty will also reduce with more data. The signal model, parton distribution functions, gluon radiation and QED corrections in leptonic W decays are less important. Further details on the measurement of at hadron colliders are given in [12]. W-boson mass measurements with an uncertainty of less than are expected from the ongoing TEVATRON Run-II.
Since 1996 the W boson mass and width is also measured at LEP-2 using events. Four-fermion final states are selected and the two decaying W bosons are reconstructed. For hadronic and semileptonic W-pair events, the W-pair kinematic is completely reconstructed so that one directly measures the invariant masses of the decaying W bosons. These results are preliminary.
For hadronic W-pair events, , cross talk effects may occur between the two hadronic systems. The four-momentum exchange causes the mass of the decaying W bosons to be different from the measured mass of the hadronic decay products, thus leading to potentially large systematic effects. Because of these large additional uncertainties compared to the semileptonic channel, now bounded by studies based on data, the weight of the four jet channel in the LEP average is less than 10%. The difference in mass obtained for hadronic and semileptonic W-pair events, calculated without FSI uncertainties, is , i.e., showing no bias. Further details on the LEP measurements are given in [13].
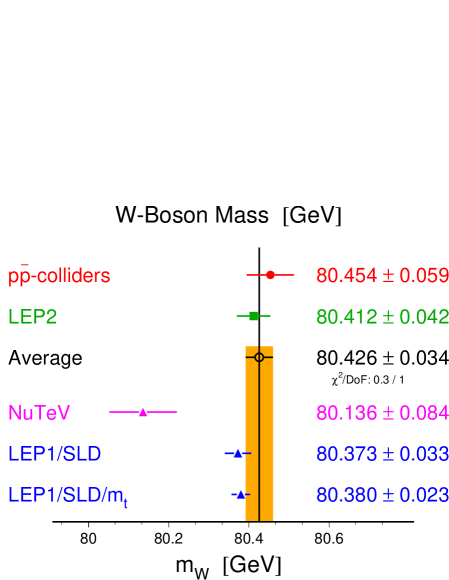
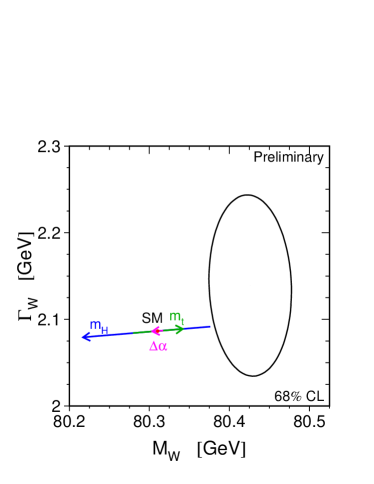
The results of the TEVATRON and LEP experiments on the mass of the W boson are in very good agreement as shown in Figure 3 (left). The combined results and their correlation is shown in Figure 3 (right). It can be seen that the W mass is highly sensitive to SM parameters, in particular preferring a low value for the mass of the Higgs boson.
6 Z-Boson Physics
In the previous decade, electron-positron annihilations at high energies have allowed to measure precisely a wealth of electroweak observables related to Z-boson couplings to fermion-antifermion pairs. These measurements are performed by the SLC experiment SLD, and the LEP experiments ALEPH, DELPHI, L3 and OPAL.
6.1 Z Lineshape and Leptonic F/B Asymmetries
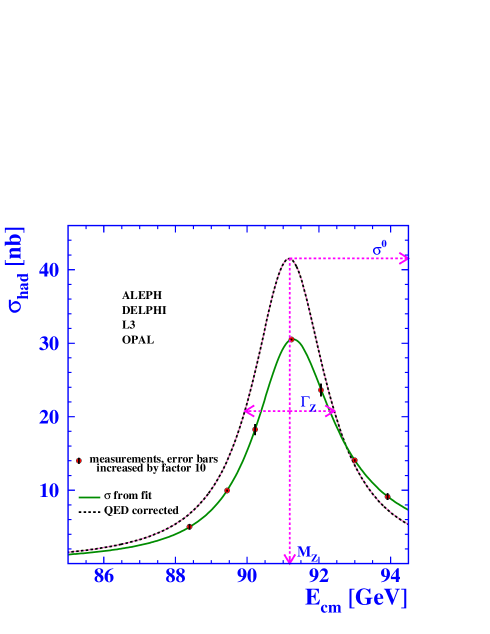
The total cross section for hadron production as a function of the centre-of-mass energy in the vicinity of the Z pole is shown in Figure 4 (right), comparing the measured cross sections with those deconvoluted of QED effects which have to be known precisely. The per degrees of freedom are: 169/176 (ALEPH), 177/168 (DELPHI), 158/166 (L3), 155/194 (OPAL), and 36.5/31 for the LEP combination, showing very good agreement when reducing the hundreds of measurements to the few pseudo observables. Assuming lepton universality, the final results are [14]:
| (6.1) |
The comparison of the measurements of and is shown in Figure 5 (left).
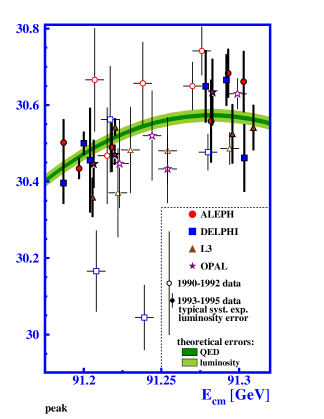
The number of neutrinos, , is about 1.9 standard deviations smaller than three. The uncertainty on is given by:
| (6.2) |
where is the uncertainty on the number of hadronic (leptonic) events, is the uncertainty on any absolute cross section measurement such as that arising from the luminosity determination, and denotes addition in quadrature. Thus, the theoretical luminosity uncertainty of 0.06% [15] causes an uncertainty of on .

6.2 Leptonic Polarisation Asymmetries
In terms of the effective vector and axial-vector coupling constants, and , the asymmetry parameter is defined as:
| (6.3) |
The leptonic asymmetry parameter is measured by SLD [16] and at LEP-1 in various processes. Assuming lepton universality, well supported by the experimental results, the following final results are obtained when combining the experiments:
| (6.4) | |||||
| (6.5) | |||||
| (6.6) |
showing good agreement, and with a combined value of:
| (6.7) |
The measurement of the polarisation as a function of polar scattering angle is shown in Figure 5 (right), where the LEP combination shows a per degree of freedom of 4.7/7. For backward scattering, zero polarisation is expected and observed.
6.3 Heavy Flavour Results at the Z Pole
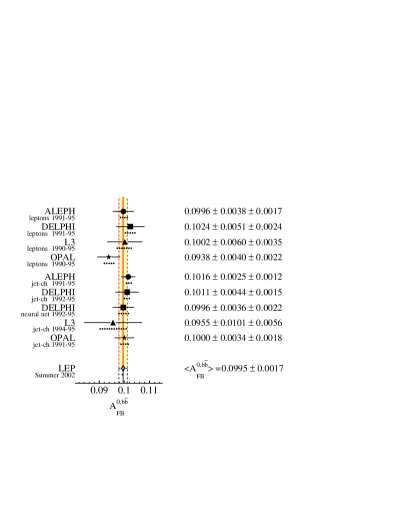
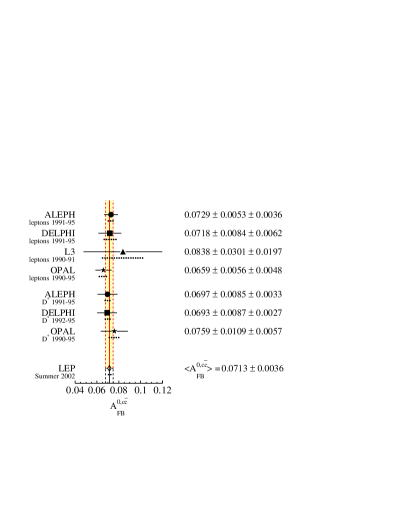
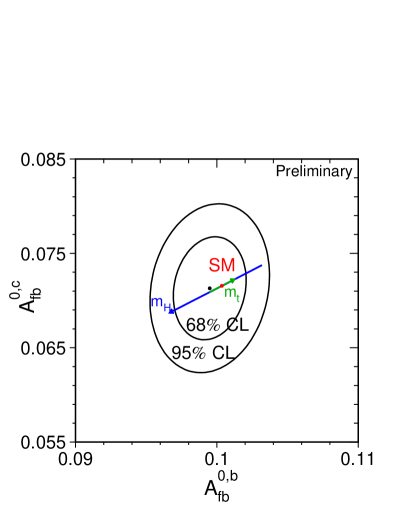
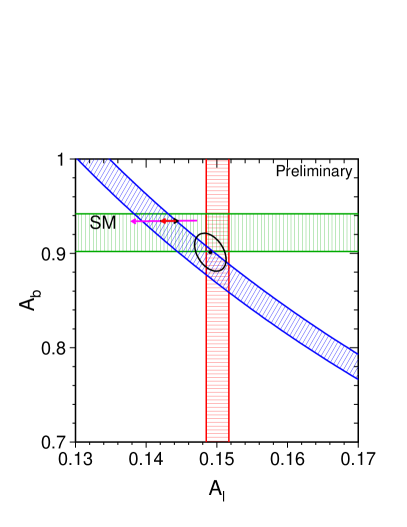
While the results on b- and c-quark production rates () are final, several measurements of heavy-flavour asymmetries by SLD and at LEP are still preliminary, and thus is the joint combination of all heavy flavour results. Details on the various heavy-flavour measurements at the Z pole are given in [17, 18]. The combination has a rather low of 47.6 for degrees of freedom: all forward-backward asymmetries are very consistent, as shown in Figure 6, and their combination is still statistics limited. The combined values for and are compared to the SM expectation in Figure 7 (left), showing that agrees well with the SM expectation for an intermediate Higgs-boson mass of a few hundred .
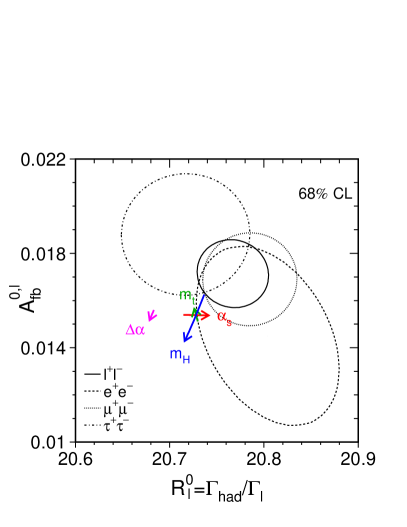
The mutual consistency of the measurements of , and assuming lepton universality is shown in Figure 7 (right). Compared to the experimental uncertainties, the SM predictions are nearly constant in , in contrast to the situation for . This is a consequence of the SM values of electric charge and iso-spin of quarks.
6.4 Effective Electroweak Mixing Angle
Assuming the SM structure of the effective coupling constants, the measurements of the various asymmetries are compared in terms of in Figure 8 (left). The average of all six determinations is:
| (6.8) |
with a of 10.2/5, corresponding to a probability of 7.0%. The enlarged is solely driven by the two most precise determinations of , namely those derived from the measurements of by SLD, dominated by the left-right asymmetry result, and of at LEP. These two measurements differ by 2.9 standard deviations. This is a consequence of the same effect as shown in Figure 7 (right).
7 Global Standard Model Analysis
Within the framework of the SM, each pseudo observable presented above is calculated as a function of five main relevant parameters, which are the running electromagnetic and strong coupling constant evaluated at the Z pole, and , and the masses of Z boson, top quark and Higgs boson, , , . Using the Fermi constant allows to calculate the mass of the W boson. The electromagnetic coupling is represented by the hadronic vacuum polarisation , as it is this contribution which has the largest uncertainty.


The precision of the Z-pole measurements require matching precision of the theoretical calculations, first and second order electroweak and QCD corrections etc. The dependence on and enters through radiative corrections. The predictions as a function of the five SM parameters are calculated with the computer programs TOPAZ0 [19] and ZFITTER [20], which incorporate state-of-the-art calculations, constraining the hadronic vacuum polarisation to: [21].
Using the Z-pole measurements of SLD and LEP-1 in order to evaluate electroweak radiative corrections, the masses of two heavy particles measured at the TEVATRON and at LEP-2, namely the top quark and the W boson, can be predicted. The resulting 68% C.L. contour curve in the plane is shown in Figure 8 (right). Also shown is the contour curve corresponding to the direct measurements of both quantities at the TEVATRON and at LEP-2. The two contour curves overlap, successfully testing the SM at the level of electroweak radiative corrections. The diagonal band in Figure 8 (right) shows the constraint between the two masses within the SM, which depends on the mass of the Higgs boson, and to a small extent also on the hadronic vacuum polarisation (small arrow labelled ). Both the direct and the indirect contour curves prefer a low value for the mass of the SM Higgs boson.
The best constraint on is obtained by analysing all data. This joint fit has a of 25.5 for 15 degrees of freedom, corresponding to a probability of 4.4%. The pulls of the 20 measurements entering the fit are shown in Figure 9 (left). The single largest contribution to the , about 9 units, arises from the NuTeV measurement of the on-shell electroweak mixing angle. Excluding the NuTeV measurement, the becomes 16.7/14, corresponding to 27.3%, while the fitted parameters in terms of central value and error are almost unchanged, showing that the fit is robust against the NuTeV result. The second largest pull arises from the measurement as discussed above.

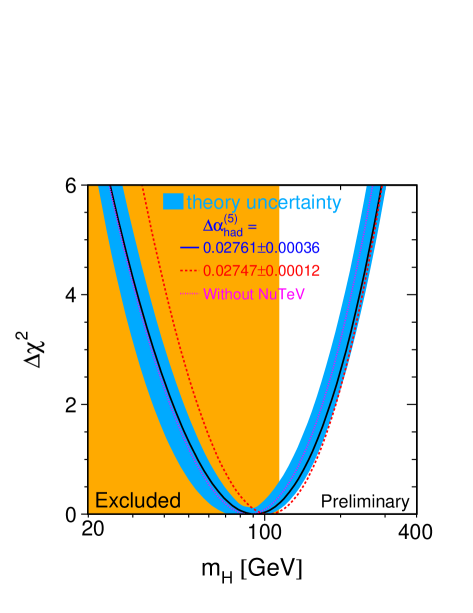
The global fit yields , which corresponds to a one-sided upper limit at 95% C.L. on of including the theory uncertainty as shown in Figure 9 (left). The fitted is strongly correlated with the hadronic vacuum polarisation (correlation of ) and the fitted top-quark mass (). The strong correlation with implies a shift of 35% in the predicted if the measurement of changes by one standard deviation (). Thus a precise experimental measurement of is very important.
Also shown are the curves obtained with the theory-driven, thus more precise evaluation of the hadronic vacuum polarisation [22], yielding also a reduced correlation of with , or excluding the NuTeV result. Both analyses yield nearly the same upper limits on . In case the measurement with the second largest pull, , is removed, the 95% C.L. upper limit on reduces to including the theory uncertainty. The theoretical uncertainty on the SM calculations of the observables is visualised as the thickness of the blue band. It is dominated by the theoretical uncertainty in the calculation of the effective electroweak mixing angle, where a two-loop calculation is needed.
The shaded part in Figure 9 (left) shows the range up to excluded by the direct search for the Higgs boson at 95% confidence level. Even though the minimum of the curve lies in the excluded region, the uncertainties on the Higgs mass value are such as that the results are well compatible. Further discussions are presented in [23].
8 Caveats: Low Higgs-Boson masses
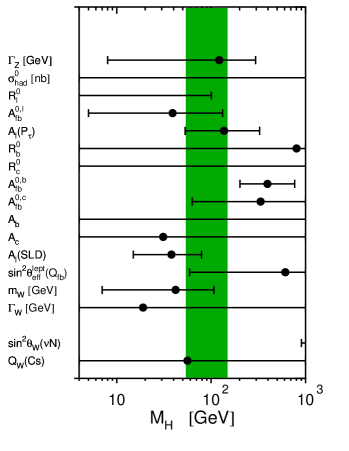
The measurement of a pseudo observable may also be interpreted as a constraint on the mass of the Higgs boson. In order to evaluate this constraint, a full five-parameter Standard-Model fit is performed, constraining the four SM input parameter besides as follows: , , and . The resulting constraints are shown in Figure 10 (left).
However, care must be taken when interpreting results quantitatively in the region of low values of the Higgs mass. Neither the experimental analyses extracting the pseudo observables from the raw data, nor the SM calculation of the predictions take into account the real Higgs-strahlungs process . This effect can be quite sizeable: the fraction of real Higgs-strahlung, , is shown in Figure 10 (right), ranging up to 1% for very low Higgs masses [24].
If all decay modes were selected as hadronic events, then the measured total and hadronic width would increase by the amount . This increase would lead to an increase of in the fitted value in analyses neglecting to consider . The requirement that the shift in should be less than a 10% of the fitted error on forces . Since also the other fit parameters are unaffected, this does not pose a problem. The specific heavy-flavour analyses may also be affected. The maximal effect is observed if all decay modes are tagged a b-quark events. Then is increased by the same amount as , and is changed. This is most visible in a shift of : . The requirement that this shift is less than 10% of the experimental error on forces . The reconstruction of at LEP-2 is probably not affected. However, in addition the effect of is centre-of-mass energy dependent. While the global SM fit is valid for the central value of and upper errors, quantitative statements in the low-Higgs mass regime remain dubious. A fully correct treatment would require experimental efficiencies and corrections for as a function of which are not available. In any case, the limit from the direct search for the Higgs boson of at 95% confidence level [25] is sufficiently high.

9 Conclusions
During the last 15 years many experiments at both hadron and lepton collider have performed a wealth of measurements with unprecedented precision in high-energy particle physics. These measurements test all aspects of the SM of particle physics, and many of them show large sensitivity to electroweak radiative corrections at loop level.
Most measurements agree with the expectations as calculated within the framework of the SM, successfully testing the SM at Born and at loop level. Still there are two “2.9 standard deviations effects”, namely the spread in the various determinations of the effective electroweak mixing angle, within the SM analysis apparently disfavouring the measurement of , and NuTeV’s result, most pronounced when interpreted in terms of the on-shell electroweak mixing angle.
The validity of any pseudo-observable analysis rests on the assumption that the effects of real Higgs production (or that of any non-SM final state) must be negligible.
For the future, precise theoretical calculations including theoretical uncertainties [18, 26] are needed, in particular a two-loop calculation for the effective electroweak mixing angle. Experimentally, the next few years will bring improvements in the measurements of W and top masses, and the long-awaited discovery of the Higgs boson.
Acknowledgements
It is a pleasure to thank my colleagues of the TEVATRON and LEP electroweak working groups, members of the NuTeV, SLD, ALEPH, DELPHI, L3, OPAL, CDF and DØ experiments, as well as D. Bardin, G. Passarino and G. Weiglein for valuable discussions.
References
- [1] The LEP Electro-Weak Working Group (EWWG), hep-ex/0212036 and winter 2002/03 update LEPEWWG/2003-01, http://www.cern.ch/LEPEWWG.
- [2] F. Jegerlehner, these proceedings.
- [3] C.S. Wood et al., Science 275 (1997) 1759; M.Y. Kuchiev, J.Phys. B35 (2002) 503.
- [4] E. Paschos, L. Wolfenstein, PRD 7 (1973) 91.
- [5] G.P. Zeller et al., PRL 88 (2002) 091802.
- [6] K.S. McFarland, proceedings 28th ICHEP, Warsaw, Poland (1996); M. Goncharov et al., PRD 64 (2001) 112006.
- [7] K.S. McFarland, these proceedings.
- [8] S. Moch, these proceedings.
- [9] Review of Particle Properties 2002, PRD, Vol.66, No.1., 010001.
- [10] J. Estrada, talk on behalf of the DØ collaboration, HCP02 - 14th Topical Conference On Hadron Collider Physics, Karlsruhe, Germany, September 2002, hep-ex/0302031.
- [11] Tevatron Electroweak Working Group and the CDF and DØ Collaborations, CDF Note 5888, DØ Note 3963, FERMILAB-FN-0716, July 2002.
- [12] U. Baur, these proceedings.
- [13] R. Hawkings, these proceedings.
- [14] The LEP Collaborations and the LEP EWWG, hep-ex/0101027.
- [15] S. Jadach, these proceedings.
- [16] M. Swartz, these proceedings.
- [17] P. Wells, these proceedings.
- [18] W. van Neerven, these proceedings.
- [19] G. Passarino et al., CPC 117 (1999) 278.
- [20] D. Bardin et al., CPC 133 (2001) 229.
- [21] H. Burkhardt, B. Pietrzyk, PLB 513 (2001) 46.
- [22] J.F. de Troconiz, F.J. Yndurain, PRD 65 (2002) 093002
- [23] M. Chanowitz, these proceedings.
- [24] Z Physics at LEP 1, CERN yellow report 89-08, Vol.2, p.6.
- [25] The LEP Collaborations and the LEP HWG, CERN-EP/2003-011, subm. to PLB.
- [26] W. Hollik, these proceedings; G. Passarino, these proceedings; G. Weiglein, these proceedings.