AS-TEXONO/03-03
Effective Dynamic Range in Measurements
with Flash Analog-to-Digital Convertor
Q. Yuea,b,
W.P. Laic,d,
W.C. Changc,
H.B. Lic,
J. Lia,b,c,
S.T. Linc,
D.Z. Liub,
J.F. Qiua,
V. Singhc,
H.T. Wongc,***Corresponding author:
Email: htwong@phys.sinica.edu.tw;
Tel:+886-2-2789-6789;
FAX:+886-2-2788-9828.
aInstitute of High Energy Physics, Beijing 100039, China.
bDepartment of Engineering Physics, Tsing Hua University, Beijing 100084, China
cInstitute of Physics, Academia Sinica, Taipei 115, Taiwan.
dDepartment of Management Information Systems, Chung Kuo Institute of Technology,
Hsin-Chu 303, Taiwan.
Abstract
Flash Analog to Digital Convertor (FADC) is frequently used in nuclear and particle physics experiments, often as the major component in big multi-channel systems. The large data volume makes the optimization of operating parameters necessary. This article reports a study of a method to extend the dynamic range of an 8-bit FADC from the nominal value. By comparing the integrated pulse area with that of a reference profile, good energy reconstruction and event identification can be achieved on saturated events from CsI(Tl) crystal scintillators. The effective dynamic range can be extended by at least 4 more bits. The algorithm is generic and is expected to be applicable to other detector systems with FADC readout.
PACS Codes: 07.05.Kf, 07.05.Pj, 07.50.Qx
Keywords: Data analysis, Image Processing, Electronics
( Submitted to Nucl. Instrum. Methods A )
1 Introduction
With the advance of electronics, data acquisition (DAQ) and computing capabilities, it is more and more common to use Flash Analog to Digital Convertors (FADCs) as the general-purpose readout device for different detectors. Typically, the entire pulse shape from the individual detector module, as well as the relative timing between pulses from different detector channels, are recorded. Such readout scheme replaces Analog Digital Convertors and Time-to-Digital Convertors, which give information only on the amplitude or integrated area and the timing of the pulses, respectively.
With FADCs as readout, the information related to a single pulse is represented by many measurements. Frequently, multi-channel (order of hundreds and thousands is common) FADC systems are deployed. As a result, a large volume of data have to be extracted, stored and processed. The n-bit resolution per time-bin and the sampling rate of the FADC are important parameters which will have tremendous effect on the characterization and performance of the experiment such as detector resolution, DAQ dead time, data size, data processing time, cost and so on.
A motivated question to address is therefore “What is the dynamic range of an n-bit FADC, beyond the nominal value?” That is, can the crucial information like the total area as well as the rise and fall times be reconstructed, even though part of the pulse the largest and usually the most important part is not recorded? These are the focuses of investigation of this article.
In Section 2, we describe the research program on which this project is based, and the hardware used to generate the data which allow such an investigation. Two approaches are surveyed and compared. One of the algorithms, the Charge Summation Correction Method, showed better potentials and were pursued in depth. The goals are to achieve both energy reconstruction and particle identification even for saturated events. The details and results are discussed in Section 3.
Though the algorithm was developed and tested with scintillating CsI(Tl) crystal detectors, the approach is generic and can be applicable to other detector schemes using FADC readout as well.
2 Scintillating CsI(Tl) Crystal Detector
The present investigation is part of the research program of the TEXONO Collaboration [1]. A CsI(Tl) scintillating crystal [2] array with 2 kg modular mass and a total mass of 186 kg is taking data at the Kuo-Sheng (KS) Nuclear Power Plant to study low energy neutrino physics. Each module is read out by two photo-multipliers (PMTs) and the signals are recorded by a 20 MHz FADCs with 8-bit resolution [3]. The FADC value at the time-bin is denoted by . Throughout this work, we use the normalized value which is divided by the saturation level : .
The physics requirements of the experiment are that events with energy from 10 keV to 10 MeV can be reconstructed, and that pulse shape discrimination (PSD) can be applied to these events to achieve event (/) identification. That is, a dynamic range of at least 1000 is necessary with an 8-bit resolution readout per time-bin.
Special data were taken to devise techniques and to develop software algorithms addressing this issue. A CsI(Tl) crystal was used and signals were read out by a single PMT and a FADC channel at identical settings to the KS experiment. The trigger was set at the FADC time-bin, such that the pulse information of =5 s (100 time-bins) and =25.6s (512 time-bins) before and after the trigger were recorded, respectively. Both and events were taken by activating the CsI(Tl) crystal with 241Am-Be and 137Cs sources, respectively.
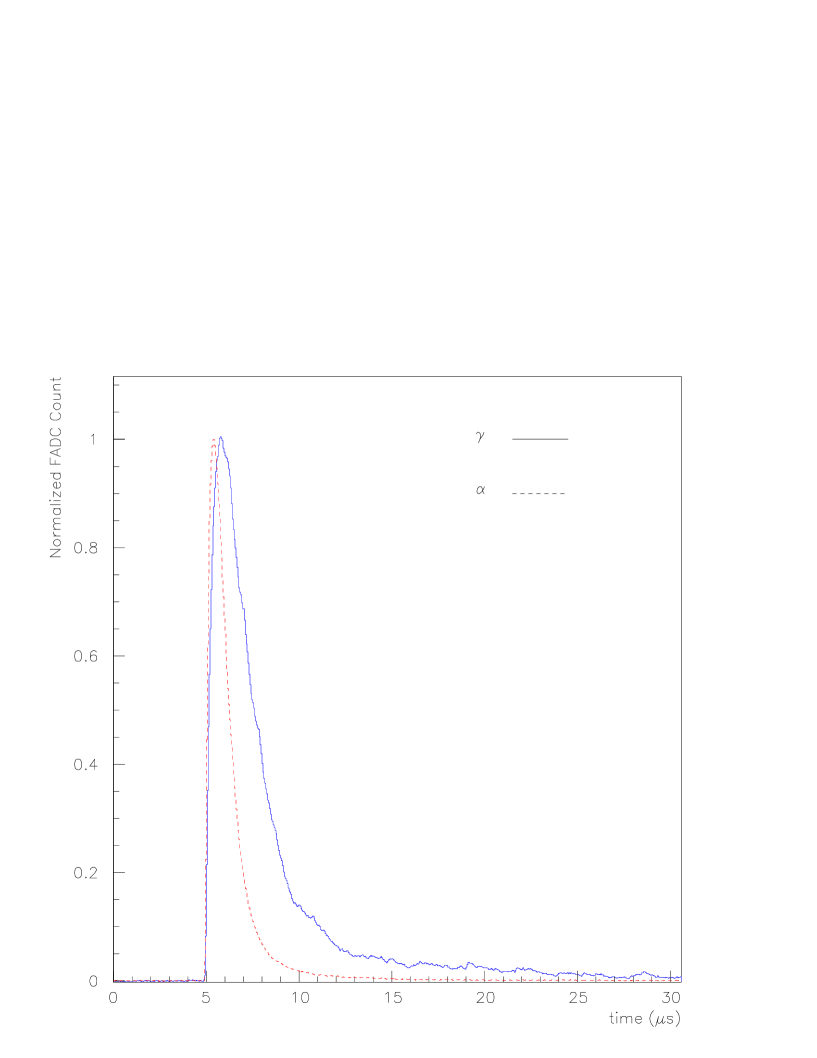
The amplitude of the pulse was adjusted by selecting the appropriate PMT high voltage. Typical unsaturated and saturated pulses are displayed in Figures 1a and 1b, respectively. A large sample of unsaturated events are added together to produce a smooth reference pulse shape (t), where the peak amplitude is normalized to 1. The profiles of (t) due to - and -events are depicted in Figure 2, and can be fitted to the function [2]
| (1) |
The rise time() and fall times() as well as the ratio between the slow and fast decay components(r) are listed in Table 1. The normalization constant N is chosen to make the peak amplitude equal to unity. The values of are dominated by the electronics shaping rise time of 250 ns [3], while () are due to the characteristic fluorescence time profile of CsI(Tl).
The integrated charge (Q) of an event is obtained by numerically integrating the pedestal-subtracted FADC pulses:
| (2) |
where is the average pedestal level determined from the pre-trigger part () of the pulse, and . The typical full-width-half-maximum (FWHM) resolution for unsaturated events at 662 keV is about 8%.
3 Charge Summation Method
3.1 Initial Survey
Saturated events are those with pulse amplitude larger than those corresponding to the maximum FADC value of . The focus of this section is to devise an algorithm with which energy reconstruction and event identification by PSD can be achieved for these class of events.
Two approaches were surveyed as initial studies:
-
1.
Statistical Approach In principle, one can derive the values of N in Equation 1, using maximum likelihood analysis or minimum fitting methods, based only on the (,) data where . The values of are adopted from those in Table 1. In practice, the fits are computer-time consuming and unstable. The efficiencies are bad, especially when the saturation is severe. The main reason is that the values of and are derived from small portions of the pulse shape. When the data from these portions are missing due to saturation, there will be insufficient constraints such that it is difficult for the analysis procedures to converge to the optimal values for N.
-
2.
Pulse Analysis Approach The objective of this approach is to identify measure-able values which are related to the physics variables of interest, namely, the total energy and the decay time. The observables are the “saturated charge” and “mean time”. This method uses all the available information from the saturated pulses. Such an approach can be compared to and in fact inspired by the “Double Charge Method” [4] commonly-used to achieve / identification in liquid [5] and crystal [2] scintillators.
Results of the initial surveys indicated that the pulse analysis approach would show better promises. The “Charge Summation Method” based on this approach was therefore pursued in details. We discuss the algorithm, its consistency checks and performance in energy reconstruction and event identification in the following sub-sections.
3.2 Reference Profile and Correction Function
From a standard reference pulse shape, a relationship is obtained between the “saturated charge ()” defined by the integration of the saturated events and the “total charge ()” from that of the raw fully-recorded pulses.
The saturation level for an n=8-bit FADC is . To investigate the saturation effects on a pulse shape with amplitude , a profile is constructed from the reference shape of Figure 2, scaled-up by a factor of of /. Therefore, the value at the time-bin is given by
| (3) |
The pedestal level is the average of for . The dependence of the total and saturated charge as functions of for -events can be defined as:
| (4) |
and
| (5) |
respectively. That is, given the profile with peak amplitude /, and are the integrated areas of the complete pulse and the pulse truncated at a maximum amplitude of , respectively. By varying the values of , the dependence of and on for - and -events can be derived. They are depicted in Figure 3a and 3b, respectively. As expected, the variations shows a linear relationship between and , while would level off at large due to saturation.
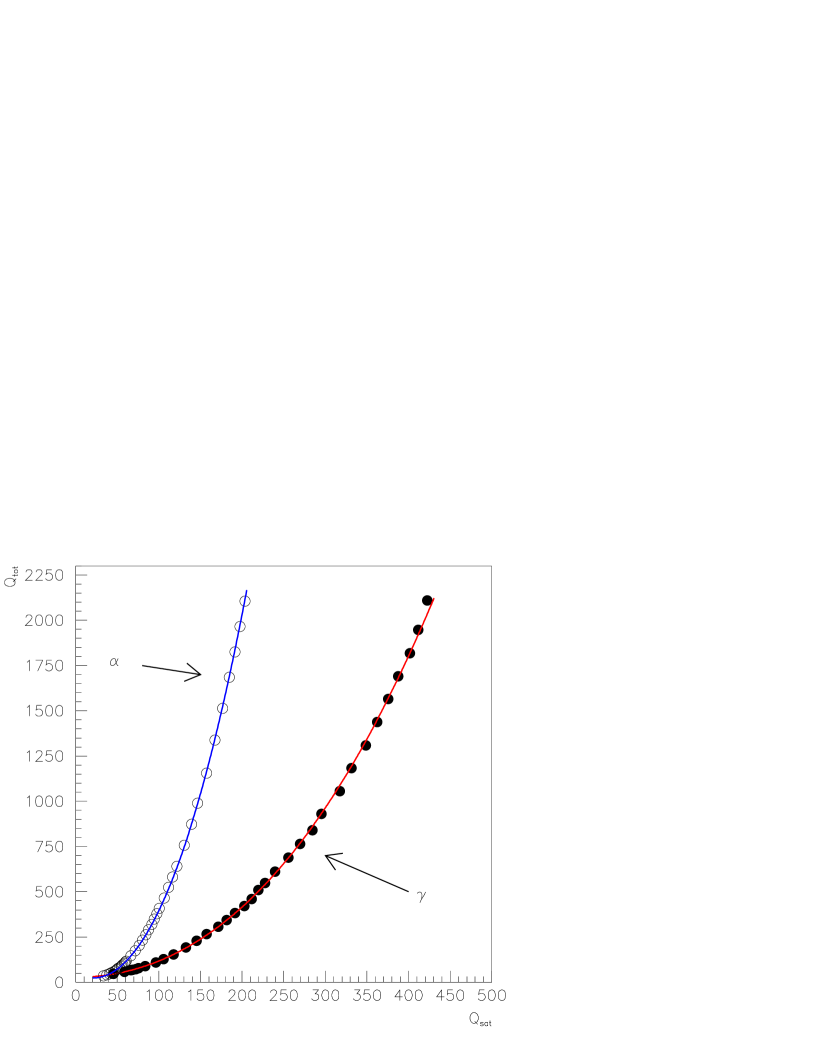
A relationship between and for the saturated events (that is, when ) can then be obtained. It is described by a polynomial function
| (6) |
for both the - and -samples as displayed in Figure 4. The coefficients are obtained from minimum -fits.
This function is then used to compensate the missing area in saturated events. Integration of the saturated pulses provide the values of , from which the correct values of the total charge can be derived in an event-by-event basis.
3.3 Consistency Tests
The correction algorithm discussed in the previous section does not depend on the exact saturation level . One can use this feature to perform consistency checks on data sample where the total charge is known. An unsaturated event is made saturated by software. The algorithm is applied to the simulated saturated event, and the corrected total charge is compared with the raw measurements.
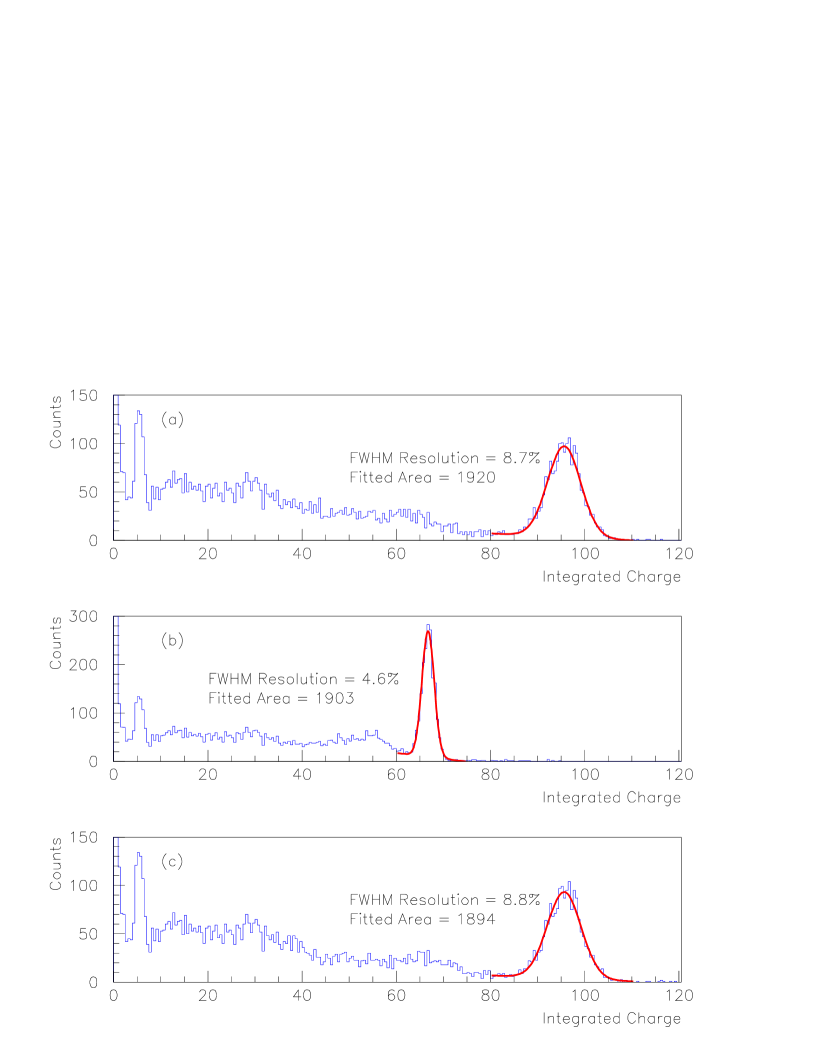
A level of =100 is chosen. A new set of is obtained by going through Eqs. 3 to 6 again, with replaced by . A data set of -events was taken with a 137Cs source. The PMT high-voltage was adjusted such that the amplitude for the 662 keV line is below the actual saturation level of 255 but significantly above . The charge is measured by integrating the normalized FADC counts , and the spectrum is displayed in Figure 5a. The same data is then made saturated by re-defining such that
| (7) |
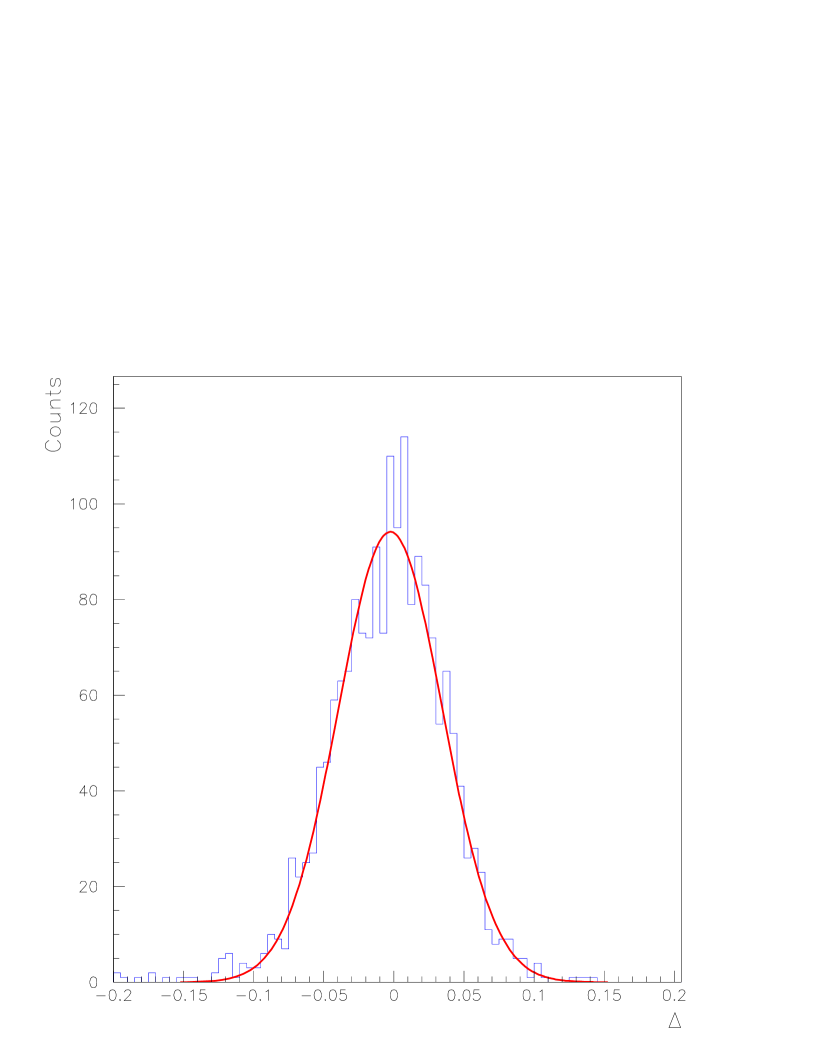
The saturated charge is derived by integrating the normalized and the spectra is shown in Figure 5b, while that for the corrected charge after the correction procedures is shown in Figure 5c. There is excellent agreement on the 137Cs peaks in terms of their integrated charge, resolution and area between Figures 5a and 5c. The event-by-event deviations are parametrized by
| (8) |
The distribution of is depicted in Figure 6. The results show that the mean bias is less than 0.5% which is small compared to the intrinsic FWHM resolution of 8.7%. Therefore, the correction procedures are valid and justified.
3.4 Results
3.4.1 Energy Reconstruction
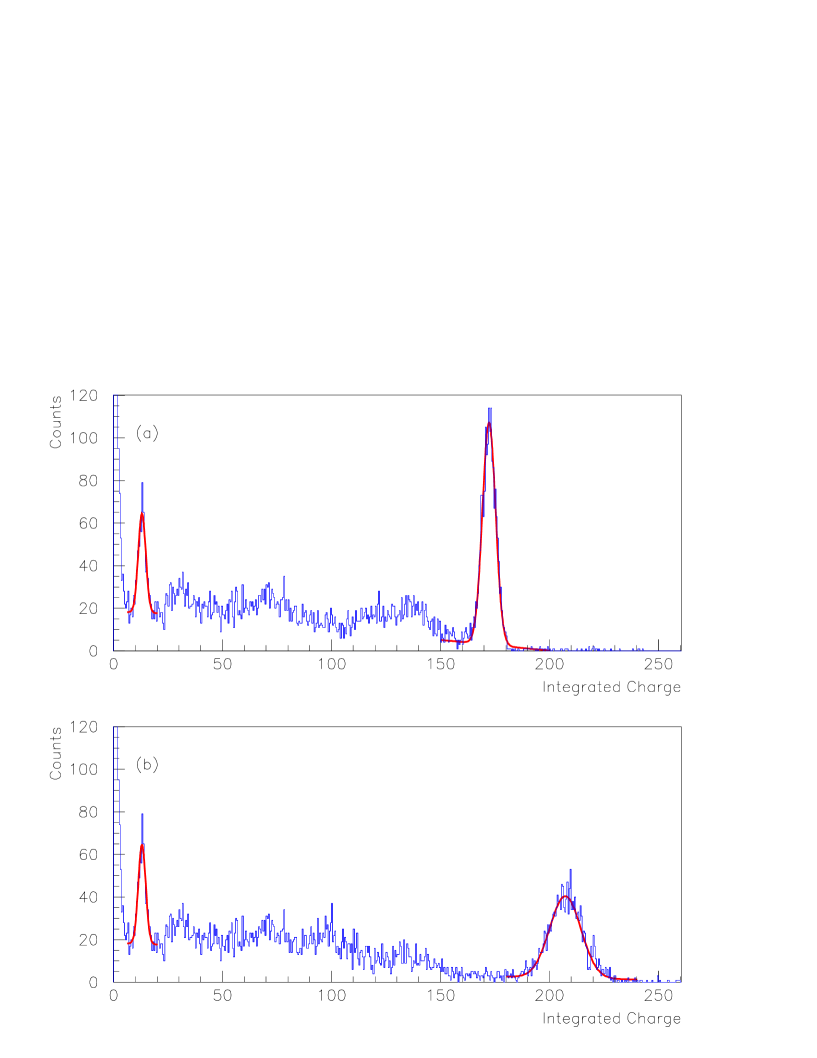
The algorithms are applied to actual saturated data. The data is generated by increasing the PMT high voltages such that the events corresponding to the 662 keV -line from 137Cs have amplitude larger than =255, while those from the 32 keV line remain unsaturated.
An example of the energy spectra of the saturated events, as well as the corrected spectra are illustrated in Figure 7a and Figure 7b, respectively. The ratio of the peak positions at 32 keV and 662 keV (denoted by and , respectively) is measured and compared to the nominal values:
| (9) |
This can be used as a figure of merit to quantify the performance. The values of R for saturated and corrected events as functions of the expected peak amplitudes are displayed in Figure 8a. It can be seen that the charge summation correction methods extend the effective dynamic range of the FADC by at least a factor of 14, or equivalently, 4 more bits.
The dependence of performance of the algorithm on the FADC recording period is studied. The data are truncated by software to a shorter interval and the same correction procedures are repeated. The results are displayed in Figure 8b for the variation of R with peak amplitudes at (that is, 512, 256 and 128 time-bins, respectively). It can be seen that the charge reconstruction is no longer valid for at an amplitude of 8 times of . Alternatively, a plot of R versus / is displayed in Figure 9, where is the unsaturated interval, where the FADC counts are less than . It can be seen the values of R deviate from 1 only for /. Accordingly, the algorithm is valid so long as the the unsaturated interval of the event is more than 2% of the FADC recording period. In comparison, the fitting method as discussed in Section 3.1 would start to fail when the saturation interval is more than twice the value of , or equivalently, the figure-of-merit R deviates from 1 when /.
The dependence of energy resolution of the 662 keV line on amplitudes is shown in Figure 8c. There is no intrinsic bias in the correction, though the energy resolution gets worse from around 9% to 16% FWHM when the amplitude increases by a factor of 14 at =25.6 s. The degradation in energy resolution is larger for the shorter FADC recording time.
3.4.2 Pulse Shape Discrimination
As depicted in Figure 2, the scintillation light in CsI(Tl) has different decay time constants for - and -activated events. The -events decay faster in inorganic crystal scintillators opposite to the responses in organic liquid scintillators [6, 5]. Accordingly, the pulse shape information recorded by the FADC can provide event identification capabilities.
Identification of / events is achieved by studying and comparing the different responses from two observables. One of them, the saturated charge (), has been adopted in energy re-construction as discussed in Section 3. The other is the “mean time” () which reflects the decay profiles, defined as:
| (10) |
The average variations of with for both - and -events can be derived from the reference pulse shape of Figure 2, and are displayed in Figure 10a. The scattered plot of versus for individual events is shown in Figure 10b. It can be seen that / events are well separated for . From Figure 3, it can be concluded that / differentiation can be achieved for -events with amplitude up to 20 times of the saturation level.
4 Summary
An algorithm to process saturated events in Flash Analog-to-Digital Convertor was developed and studied. Charge reconstruction and event identification via pulse shape analysis are achieved, effectively extending an 8-bit FADC by at least 4 more bits. The algorithm is valid so long as the unsaturated interval is more than 2% of the FADC recording period.
Although this work originates from the goals of handling data from CsI(Tl) crystal scintillators, the approach should be generic and can be applicable to other detector systems where the entire pulse shape are recorded while part of which are saturated. These studies will facilitate the specification and design of large FADC-based data acquisition systems.
This work was supported by contracts 90-2112-M-001-037 and 91-2112-M-001-036 from the National Science Council, Taiwan, and 19975050 from the National Science Foundation, China.
References
-
[1]
H.T. Wong and J. Li,
Mod. Phys. Lett. A 15, 2011 (2000);
H.B. Li et al., TEXONO Coll., Nucl. Instrum. Methods A 459, 93 (2001);
H.B. Li et al., TEXONO Coll., Phys. Rev. Lett. 90, 131802 (2003). - [2] Y. Liu et al., TEXONO Coll., Nucl. Instrum. Methods A 482, 125 (2002).
- [3] W.P. Lai et al., TEXONO Coll., Nucl. Instrum. Methods A 465, 550 (2001).
-
[4]
C.L. Morris et. al., Nucl. Instrum. Methods 137,
397 (1976);
M.S. Zucker and N. Tsoupas, Nucl. Instrum. Methods A 299, 281 (1990). - [5] S.C. Wang et al., Nucl. Instrum. Methods A 432, 111 (1999).
- [6] See, for example, “Theory and Practice of Scintillation Counting”, J.B. Birks, Pergamon (1964).
| Event Type | Rise Time | Decay Time Constant | Ratio (r) | |
|---|---|---|---|---|
| [ (ns)] | Fast Comp. | Slow Comp. | ||
| [ (s)] | [ (s)] | |||
| 2033 | 0.540.10 | 2.020.02 | 0.290.02 | |
| 2612 | 0.870.10 | 5.200.04 | 0.610.01 | |