Limits on the neutrino magnetic moment from the MUNU experiment
Abstract
The MUNU experiment was carried out at the Bugey nuclear power reactor. The aim was the study of elastic scattering at low energy. The recoil electrons were recorded in a gas time projection chamber, immersed in a tank filled with liquid scintillator serving as veto detector, suppressing in particular Compton electrons. The measured electron recoil spectrum is presented. Upper limits on the neutrino magnetic moment were derived and are discussed.
1 Introduction
The MUNU experiment was designed to study scattering at low energy, probing in particular the magnetic moment of the neutrino. The detector was set up near a nuclear power reactor in Bugey (France) serving as antineutrino source. We report here on an analysis of data corresponding to 66.6 days of live time reactor-on and 16.7 days reactor-off.
2 Magnetic moments
Many experiments now show that neutrinos have masses, and that the weak eigenstates are superpositions of the mass eigenstates :
| (1) |
Intense work is being done to determine more precisely the mixings and the masses .
Besides masses, neutrinos can have magnetic moments. As shown in ref. [1, 2, 3], the fundamental magnetic moments are associated with the mass eigenstates, in the basis of which they are represented by a matrix (). Dirac neutrinos can have both diagonal and off-diagonal (transition) moments, while off diagonal moments only are possible with Majorana neutrinos.
Astrophysical considerations put strong constraints on Dirac neutrinos, and less strong ones on Majorana neutrinos (see [4, 5]). Upper limits applying in both cases from stellar cooling of order have been derived. Magnetic moments large enough would lead to spin-flavor precession in the toroidal magnetic field in the interior of the sun, as discussed for instance in [6, 7], further complicating the oscillation pattern of solar neutrinos resulting from masses and mixings.
These astrophysical bounds on magnetic moments, however, depend on various assumptions and, to a certain extent, are model dependent. Direct measurements are under much better control. So far the best limits stem from experiments studying or scattering, and looking for deviations of the measured cross-section from the one expected with weak interaction alone. The cross-section is given by
| (2) | |||||
with the contribution of the weak interaction in the first two lines, and that from the magnetic moment in the last one [8]. Here is the incident neutrino energy, the electron recoil energy, and the couplings are given by
The relative contribution of the magnetic moment term increases with decreasing neutrino and electron energies. Therefore it is essential to have a low electron detection threshold, looking for neutrinos from a low energy source. So far the sun and nuclear reactors have been used. Future experiments with radioactive sources are planned.
The measured squared magnetic moment depends on the mixings and, in case of a large distance from the source to the detector, on the propagation properties of neutrinos. For vacuum oscillations it is given by:
| (3) |
with
the momentum of with mass , for a given neutrino energy . In the case of matter enhanced oscillations the dependence of the propagation eigenstates on the local density must be taken into account [3].
2.1 Solar neutrinos
Here the source to detector distance is long, oscillations are relevant and the measured quantity is denoted . Super-Kamiokande has measured with a very high statistical accuracy the electron recoil spectrum from the scattering of solar 8B neutrinos [9]. The total rate is reduced because of neutrino oscillations, but the shape is seen to be in good agreement, within statistics, with that expected assuming weak interaction alone. Beacom and Vogel [3] looked to what extent excess counts at the low energy end from a magnetic moment can be ruled out. The assumption is made that such an excess is not compensated by a distortion due to oscillations. The limit at 90 % confidence level (CL) was derived.
2.2 Reactor neutrinos
Nuclear reactors are strong sources of with energies ranging up to about 8 MeV. These are essentially produced in the beta decay of fission fragments, with however a significant contribution at low energy from nuclei activated by neutrons. Above 1.5-2.0 MeV the integral beta spectrum of the fission fragments of the isotopes in which fission is predominantly induced by thermal neutrons (235U, 239Pu, 241Pu) was measured. These isotopes dominate. A simple procedure leads to the corresponding neutrino spectra, which are thus known well, with a precision of order 5 % or better [10]. In 238U, fission is induced by fast neutrons, and no such measurements are available. Less precise calculations (10 %) only can be used. But this isotope contributes only about 6-7 % in a conventional reactor. The sum spectrum above 2 MeV can be reconstructed with a precision of order 5 %, knowing the relative contributions of the various fissile isotopes at a given reactor. Studies of scattering at reactors [10, 11], which sample the antineutrino spectrum above 2.5 MeV, show good agreement with these predictions.
Below 1.5-2 MeV the neutrino spectrum can only be reconstructed from inherently less precise calculations as shown in ref. [12]. In that work it is mentioned that neutron activations of the fissile isotopes, leading in particular to 239U, 239Np and 237U, and of the fission products, contribute. The yields have been estimated.
In reactor experiments the source to detector distance is short compared to oscillation lengths, and the magnetic moment searched for is given by eq. (3) with L set to zero.
The Irvine group was the first to observe scattering [13]. The experiment was performed at the Savannah River reactor, with a 16 kg plastic scintillation counter surrounded by a NaI veto at 11 m from the reactor core. A reactor-on minus reactor-off signal was seen, with a threshold at 1.5 MeV. Analyzing the electron recoil data with the most recent knowledge of the Weinberg angle and the reactor spectrum, Vogel and Engel [8] found a slight excess of events which can be explained by a magnetic moment of order .
Also scattering was studied at the Rovno reactor by a group from Saint Petersburg. The detector consisted of a stack of silicon sensors, with a total mass of 75 kg. A reactor-on minus reactor-off signal was seen above 600 keV, with a signal to background ratio of order 1:100. The limit at 95(68) % CL was reported [14].
More recently the TEXONO collaboration installed an Ultra Low Background High Purity Germanium detector, with a fiducial mass of 1.06 kg, near the Kuo-Sheng reactor in Taiwan [15]. Here the approach is somewhat different. The threshold on the electron recoil (12 keV) is extremely low. The reactor-on and reactor-off spectra were found to be identical within statistical errors. From that the limit at 90(68) % CL was derived.
3 MUNU
In the aforementioned experiments the energy of the recoil electron candidate only was measured. The MUNU collaboration [5, 16] has built a detector of a different kind, in which the topology of events is recorded. This allows a better event selection, leading to a lower background. Moreover, in addition to the energy, the initial direction of an electron track can be measured. A second parameter, the electron scattering angle, can therefore be reconstructed. This allows to look for a reactor signal by comparing forward electrons, having as reference the reactor to detector axis, with the backward ones. The background is measured on-line, which eliminates problems from detector instabilities, as well as from a possible time dependence of the background itself.
3.1 The detector
The detector is described in details in ref. [16], and we only present here the essential features. The detector, made from radiochemically clean materials, was installed at 18 m from the core of a commercial reactor in Bugey (France) with a power of 2750 MWth. It emits neutrinos from the fission fragments of 235U (54 % on average over an annual reactor cycle), 239Pu (33 %), 241Pu (6 %), and 238U (7 %).
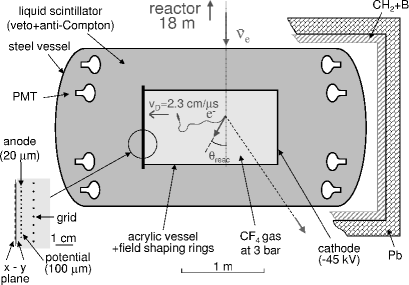
The central component of the MUNU detector consists of a time projection chamber (TPC) filled with 3 bar of CF4 gas (figure 1), acting as target and detector medium for the recoil electron. CF4 was chosen because of its relatively low Z, leading to reduced multiple scattering, its absence of protons, which eliminates backgrounds from scattering, its good drifting properties and its high density. As shown in figure 1 the gas is contained in a cylindrical acrylic vessel of 1 m3 volume (90 cm in diameter, 162 cm long, total CF4 mass 11.4 kg), which is entirely active. The drift field parallel to the TPC axis (z-axis) is defined by a cathode on one side, a grid on the other side, and field shaping rings at successive potentials outside the acrylic vessel. The voltages were set to provide a homogeneous field leading to a drift velocity of 2.14 cms-1. An anode plane with 20 m wires and a pitch of 4.95 mm, separated by 100 m potential wires, is placed behind the grid, to amplify the ionization charge. The integrated anode signal gives the total energy deposit.
A pick-up plane with perpendicular x and y strips (pitch 3.5 mm) behind the anode provides the spatial information in the x-y plane perpendicular to the z-axis. The spatial information along the z-axis is obtained from the time evolution of the signal. To reduce systematics when comparing forward and backward events, the TPC was positioned orthogonally to the reactor-detector axis, which moreover coincides with the bisecting line between x and y strips on the pick-up plane. The anode wires are rotated by 450 with respect to the x-y plane. The TPC is thus absolutely symmetric between backward and forward directions with regards to the reactor-detector axis.
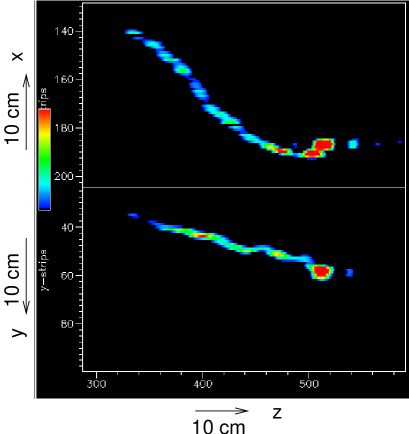
The imaging capability of the TPC is illustrated in figure 2 which shows an electron track.
The energy resolution and calibration is obtained by comparing spectra measured using various sources (137Cs (662 keV), 54Mn (835 keV) and 22Na (1274 keV)) with simulations. The relative energy resolution is found to be 8 % (1 ) at 1 MeV, correcting for small variations across the anode plane. It scales with the power 0.7 of the energy, rather than with the square root. We think that this is because the electron attachement in CF4 in the strong field around the anode wires is rather high, affecting the statistics in the avalanche [16, 17]. The gain stability is monitored regularly throughout the data taking period, with sources and by measuring the spectrum of cosmic muons crossing the TPC. The data are corrected for small instabilities. The angular resolution is around 100 (1 ) at 1 MeV, for tracks scanned visually, as derived from Monte-Carlo simulations, with a slight angular dependence [18]. The energy dependence is only weak above 700 keV.
The acrylic vessel is immersed in a steel tank filled with liquid scintillator and viewed by photomultipliers, 24 on each side. It acts as a veto counter against the cosmics and as an anti-Compton detector to reduce the background from ’s. The scintillator also sees the light produced by the avalanche around the anode wire, providing an additional measurement of the ionisation charge. The primary light of heavily ionizing particles such as ’s is seen as well. A few ’s are observed from remaining surface contaminations on the cathode. The primary light of minimum ionizing particles confined in the gas volume however is below detection threshold.
The TPC threshold is set at 300 keV, and that in the scintillator at 100 keV, with a minimum of 5 photomultipliers hit. We note that the singles rates in the photomultipliers show no azimuthal dependence, which could result from hot spots.
In normal data taking TPC events above threshold are read out, provided they are not in coincidence with a 200 s signal started by scintillator pulses above 22 MeV. This eliminates direct cosmic hits, or neutrons associated with them. The 48 photomultipliers are read out first. The light from the photomultipliers on the anode side and the cathode side is compared. Reading proceeds only if the relative difference is less than 30 %. Events corresponding to real tracks inside the gas volume were found to always fall within these limits [19]. Discharges however can result in a larger imbalance, in which case they are readily eliminated. This helps reducing the average readout time.
4 Event selection
Good events are single electrons contained in the TPC volume. The selection of neutrino scattering events proceeds in two steps. First an automatic filtering eliminates obviously bad events, namely events
-
•
identified as ’s or discharges from their topology (high ionization in a small volume),
-
•
or in delayed coincidence (80 s, corresponding to the TPC length) with a signal in the scintillator,
-
•
or events not contained in a fiducial volume of 42 cm radius,
-
•
and finally events with a fast rise time, due to particles crossing the amplification gap between the pick up plane plane and the grid, in either direction. Here the avalanche light signal is used, as described in ref. [16].
The precise live time is derived in this process on a daily basis. It is found to fluctuate around 65 %. It is limited primarily by the total veto time of the scintillator (11 %) and the dead time of the TPC itself, caused by the relatively long data read-out and data transfer time (24 %).
Then a final scan is performed. In a separate publication, we reported first results from a crude automatic procedure [20], carried out with a pattern recognition program. Here we present an analysis based on a visual scan of events, which has the advantage of cleaner event selection. Also the risk of misidentifying the beginning of a track is much reduced. This approach is time consuming, however. To minimize the work load, that analysis was restricted to energies above 700 keV. Results from an improved version of the automatic scanning procedure will be discussed in a subsequent section. The data sets corresponds to 66.6 days of live time reactor-on and 16.7 days reactor-off.


In this second scan both the and projections of an event are scrutinized, as well as the evolution in time of the anode and scintillator signals. Continuous electron tracks only are retained. The end of the track is identified from the increased energy deposition, due to the higher stopping power, as exemplified in figure 2. Events with a second high deposition along the track, in particular near the other end, are discarded. This improves the background suppression, at the cost of events with a delta electron, which however contribute negligibly.
Then the tangent at the start of the track is determined by eye. From that the angles with respect to the reactor core-detector axis is determined, as well as the angle with respect to the TPC axis.
An excess of events from the anode side was observed. It is presumably due to additional activities, resulting from the greater complexity of the readout system, and to a larger inactive volume in the scintillator because of the stronger and thicker acrylic lid. For that reason only electrons emitted in the half sphere from the cathode side () are accepted. This reduces the acceptance by a factor 2, but leads to a better signal to background ratio.
5 Results from the visual scan
In figure 3 we show the distribution of of single contained electrons, for both reactor-on and reactor-off. The slightly non linear angular response of the TPC, and its geometry, explain the accumulation of events at around 1, -1 and 0 for reactor-off. The distribution is however identical in forward () and backward () directions. The reactor-on spectrum shows a clear excess of events in forward direction from scattering. Uncertainties from instabilities of the gain, the veto rate, the live time, cancel out in this forward minus backward comparison.
For each electron event the neutrino energy is reconstructed from the electron recoil energy and from the scattering angle, taken as . Forward event candidates are defined as those with positive neutrino energy: . To select backward events the neutrino energy which must be positive is that calculated using as scattering angle. This procedure has an acceptance close to 100 % above 700 keV, as determined by Monte-Carlo simulations. It takes into account that electrons are emitted in an narrower cone whith increasing energies, and is somewhat more sophisticated than the application of a crude cut on . In practice, however, with a threshold of 700 keV, it produces almost the same result as the application of a cut or .
The energy distributions of both forward and backward events are displayed in figure 4. A clear excess of forward events (458 in total) over backward events (340) is seen. The total forward minus backward count rate above 700 keV is thus 1.770.42 day-1. The background, given by the backward events, shows a steep low energy component ending at about 1.2 MeV. Above it is seen to be fairly low, and much flatter. The background was observed to increase slightly during the course of the experiment, by about 10 % in 6 months, possibly because of outgassing. A small drop in efficiency of the anti-Compton, even without an observable reduction in count rate, could also explain this.
As a cross check the reactor-off recoil spectra, both forward and backward, measured after the reactor-on period, were reconstructed as well, and are displayed in figure 5. They are indeed identical within statistics, the integrated forward minus backward rate above 700 keV being day-1.


The difference of the forward minus backward reactor-on spectra is shown in figure 6. The expected event rate was calculated using the best knowledge of the reactor spectrum as described above, and taking into account the known activations of fissile isotopes and fission products. The uncertainty is around 5 % above 900 keV, as discussed previously, and larger below. The various acceptances of the event selection procedure were determined from measurements with sources, and by Monte Carlo simulations using the GEANT3 code. Data sets including recoil electrons from neutrino scattering were produced, filtered and scanned just as the real data. The containment efficiency in the 42 cm fiducial radius for recoil electrons was found to vary from 63 % at 700 keV, 50 % at 1 MeV to 12 % at 2 MeV. The relative uncertainty is of order 2-3 %. Some tracks with weird topologies cannot be reconstructed, reducing the acceptance by 4 %, relatively speaking. Similarly the remaining acceptances together, including that of the cut, lead to an additional 6 % reduction. Neutrino interactions in the copper cathode give rise to electrons which can escape into the gas volume. These cannot be vetoed. Taking into account all cuts they increase the expected rate between 700 keV to 2 MeV by some 3 %. The relative uncertainty on the global acceptance is of order 7 %, leading to a total uncertainty of 9 % on the total expected rate.
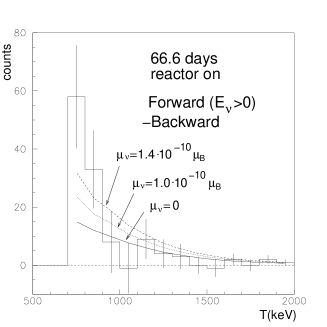
The total expected rate above 700 keV assuming a vanishing magnetic moment was found to be 1.020.1 day-1, to be compared with 1.770.42 day-1 measured, as mentioned above. There is thus a certain excess of measured events, which has however only a small statistical significance. The calculated energy distribution is shown in figure 6. The excess counts are seen to be in the region below 900 keV.
To be more quantitative, a was calculated using 100 keV bins as shown in figure 6 from 700 keV to 1400 keV, and then a bin from 1400 to 2000 keV. Gaussian statistics applies then to all bins. The error on the expected rate is small in comparison to the statistical uncertainties, and turns out to be negligible. The was calculated this way for several values of the squared magnetic moment , constraining it to the region . This is consistent with a vanishing magnetic moment. Renormalizing to the physical region we find the limit at 90(68)% CL.
Nevertheless even the best fit is not very satisfactory. The (9.9 for 7 degrees of freedom) is on the high side. More troublesome, as seen in figure 6, the inclusion of a magnetic moment in the calculated spectrum improves the agreement with the data in the two first bins from 700 to 900 keV, but makes it worse in the upper ones.
These two first bins are solely responsible for the high total rate. We note that such an excess is also visible, unfortunately also with limited statistical precision, and appearing at somewhat smaller energies, in the data of ref. [14]. This excess may well result not from a magnetic moment, but instead from sources not taken into account when evaluating the reactor neutrino spectrum. As mentioned above, the low energy part, which contributes significantly to the electron spectrum below 0.9 MeV, is not so well known. Additional neutron activations may contribute, beyond the known ones of the fissile isotopes and the fission products. In that sense it seems safe at this stage to restrict the analysis to electron energies above 900 keV. There the measured event rate is day-1, in good agreement with the expected one day-1. From the event rate and the energy distribution, using the same prescription as above, the allowed range is found. The best is 1.51 for 5 degrees of freedom. This yields the limit
| (4) |
somewhat more stringent than the previous one.
6 Automatic scanning
Extending the visual scan to energies below 700 keV is not feasible because of the rapid increase of the background below that energy, leading to an unmanageable workload. But the automatic scanning procedure mentioned in [20] has been improved, and used on the same data set [19]. The program first identifies electron tracks, searches the vertex, and then fits the beginning of the track.
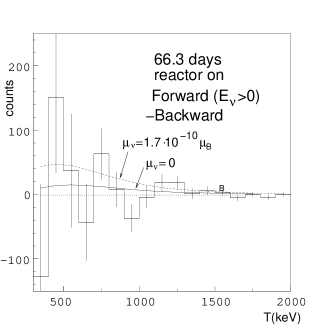
Electron tracks as identical as possible to real tracks were produced by Monte-Carlo. The electronics noise was included. The tracks were analyzed with the same program to determine the global acceptance, as well as the angular resolution. The angular resolution is inferior to that obtained in the visual scanning, varying from 310 at 300 keV, to 180 at 700 keV and finally 120 at 2 MeV. This reduces the acceptance of the cut in particular at low energy. This, combined with poorer electron track identification, leads to an acceptance of 20 % at 300 keV, increasing to 54 % at 1 MeV and remaing constant above that energy. Events with were taken. The other cuts and acceptances are the same as in the visual scanning. The background suppression is inferior by a factor 3 or more, so that the statistical precision is less. But the method can be applied to energies extending down to 300 keV. We show in figure 7 the forward minus backward spectra for reactor-on. It is in good general agreement with the spectra from the eye scan. The high bin at 750 keV is reproduced. But, admittedly with relatively large statistical errors, a catastrophic rise when going to lower energies can be ruled out. Applying the same procedure as above to the data one obtains the limit at 90 % CL. It does not change with the threshold in the range 300 to 800 keV, the better sensitivity at low energy being offset by the larger statistical uncertainties.
7 Conclusions
The MUNU experiment studied scattering at low energy near a nuclear reactor. For electron recoil energies above 900 keV, good agreement is seen with expectations assuming weak interaction alone. From this the following limit on the magnetic moment of the neutrino can be derived: at 90(68) % CL, limited primarily by statistics.
In any event this bound rules out the possible indication for a relatively large magnetic moment from the Savannah River experiment [8], and improves on the limit from ref. [14] and [15]. It is somewhat more stringent than the limit on from solar neutrinos [3], which however does not apply to exactly the same quantity.
The authors want to thank Edf-CNPE Bugey for the hospitality. This work was supported by IN2P3, INFN, and SNF.
References
- [1] B. Kayser, Phys. Rev. D26 (1982) 1662
- [2] R. E. Shrock, Nucl. Phys. B206 (1982) 359
- [3] J. F. Beacom and P. Vogel, Phys. Rev. Lett. 83 (1999) 5222
- [4] G. G. Raffelt, Stars as laboratories for fundamental physics, University of Chicago Press, Chicago 1996
- [5] The MUNU collaboration (C. Amsler et al.), Nucl. Inst. and Meth. A396 (1997) 115
- [6] E.Kh. Akhmedov, A. Lanza and S.T. Petcov, Phys. Lett. B303 (1993) 85
- [7] E. Kh. Akhmedov and J. Pulido,Solar neutrino oscillations and bounds on neutrino magnetic moment and solar magnetic field, hep-ph/0209192, 2002
- [8] P. Vogel and J. Engel, Phys. Rev. D39 (1989) 3378
- [9] The SuperKamiokande collaboration (Y. Fukuda et al., Phys. Rev. Lett. 82 (1999) 2430
- [10] G. Zacek et al., Phys. Rev. D34 (1986) 2621
- [11] B. Achkar et al., Nucl. Phys. B534 (1995) 503
- [12] V.I. Kopeikin et al. Phys. of Atomic Nuclei Vol. 60 (1997) 172
- [13] F. Reines, H.S. Gurr and H.W. Sobel, Phys. Rev. Lett. 37(1976)315
- [14] A.I. Derbin et al., JETP Lett., 57 (1993) 768
- [15] The TEXONO collaboration (H.B.Li et al.), Phys. Rev. Lett. 90 (2003) 131802
- [16] The MUNU collaboration (M.Avenier et al.), Nucl. Inst. and Meth. A482 (2002) 408
- [17] J. Lamblin, Thesis, Institut National Polytechnique de Grenoble, 2002
- [18] Z. Daraktchieva, Thesis, University of Neuchâtel, in preparation
- [19] O. Link, Thesis, University of Zurich, 2003
- [20] The MUNU collaboration (C. Amsler et al.), Phys. Lett.B 545 (2002) 57