DESY 03-038 ISSN 0418-9833
March 2003
Measurement and QCD Analysis of Neutral and Charged
Current Cross Sections at HERA
H1 Collaboration
The inclusive single and double differential cross sections for neutral and charged current processes are measured with the H1 detector at HERA. The data were taken in and at a centre-of-mass energy of and correspond to an integrated luminosity of pb-1. The cross sections are measured in the range of four-momentum transfer squared between and and Bjorken between and . The neutral current analysis for the new data and the earlier data taken in and is extended to small energies of the scattered electron and therefore to higher values of inelasticity , allowing a determination of the longitudinal structure function at high (). A new measurement of the structure function is obtained using the new and previously published neutral current cross section data at high . These data together with H1 low precision data are further used to perform new next-to-leading order QCD analyses in the framework of the Standard Model to extract flavour separated parton distributions in the proton.
Submitted to Eur. Phys. J. C.
C. Adloff33, V. Andreev24, B. Andrieu27, T. Anthonis4, A. Astvatsatourov35, A. Babaev23, J. Bähr35, P. Baranov24, E. Barrelet28, W. Bartel10, S. Baumgartner36, J. Becker37, M. Beckingham21, A. Beglarian34, O. Behnke13, A. Belousov24, Ch. Berger1, T. Berndt14, J.C. Bizot26, J. Böhme10, V. Boudry27, W. Braunschweig1, V. Brisson26, H.-B. Bröker2, D.P. Brown10, D. Bruncko16, F.W. Büsser11, A. Bunyatyan12,34, A. Burrage18, G. Buschhorn25, L. Bystritskaya23, A.J. Campbell10, J. Cao26, S. Caron1, F. Cassol-Brunner22, V. Chekelian25, D. Clarke5, C. Collard4, J.G. Contreras7,41, Y.R. Coppens3, J.A. Coughlan5, M.-C. Cousinou22, B.E. Cox21, G. Cozzika9, J. Cvach29, J.B. Dainton18, W.D. Dau15, K. Daum33,39, M. Davidsson20, B. Delcourt26, N. Delerue22, R. Demirchyan34, A. De Roeck10,43, E.A. De Wolf4, C. Diaconu22, J. Dingfelder13, P. Dixon19, V. Dodonov12, J.D. Dowell3, A. Dubak25, C. Duprel2, G. Eckerlin10, D. Eckstein35, V. Efremenko23, S. Egli32, R. Eichler32, F. Eisele13, E. Eisenhandler19, M. Ellerbrock13, E. Elsen10, M. Erdmann10,40,e, W. Erdmann36, P.J.W. Faulkner3, L. Favart4, A. Fedotov23, R. Felst10, J. Ferencei10, S. Ferron27, M. Fleischer10, P. Fleischmann10, Y.H. Fleming3, G. Flucke10, G. Flügge2, A. Fomenko24, I. Foresti37, J. Formánek30, G. Franke10, G. Frising1, E. Gabathuler18, K. Gabathuler32, J. Garvey3, J. Gassner32, J. Gayler10, R. Gerhards10, C. Gerlich13, S. Ghazaryan4,34, L. Goerlich6, N. Gogitidze24, C. Grab36, V. Grabski34, H. Grässler2, T. Greenshaw18, G. Grindhammer25, D. Haidt10, L. Hajduk6, J. Haller13, B. Heinemann18, G. Heinzelmann11, R.C.W. Henderson17, S. Hengstmann37, H. Henschel35, O. Henshaw3, R. Heremans4, G. Herrera7,44, I. Herynek29, M. Hildebrandt37, M. Hilgers36, K.H. Hiller35, J. Hladký29, P. Höting2, D. Hoffmann22, R. Horisberger32, A. Hovhannisyan34, M. Ibbotson21, Ç. İşsever7, M. Jacquet26, M. Jaffre26, L. Janauschek25, X. Janssen4, V. Jemanov11, L. Jönsson20, C. Johnson3, D.P. Johnson4, M.A.S. Jones18, H. Jung20,10, D. Kant19, M. Kapichine8, M. Karlsson20, O. Karschnick11, J. Katzy10, F. Keil14, N. Keller37, J. Kennedy18, I.R. Kenyon3, C. Kiesling25, P. Kjellberg20, M. Klein35, C. Kleinwort10, T. Kluge1, G. Knies10, B. Koblitz25, S.D. Kolya21, V. Korbel10, P. Kostka35, R. Koutouev12, A. Koutov8, J. Kroseberg37, K. Krüger10, T. Kuhr11, D. Lamb3, M.P.J. Landon19, W. Lange35, T. Laštovička35,30, P. Laycock18, E. Lebailly26, A. Lebedev24, B. Leißner1, R. Lemrani10, V. Lendermann10, S. Levonian10, B. List36, E. Lobodzinska10,6, B. Lobodzinski6,10, A. Loginov23, N. Loktionova24, V. Lubimov23, S. Lüders37, D. Lüke7,10, L. Lytkin12, N. Malden21, E. Malinovski24, S. Mangano36, P. Marage4, J. Marks13, R. Marshall21, H.-U. Martyn1, J. Martyniak6, S.J. Maxfield18, D. Meer36, A. Mehta18, K. Meier14, A.B. Meyer11, H. Meyer33, J. Meyer10, S. Michine24, S. Mikocki6, D. Milstead18, S. Mohrdieck11, M.N. Mondragon7, F. Moreau27, A. Morozov8, J.V. Morris5, K. Müller37, P. Murín16,42, V. Nagovizin23, B. Naroska11, J. Naumann7, Th. Naumann35, P.R. Newman3, F. Niebergall11, C. Niebuhr10, O. Nix14, G. Nowak6, M. Nozicka30, B. Olivier10, J.E. Olsson10, D. Ozerov23, V. Panassik8, C. Pascaud26, G.D. Patel18, M. Peez22, E. Perez9, A. Petrukhin35, J.P. Phillips18, D. Pitzl10, B. Portheault26, R. Pöschl26, I. Potachnikova12, B. Povh12, J. Rauschenberger11, P. Reimer29, B. Reisert25, C. Risler25, E. Rizvi3, P. Robmann37, R. Roosen4, A. Rostovtsev23, S. Rusakov24, K. Rybicki6, D.P.C. Sankey5, E. Sauvan22, S. Schätzel13, J. Scheins10, F.-P. Schilling10, P. Schleper10, D. Schmidt33, D. Schmidt10, S. Schmidt25, S. Schmitt10, M. Schneider22, L. Schoeffel9, A. Schöning36, T. Schörner-Sadenius25, V. Schröder10, H.-C. Schultz-Coulon7, C. Schwanenberger10, K. Sedlák29, F. Sefkow37, I. Sheviakov24, L.N. Shtarkov24, Y. Sirois27, T. Sloan17, P. Smirnov24, Y. Soloviev24, D. South21, V. Spaskov8, A. Specka27, H. Spitzer11, R. Stamen7, B. Stella31, J. Stiewe14, I. Strauch10, U. Straumann37, S. Tchetchelnitski23, G. Thompson19, P.D. Thompson3, F. Tomasz14, D. Traynor19, P. Truöl37, G. Tsipolitis10,38, I. Tsurin35, J. Turnau6, J.E. Turney19, E. Tzamariudaki25, A. Uraev23, M. Urban37, A. Usik24, S. Valkár30, A. Valkárová30, C. Vallée22, P. Van Mechelen4, A. Vargas Trevino7, S. Vassiliev8, Y. Vazdik24, C. Veelken18, A. Vest1, A. Vichnevski8, Volchinski34, K. Wacker7, J. Wagner10, R. Wallny37, B. Waugh21, G. Weber11, R. Weber36, D. Wegener7, C. Werner13, N. Werner37, M. Wessels1, S. Wiesand33, M. Winde35, G.-G. Winter10, Ch. Wissing7, M. Wobisch10, E.-E. Woehrling3, E. Wünsch10, A.C. Wyatt21, J. Žáček30, J. Zálešák30, Z. Zhang26, A. Zhokin23, F. Zomer26, and M. zur Nedden25
1 I. Physikalisches Institut der RWTH, Aachen, Germanya
2 III. Physikalisches Institut der RWTH, Aachen, Germanya
3 School of Physics and Space Research, University of Birmingham,
Birmingham, UKb
4 Inter-University Institute for High Energies ULB-VUB, Brussels;
Universiteit Antwerpen (UIA), Antwerpen; Belgiumc
5 Rutherford Appleton Laboratory, Chilton, Didcot, UKb
6 Institute for Nuclear Physics, Cracow, Polandd
7 Institut für Physik, Universität Dortmund, Dortmund, Germanya
8 Joint Institute for Nuclear Research, Dubna, Russia
9 CEA, DSM/DAPNIA, CE-Saclay, Gif-sur-Yvette, France
10 DESY, Hamburg, Germany
11 Institut für Experimentalphysik, Universität Hamburg,
Hamburg, Germanya
12 Max-Planck-Institut für Kernphysik, Heidelberg, Germany
13 Physikalisches Institut, Universität Heidelberg,
Heidelberg, Germanya
14 Kirchhoff-Institut für Physik, Universität Heidelberg,
Heidelberg, Germanya
15 Institut für experimentelle und Angewandte Physik, Universität
Kiel, Kiel, Germany
16 Institute of Experimental Physics, Slovak Academy of
Sciences, Košice, Slovak Republice,f
17 School of Physics and Chemistry, University of Lancaster,
Lancaster, UKb
18 Department of Physics, University of Liverpool,
Liverpool, UKb
19 Queen Mary and Westfield College, London, UKb
20 Physics Department, University of Lund,
Lund, Swedeng
21 Physics Department, University of Manchester,
Manchester, UKb
22 CPPM, CNRS/IN2P3 - Univ Mediterranee,
Marseille - France
23 Institute for Theoretical and Experimental Physics,
Moscow, Russial
24 Lebedev Physical Institute, Moscow, Russiae
25 Max-Planck-Institut für Physik, München, Germany
26 LAL, Université de Paris-Sud, IN2P3-CNRS,
Orsay, France
27 LPNHE, Ecole Polytechnique, IN2P3-CNRS, Palaiseau, France
28 LPNHE, Universités Paris VI and VII, IN2P3-CNRS,
Paris, France
29 Institute of Physics, Academy of
Sciences of the Czech Republic, Praha, Czech Republice,i
30 Faculty of Mathematics and Physics, Charles University,
Praha, Czech Republice,i
31 Dipartimento di Fisica Università di Roma Tre
and INFN Roma 3, Roma, Italy
32 Paul Scherrer Institut, Villigen, Switzerland
33 Fachbereich Physik, Bergische Universität Gesamthochschule
Wuppertal, Wuppertal, Germany
34 Yerevan Physics Institute, Yerevan, Armenia
35 DESY, Zeuthen, Germany
36 Institut für Teilchenphysik, ETH, Zürich, Switzerlandj
37 Physik-Institut der Universität Zürich, Zürich, Switzerlandj
38 Also at Physics Department, National Technical University,
Zografou Campus, GR-15773 Athens, Greece
39 Also at Rechenzentrum, Bergische Universität Gesamthochschule
Wuppertal, Germany
40 Also at Institut für Experimentelle Kernphysik,
Universität Karlsruhe, Karlsruhe, Germany
41 Also at Dept. Fis. Ap. CINVESTAV,
Mérida, Yucatán, Méxicok
42 Also at University of P.J. Šafárik,
Košice, Slovak Republic
43 Also at CERN, Geneva, Switzerland
44 Also at Dept. Fis. CINVESTAV,
México City, Méxicok
a Supported by the Bundesministerium für Bildung und Forschung, FRG,
under contract numbers 05 H1 1GUA /1, 05 H1 1PAA /1, 05 H1 1PAB /9,
05 H1 1PEA /6, 05 H1 1VHA /7 and 05 H1 1VHB /5
b Supported by the UK Particle Physics and Astronomy Research
Council, and formerly by the UK Science and Engineering Research
Council
c Supported by FNRS-FWO-Vlaanderen, IISN-IIKW and IWT
d Partially Supported by the Polish State Committee for Scientific
Research, grant no. 2P0310318 and SPUB/DESY/P03/DZ-1/99
and by the German Bundesministerium für Bildung und Forschung
e Supported by the Deutsche Forschungsgemeinschaft
f Supported by VEGA SR grant no. 2/1169/2001
g Supported by the Swedish Natural Science Research Council
i Supported by the Ministry of Education of the Czech Republic
under the projects INGO-LA116/2000 and LN00A006, by
GAUK grant no 173/2000
j Supported by the Swiss National Science Foundation
k Supported by CONACyT
l Partially Supported by Russian Foundation
for Basic Research, grant no. 00-15-96584
1 Introduction
In the HERA accelerator began operation, colliding lepton and proton beams within the H1 and ZEUS experiments. The phase space covered by HERA inclusive deep inelastic scattering (DIS) cross section measurements ranges from small Bjorken at low , the four-momentum transfer squared, to large at values larger than the squared masses of the and gauge bosons. These measurements provide an insight into the partonic structure of matter and the dynamics of strong interactions and test quantum chromodynamics (QCD) over a huge kinematic range.
Both neutral current (NC) interactions, via or exchange, and charged current (CC) interactions, via exchange, can be observed at HERA, yielding complementary information on the QCD and electroweak (EW) parts of the Standard Model. The cross sections are defined in terms of three kinematic variables , and , where quantifies the inelasticity of the interaction. The kinematic variables are related via , where is the centre-of-mass energy squared.
Measurements of the NC and CC cross sections in scattering have been made by H1 and ZEUS based on pb-1 data sets taken between and [1, 2] with protons of energy and positrons of energy , leading to a centre-of-mass energy . Here, new NC and CC cross section measurements, based on data taken at in and , are presented with improved precision using a luminosity of pb-1. The increased centre-of-mass energy stems from the change in the proton beam energy from to since 1998. These data sets together provide the most accurate neutral and charged current cross sections measured by H1 at high () in the first phase of HERA operation (HERA-I).
The NC analysis is extended to higher up to for . This extension of the kinematic range allows a determination of the longitudinal structure function, , to be made at high for the first time. This analysis is performed on both the data and the data, taken in and with a luminosity of pb-1 at . The extended high- analysis and extraction complement the inclusive cross section measurements published in [3]. The difference in NC cross sections between and scattering at high is employed to update the measurement of , superseding the earlier measurement [3].
The accuracy and kinematic coverage of the H1 neutral and charged current cross section data enable dedicated QCD analyses, which test the prediction of logarithmic scaling violations over four orders of magnitude in and allow parton distribution functions (PDFs) of the proton to be deduced. This in turn allows predictions to be made for future facilities such as the LHC, deviations from which may be due to exotic phenomena beyond the Standard Model.
A next-to-leading order (NLO) QCD analysis of the H1 data alone is performed, using a novel decomposition of the quark species into the up- and down-type quark distributions to which the NC and CC cross section data are sensitive. The fit parameter space is narrowed using theoretical constraints adapted to the new ansatz and the experimental and phenomenological uncertainties are systematically approached. This leads to a description of the complete set of NC and CC data as well as to new determinations of the PDFs and their uncertainties. For comparison, the QCD analysis is further extended to include the accurate proton and deuteron data from the BCDMS muon scattering experiment [4].
This paper is organised as follows. In section 2 the definitions of the inclusive NC and CC cross sections are given. In section 3 the detector, simulation and measurement procedures are described. The QCD analysis method is explained in section 4, followed by the measurements and the QCD analysis results in section 5. The paper is summarised in section 6.
2 Neutral and Charged Current Cross Sections
After correction for QED radiative effects, the measured NC cross section for the process with unpolarised beams is given by
| (1) | |||||
| (2) |
where is the fine structure constant. The corrections are defined in [5], with and the and boson masses (taken here as in [3] to be and ) as the main electroweak inputs. The weak corrections are typically less than and never more than . The NC structure function term was introduced in [1] and is expressed in terms of the generalised structure functions , and . The helicity dependences of the electroweak interaction are contained in . The generalised structure functions and can be further decomposed as [6]
| (3) | |||||
| (4) |
with in the on-mass-shell scheme [7]. The quantities and are the vector and axial-vector weak couplings of the electron111In this paper “electron” refers generically to both electrons and positrons. Where distinction is required the symbols and are used. to the [7]. The electromagnetic structure function originates from photon exchange only. The functions and are the contributions to and from exchange and the functions and are the contributions from interference. The longitudinal structure function may be decomposed in a manner similar to . Its contribution is significant only at high .
Over most of the kinematic domain at HERA the dominant contribution to the cross section comes from pure photon exchange via . The contributions due to boson exchange only become important at large values of . For longitudinally unpolarised lepton beams the contribution is the same for and for scattering, while the contribution changes sign as can be seen in eq. 2.
In the quark parton model (QPM) the structure functions , and are related to the sum of the quark and anti-quark momentum distributions, and ,
| (5) |
and the structure functions and to their difference, which determines the valence quark distributions, ,
| (6) |
In eqs. 5 and 6, is the electric charge of quark and and are respectively the vector and axial-vector weak coupling constants of the quarks to the . In the QPM the longitudinal structure function .
For CC interactions the measured unpolarised scattering cross section corrected for QED radiative effects may be expressed as
| (7) | |||||
| (8) |
where represents the CC weak radiative corrections. In this analysis is defined [8] using the weak boson masses and is in very good agreement with determined from the measurement of the muon lifetime [7]. The CC structure function term [1] is expressed in terms of the CC structure functions , and , defined in a similar manner to the NC structure functions [8]. In the QPM (where ), they may be interpreted as lepton beam-charge dependent sums and differences of quark and anti-quark distributions and are given for an unpolarised lepton beam by
| (9) |
Below the quark mass threshold, , , and are defined respectively as the sum of up-type, of down-type and of their anti-quark-type distributions
| (10) |
For the presentation of the subsequent measurements it is convenient to define the NC and CC “reduced cross sections” as
| (11) |
3 Experimental Technique
3.1 H1 Apparatus and Trigger
The H1 co-ordinate system is defined such that the positive axis is in the direction of the outgoing proton beam (forward direction). The polar angle is then defined with respect to this axis. A full description of the H1 detector can be found in [9, 10, 11]. The detector components most relevant to this analysis are the Liquid Argon (LAr) calorimeter, which measures the positions and energies of particles over the range , a lead-fibre calorimeter (SPACAL) covering the range , the Plug calorimeter covering the range and the inner tracking detectors, which measure the angles and momenta of charged particles over the range . In the central region, , the central jet chamber (CJC) measures charged track trajectories in the plane and is supplemented by two drift chambers to improve the measurement of reconstructed tracks. The forward tracking detector, , is used to determine the vertex position of events when no reconstructed CJC track is found.
The luminosity is determined by measuring the QED bremsstrahlung () event rate by tagging the photon in a photon detector located at m. An electron tagger is placed at m adjacent to the beam-pipe. It is used to check the luminosity measurement and to provide information on events at very low (photoproduction) where the electron scatters through a small angle ( mrad).
NC events are triggered mainly using information from the LAr calorimeter. The calorimeter has a finely segmented geometry allowing the trigger to select localised energy deposits in the electromagnetic section of the calorimeter. For electrons with energy above this is efficient as determined using an independently triggered sample of events. At lower energies the triggers based on LAr information are supplemented by using additional information from the tracking detectors. In the LAr calorimeter electronics were upgraded in order to trigger scattered electrons with energies as low as , the minimum value considered in this analysis. This gives access to the high kinematic region. For electron energies of , the overall trigger efficiency is for the data set and for the earlier data set.
The characteristic feature of CC events is a large missing transverse momentum , which is identified at the trigger level using the LAr calorimeter vector sum of “trigger towers”, i.e. groups of trigger regions with a projective geometry pointing to the nominal interaction vertex. At low , the efficiency is enhanced by making use of an additional trigger requiring calorimeter energy in association with track information from the inner tracking chambers. For the minimum of considered in the analysis the efficiency is , rising to for of . In terms of , the efficiency is at and increases to at . These efficiencies are determined from the data using a sample of NC events in which all information from the scattered lepton is suppressed, the so-called pseudo-CC sample. The trigger energy sums are then recalculated for the remaining hadronic final state. This sample also provides a useful high statistics cross check of further aspects of the CC analysis.
3.2 Simulation Programs
Simulated DIS events are used in order to determine acceptance corrections. DIS processes are generated using the DJANGO [12] Monte Carlo (MC) simulation program, which is based on LEPTO [13] for the hard interaction and HERACLES [14] for single photon emission off the lepton line and virtual EW corrections. LEPTO combines matrix elements with higher order QCD effects using the colour dipole model as implemented in ARIADNE [15]. The JETSET program is used to simulate the hadronisation process [16]. In the event generation the DIS cross section is calculated with the PDFs of [17]. The simulated cross section is reweighted using a NLO QCD fit (H1 PDF fit) to previous data [1].
The detector response to events produced by the generation programs is simulated in detail using a program based on GEANT [18]. These simulated events are then subjected to the same reconstruction and analysis chain as the data.
The dominant photoproduction background processes are simulated using the PYTHIA [19] generator with leading order PDFs for the proton and photon taken from [20]. Further background from QED-Compton scattering, lepton pair production via two-photon interactions, prompt photon production and heavy gauge boson () production are included in the background simulation. Further details are given in [1].
3.3 Polar Angle Measurement and Energy Calibration
In the neutral current analysis the polar angle of the scattered electron () is determined using the position of its energy deposit (cluster) in the LAr calorimeter, together with the interaction vertex reconstructed with tracks from charged particles in the event. The relative alignment of the calorimeter and tracking chambers is determined using a sample of events with a well measured electron track, using information from both the CJC and the drift chambers. Minimisation of the spatial discrepancy between the electron track and cluster allows the LAr calorimeter and the inner tracking chambers to be aligned. The residual discrepancy then determines the systematic uncertainty on the measurement of , which varies from mrad for to mrad for .
The calibration of the electromagnetic part of the LAr calorimeter is performed using the method described in [1]. Briefly, the redundancy of the detector information allows a prediction of the scattered electron energy () to be made based on the electron beam energy (), the polar angle measurement of the scattered electron and the inclusive polar angle () [1] of the hadronic final state. This prediction of the double angle (DA) kinematic reconstruction method [21] is then compared with the measured electromagnetic energy, allowing local calibration factors to be determined in a finely segmented grid in and . The calibration procedure is also performed on the simulated data. The final calibration is obtained by application of a further small correction determined from simulation, which accounts for small biases in the reconstruction of . The calibration is cross checked using independent data samples from QED-Compton scattering and two-photon pair production processes. The total systematic uncertainty on the absolute electromagnetic energy scale varies from in the backward part of the calorimeter to in the forward region, where statistics are limited.
The hadronic final state is measured using energy deposits in the LAr and SPACAL calorimeters supplemented by low momentum tracks. Isolated low energy calorimetric deposits are classified as noise and excluded from the analysis. The response of the detector to hadrons is calibrated by requiring transverse momentum conservation between the precisely calibrated scattered electron and the hadronic final state in NC events as described in [1]. The electron transverse momentum is defined as . The hadronic transverse momentum is determined from , where the summation is performed over all hadronic final state particles , assuming particles of zero rest mass.
Detailed studies and cross checks of the hadronic response of the calorimeter using the enlarged data sample have led to an improved understanding of the hadronic energy measurement. The calibration procedure is cross checked by requiring energy-momentum conservation, , with being the contribution of all hadronic final state particles . In addition, the reference scale may be taken from the double angle method prediction rather than from the scattered electron. These studies have allowed the systematic uncertainty on the hadronic scale to be reduced with respect to previous measurements [1, 3] in the region and . The uncorrelated part (see section 3.6) of the hadronic scale uncertainty is reduced to from previously.
Fig. 1 demonstrates the quality of the hadronic calibration in the stated region of and , showing the level of agreement between data and simulation after the calibration procedure. In fig. 1(a) the mean value of the ratio is shown. In fig. 1(b) the inelasticity , defined from the hadron reconstruction method [22] as , is compared with the DA variable . In this analysis, it is the relative difference between data and simulation that is relevant and good agreement is found to within . In addition a correlated uncertainty is considered, accounting for possible remaining biases in the reference scale used for the calibrations.
3.4 Neutral Current Measurement Procedure
Events from inelastic interactions are required to have a well defined interaction vertex to suppress beam-induced background. High neutral current events are selected by requiring a compact and isolated energy deposit in the electromagnetic part of the LAr calorimeter222Local detector regions are removed where the cluster of the scattered electron is not expected to be fully contained in the calorimeter, or where the trigger is not fully efficient.. The scattered electron is identified as the cluster of highest transverse momentum. In the central detector region, , the cluster has to be associated with a track measured in the inner tracking chambers.
As mentioned earlier, energy-momentum conservation requires . Restricting the measured to be greater than thus considerably reduces the radiative corrections due to initial state bremsstrahlung, where photons escape undetected in the backward direction. It also suppresses photoproduction background in which the scattered electron is lost in the backward beam-pipe and a hadron fakes the electron signal in the LAr calorimeter. Since the photoproduction background contribution increases with , the analysis is separated into two distinct regions where different techniques are employed to suppress this background. The nominal analysis is restricted to for and for . This limits the minimum to . The high- analysis is performed for , and . Here and are reconstructed using the scattered electron energy and angle, the so-called electron method.
The NC kinematics in the nominal analysis are reconstructed using the method [23], which uses , and and has good resolution and small sensitivity to QED radiative corrections over the accessible phase space. In the high- analysis the electron method gives the best resolution and is used to define the event kinematics.
The nominal data sample consists of about events. The comparison of the data and the simulation is shown in fig. 2 for the scattered electron energy and polar angle spectra and the distribution of , which are used in the reconstruction of and . All distributions are well described by the simulation, which is normalised to the luminosity of the data. In the nominal analysis the small photoproduction contribution is statistically subtracted using the background simulation.
In the high- analysis, the photoproduction background plays an increasingly important role, as low energies of the scattered electron are accessed. For this analysis, the calorimeter cluster of the scattered electron is linked to a well measured track having the same charge as the electron beam. This requirement removes a sizeable part of the background, where decays give rise to fake scattered electron candidates. The remaining background from photoproduction was estimated from the number of data events in which the detected lepton candidate has opposite charge to the beam lepton. This background is statistically subtracted assuming charge symmetry. The charge symmetry is determined to be by measuring the ratio of wrongly charged fake scattered lepton candidates in and scattering, taking into account the difference in luminosity. The charge symmetry is cross checked using a sample of data events in which the scattered electron is detected in the electron tagger and a systematic uncertainty of on the charge symmetry is assigned. Further details are given in [24, 25].
In total about events and events are selected in the high- analysis. Figs. 3(a)-(c) show the scattered lepton energy spectrum, the polar angle distribution and the spectrum for both the and data sets after background subtraction. The simulation, normalised to the luminosity of the data, provides a good description of these distributions. In fig. 3(d) the energy spectra of wrong charge lepton candidates in the data sets are shown. Good agreement is observed when the data are normalised to the luminosity of the data set.
3.5 Charged Current Measurement Procedure
The selection of charged current events requires a large missing transverse momentum, , assumed to be carried by an undetected neutrino. In addition the event must have a well reconstructed vertex as for the NC selection. The kinematic variables and are determined using the hadron kinematic reconstruction method [22]. In order to restrict the measurement to a region with good kinematic resolution the events are required to have . In addition the measurement is confined to the region where the trigger efficiency is by demanding . The background is dominantly due to photoproduction events in which the electron escapes undetected in the backward direction and missing transverse momentum is reconstructed due to fluctuations in the detector response or undetected particles. This background is suppressed using the ratio and the difference in azimuth between as measured in the main detector and the Plug calorimeter, [3]. The quantities and are respectively the transverse energy flow parallel and anti-parallel to , the transverse momentum vector of the hadronic final state. The residual background is negligible for most of the measured kinematic domain, though it reaches at the lowest and the highest . The simulation is used to estimate this contribution, which is subtracted statistically from the CC data sample with a systematic uncertainty of on the number of subtracted events. The non- background is rejected as described in [1] by searching for event topologies typical of cosmic ray and beam-induced background. For further details see [26, 27].
After all selection criteria are applied, the final CC data sample contains about events. The data and simulation are compared in fig. 4 for the and spectra, which are directly used in the reconstruction of the kinematic variables and . In both cases the simulation gives a reasonable description of the data.
3.6 Cross Section Measurement and Systematic Uncertainties
For both the NC and CC analyses the selected event samples are corrected for detector acceptance and migrations using the simulation and are converted to bin-centred cross sections. The bins in the plane are defined as in refs. [1, 3], based on the consideration of the detector resolution and event statistics. The bins used in the measurement are required to have values of stability and purity333The stability (purity) was defined in [1] as the number of simulated events which originate from a bin and which are reconstructed in it, divided by the number of generated (reconstructed) events in that bin. larger than . This restricts the range of the NC measurements to . The QED radiative corrections () are defined in [1] and were calculated using the program HERACLES [14] as implemented in DJANGO [12].
The systematic uncertainties on the cross section measurements are presented in tables 6-13. They are split into bin-to-bin correlated and uncorrelated parts. All the correlated systematic errors are found to be symmetric to a good approximation and are assumed so in the following. The total systematic error is formed by adding the individual errors in quadrature.
The correlated and uncorrelated systematic errors are discussed briefly below (see refs. [24, 26, 28, 27, 25] for more details). In addition, there is a global uncertainty of and on the luminosity measurement for the and data respectively, of which is common to both (see section 4.1).
-
•
The total uncertainty on the electron energy scale is if the impact position of the electron at the calorimeter surface () is in the backward part of the detector (), in the region , for and in the forward part (). The correlated part of the total uncertainty comes mainly from the possible bias of the calibration method and is estimated to be throughout the LAr calorimeter. It results in a correlated systematic error on the NC cross section which is typically below , increasing at low to for and for larger .
-
•
The correlated uncertainty on the electron polar angle is mrad, mrad and mrad for , and , respectively. This leads to a typical uncertainty on the NC reduced cross section of less than , increasing up to at high .
-
•
A () uncorrelated error originates from the electron identification efficiency in the NC nominal (high-) analysis for . For the uncertainty is increased to . The precision of this efficiency is estimated using an independent track based electron identification algorithm, limited for by statistics.
-
•
A uncorrelated error is assigned on the efficiency of the scattered electron track-cluster link requirement in the NC nominal analysis. In the high- analysis this is increased to .
-
•
An uncorrelated uncertainty on the hadronic energy measured in the LAr calorimeter is assigned for the region and . Outside this region the uncertainty is increased to . In addition, a correlated component to the uncertainty is added in quadrature, originating from the calibration method and from the uncertainty on the reference scale. This yields a total uncertainty of and for the two regions respectively.
-
•
The uncertainty on the hadronic energy scale of the SPACAL calorimeter is . The uncertainty on the hadronic energy measurement due to the inclusion of low momentum tracks is obtained by shifting their contribution by . The influence on the cross section measurements from these sources is small compared with that from the correlated uncertainty from the LAr calorimeter energy scale. The three contributions (LAr, SPACAL, tracks) are thus combined, resulting in a single correlated hadronic error from the hadronic energy measurement, which is given in the tables. The corresponding error on the NC and CC cross sections is typically , but increases at low to .
-
•
A uncertainty is assigned on the amount of energy in the LAr calorimeter attributed to noise, which gives rise to a sizeable correlated systematic error at low , reaching at and in the NC measurements.
-
•
In the CC analysis the correlated uncertainties due to the cuts against photoproduction on and are only significant at high , low and low , reaching a maximum of .
-
•
In the CC and the NC nominal analyses the photoproduction background is estimated from simulation. A correlated uncertainty on the subtracted photoproduction background is determined from a comparison of data and simulation for a phase space region dominated by photoproduction background. This results in a systematic error of typically .
-
•
In the NC high- analysis the photoproduction background is estimated directly from the data by using wrongly charged (fake) scattered lepton candidates, which leads to a correlated uncertainty on the subtracted photoproduction background. The resulting uncertainty on the measured cross sections is or less.
-
•
A uncorrelated error is considered on the trigger efficiency in the NC nominal analysis and in the CC analysis. For the NC high- analysis the uncertainty on the cross section is at low , decreasing to at the highest in the analysis.
-
•
An uncorrelated error of (NC) and (CC) is estimated on the QED radiative corrections by comparing the radiative corrections predicted by the Monte Carlo program (DJANGO) with those calculated from HECTOR and EPRC [29]. The error also accounts for a small missing correction in DJANGO due to the exchange of two or more photons between the electron and the quark lines.
-
•
A uncorrelated error is assigned on the event losses due to the non- background finders in the CC analysis, estimated from pseudo-CC data (see section 3.1).
-
•
A uncorrelated error ( for ) on the vertex finding efficiency for CC events is estimated using pseudo-CC data.
Overall a typical total systematic error of about () is reached for the NC (CC) double differential cross section. This precision has been achieved through detector improvements for triggering and a better understanding of the hadronic response of the detector, the electron identification and its angular measurement.
4 QCD Analysis
The cross section data presented here, together with the low precision data [30] and high data [1, 3] previously published by the H1 Collaboration, cover a huge range in and . The improved accuracy now available allows the predictions of perturbative QCD to be tested over four orders of magnitude in from about to above , and from below to . The measurements of NC and CC scattering cross sections provide complementary sensitivity to different quark distributions and the gluon distribution, . This is used to determine the sum of up-type , of down-type and of their anti-quark-type and distributions, employing only H1 inclusive cross section data.
With the current beam energies, the HERA collider data do not give access to the large region of deep inelastic scattering at medium (). Complementary information on quark distributions in this region is provided by fixed-target lepton-proton data. Lepton-deuteron scattering data, which provide further constraints on the PDFs, are not yet available from HERA. Therefore, in the subsequent analysis, the H1 data are also combined with the precise BCDMS muon-proton and muon-deuteron scattering data and the results are compared for cross checks of the PDFs obtained from the analysis of the H1 data alone.
4.1 Ansatz
Traditionally, QCD analyses of inclusive deep inelastic scattering cross section data have used parameterisations of the valence quark distributions and of a sea quark distribution, imposing additional assumptions on the flavour decomposition of the sea [1, 31, 32, 33]. The neutral and charged current cross section data presented here, however, are sensitive to four combinations of up- and down-type (anti-)quark distributions which, for less than the bottom quark production threshold, are given above in eq. 2. Working in terms of these combinations weakens the influence of necessary assumptions on the flavour decomposition of the sea in the fit. The valence quark distributions are obtained from
| (12) |
and are not fitted directly.
In the QPM, the charged current structure function terms are superpositions of the distributions given in eq. 2 according to
| (13) |
The neutral current structure function terms are dominated by the electromagnetic structure function , which can be written as
| (14) |
In the high neutral current data, complementary sensitivity is obtained from the interference structure function , but still higher luminosity is required to exploit this for a dedicated determination of the valence quarks.
In the fit to the H1 and BCDMS data, the isoscalar nucleon structure function is determined by the singlet combination of parton distributions and a small contribution from the difference of strange and charm quark distributions,
| (15) |
The nucleon data obtained from the BCDMS muon-deuteron cross sections are measured for . For these data nuclear corrections are applied following [34]. In eq. 15 the charm and strange quark distributions occur explicitly and may be constrained using experimental data as provided by H1 and ZEUS on the charm contribution to [35, 36] and from NuTeV on the strangeness content of the nucleon [37]. The analysis of the H1 data, however, is rather insensitive to these quark distributions. They are assumed to be fixed fractions of the up- and down-type quark distributions respectively at the initial scale of the QCD evolution (see section 4.2).
The analysis is performed in the renormalisation scheme using the DGLAP evolution equations [38] at NLO [39]. The structure function formulae given here are thus replaced by integral convolutions of coefficient functions and PDFs. An approach is used whereby all quarks are taken to be massless, including the charm and bottom quarks, which provides an adequate description of the parton distributions in the high kinematic range of the new data presented here. The bottom quark distribution, , is assumed to be zero for where is the bottom quark mass.
Fits are performed to the measured cross sections calculating the longitudinal structure functions to order and assuming the strong coupling constant to be equal to [7]. All terms in eqs. 1 and 7 are calculated, including the weak corrections, . The analysis uses an space program developed inside the H1 collaboration [40], with cross checks performed using an independent program [41]. In the fit procedure, a function is minimised which is defined in [30]. The minimisation takes into account correlations of data points caused by systematic uncertainties allowing the error parameters (see table 2), including the relative normalisation of the various data sets, to be determined by the fit. The fit to only H1 inclusive cross section data, termed H1 PDF , uses the data sets as specified in table 1. The table additionally lists the BCDMS data used in a further fit for comparison with the H1 PDF fit.
| data set | process | range | range | ref. | comment | |||
| (GeV2) | (GeV2) | |||||||
| H1 minimum bias | NC | [30] | ||||||
| H1 low | NC | [30] | ||||||
| H1 high | NC | [1] | ||||||
| H1 high | CC | [1] | ||||||
| H1 high | NC | [3] | ||||||
| H1 high | CC | [3] | ||||||
| H1 high | NC | this rep. | ; high- data | |||||
| H1 high | NC | this rep. | ; incl. high- data | |||||
| H1 high | CC | this rep. | ||||||
| BCDMS-p | NC | [4] | require | |||||
| BCDMS-D | NC | [4] | require | |||||
The correlated systematic uncertainties for the H1 cross section measurements may be correlated across data sets as well as between data points, since they may arise from the same source. They are thus not treated independently in the QCD analysis presented here. The relationship between the error sources as used in the fitting procedure is summarised in table 2 for each of the eight correlated systematics considered. This leads to independent error parameters. In addition, all H1 quoted luminosity uncertainties have a common contribution of arising from the theoretical uncertainty on the Bethe-Heitler cross section. This common contribution has been taken into account in the QCD analysis.
| data set | process | ||||||||
|---|---|---|---|---|---|---|---|---|---|
| H1 minimum bias | NC | ||||||||
| H1 low | NC | ||||||||
| H1 high | NC | ||||||||
| H1 high | CC | ||||||||
| H1 high | NC | ||||||||
| H1 high | CC | ||||||||
| H1 high | NC | ||||||||
| H1 high | CC |
4.2 Parameterisations
The initial parton distributions, , are parameterised at in the following general form
| (16) |
The QCD analysis requires choices to be made for the initial scale () and the minimum of the data considered in the analysis (). Variations of both and are studied. As in [30] is chosen to be and . Reasonable variations of these choices are considered as part of the model uncertainties on the parton distributions (section 5.3).
The general ansatz, eq. 16, represents an over-parameterisation of the data considered here. The specific choice of these parameterisations is obtained from saturation of the : an additional parameter , , or is considered only when its introduction significantly improves the . The appropriate number of parameters also depends on the data sets included in the fit. The H1 data requires less parameters than the combined H1 and BCDMS data due to the precise BCDMS proton and deuteron data in the large region, where the cross section variations with are particularly strong.
The fit to the H1 data uses the following functional forms
| (17) | |||||
in which the number of free parameters are further reduced using the constraints and assumptions detailed below.
The number of parameters required by the fit for the different parton distributions follows the expectation. A high term is not needed in the gluon distribution, since at large the scaling violations are due to gluon bremsstrahlung, i.e. are independent of the gluon distribution. The and distributions require more parameters than the anti-quark distributions and because the former are a superposition of valence and sea quarks, in contrast to the latter. Due to the different electric charges, , and the dependence of the charged current cross section, the data are much more sensitive to the up quark than to the down quark distributions. Thus less parameters are needed for than for .
A number of relations between parameters can be introduced naturally in this ansatz. At low the valence quark distributions are expected to vanish and the sea quark and the anti-quark distributions can be assumed to be equal. Thus the low parameters and are required to be the same for and for . In the absence of deuteron data from HERA there is no distinction possible of the rise towards low between and . Thus the corresponding parameters are required to be equal, i.e. . Further constraints are the conventional momentum sum rule and the valence quark counting rules.
The ansatz presented above allows the quark distributions to be determined. Further disentangling the individual quark flavour contributions to the sea is possible only with additional experimental information and/or assumptions. Assuming that the strange and charm sea quark distributions and can be expressed as -independent fractions and of and at the starting scale of (see table 5), a further constraint is used in the fit: , which imposes that as .
The total number of free parameters of the five parton distributions is thus equal to in the fit to the H1 data. The value is hardly improved by including any half integer power of . The parametric form of eq. 4.2 is also found starting from an alternative polynomial in , which includes half integer powers up to . The addition of the large BCDMS and data leads to two additional terms, and , in the polynomials.
5 Results
5.1 NC and CC Cross Sections , and
The single differential neutral current cross section measured for is shown in fig. 5(a). The data are compared with previous H1 measurements made at . The new cross sections are found to be higher than the measurement from as expected due to the increase in centre-of-mass energy. Both cross sections, falling by over six orders of magnitude for the measured region between and , are well described by the H1 PDF fit. The error band represents the total uncertainty as derived from the QCD analysis by adding in quadrature the experimental and model uncertainty. The experimental uncertainty on the predicted cross sections is significantly larger than the model uncertainty, which is discussed in section 5.3. Fig. 5(b) shows the ratios of the measurements to the corresponding Standard Model expectation determined from the H1 PDF fit. Note that in this lower figure the H1 data are scaled by the normalisation shift imposed by the QCD fit given in table 3. The new data are given in table 6.
The dependence of the charged current cross section from the data is shown in fig. 6(a). For consistency with the NC cross sections, the data are presented in the range , after correction444The correction factors are given in table 7. for the kinematic cuts and (section 3.5). The data are compared with the previous measurement taken at lower centre-of-mass energy. The ratios of data to expectations are shown in fig. 6(b) together with the Standard Model uncertainty. Again in this lower figure the H1 data are scaled by the normalisation shift imposed by the QCD fit, given in table 3. The two data sets agree well with each other, though the new data have a tendency to be higher than the fit result at high . The data are listed in table 7.
Fig. 7 shows the dependences of the NC and CC cross sections representing the total and data sets taken at HERA-I. The data have been combined after scaling the data to , using the H1 PDF fit and the procedure described in [27]. At low the NC cross section exceeds the CC cross section by more than two orders of magnitude. The sharp increase of the NC cross section with decreasing is due to the dominating photon exchange cross section with the propagator term . In contrast the CC cross section () approaches a constant at low . The CC and NC cross sections are of comparable size at , where the photon and exchange contributions to the NC cross sections are of similar size to those of exchange. These measurements thus illustrate unification of the electromagnetic and the weak interactions in deep inelastic scattering. While the difference in NC cross sections between and scattering is due to interference, the difference of CC cross sections arises from the difference between the up and down quark distributions and the less favourable helicity factor in the cross section (see eq. 13).
The single differential cross sections are measured for for both NC and CC and also for in the NC case. The NC data are compared in fig. 8 with the previous H1 measurement at and the corresponding expectations from the fit. A similar comparison for the CC data is shown in fig. 9. Increases with are observed in both the NC and the CC cross sections, in agreement with the expectations. The fall in the cross sections at low is due to the restriction . The measurements are summarised in tables 8-10.
The total CC cross section has been measured in the region and after applying a small correction factor of for the and cuts, determined from the H1 PDF fit. The result is
where the normalisation uncertainty is included in the systematic error. This is to be compared with the value from the H1 PDF fit . The difference between the measurement and the fit is standard deviations assuming the correlation of uncertainties between measurement and fit is negligible. An unbiased theoretical expectation for may be obtained by repeating the H1 PDF fit but excluding the new CC data, which leads to .
Additionally, the analysis has been performed on the data set at the lower centre-of-mass energy, yielding
5.2 NC and CC Double Differential Cross Sections
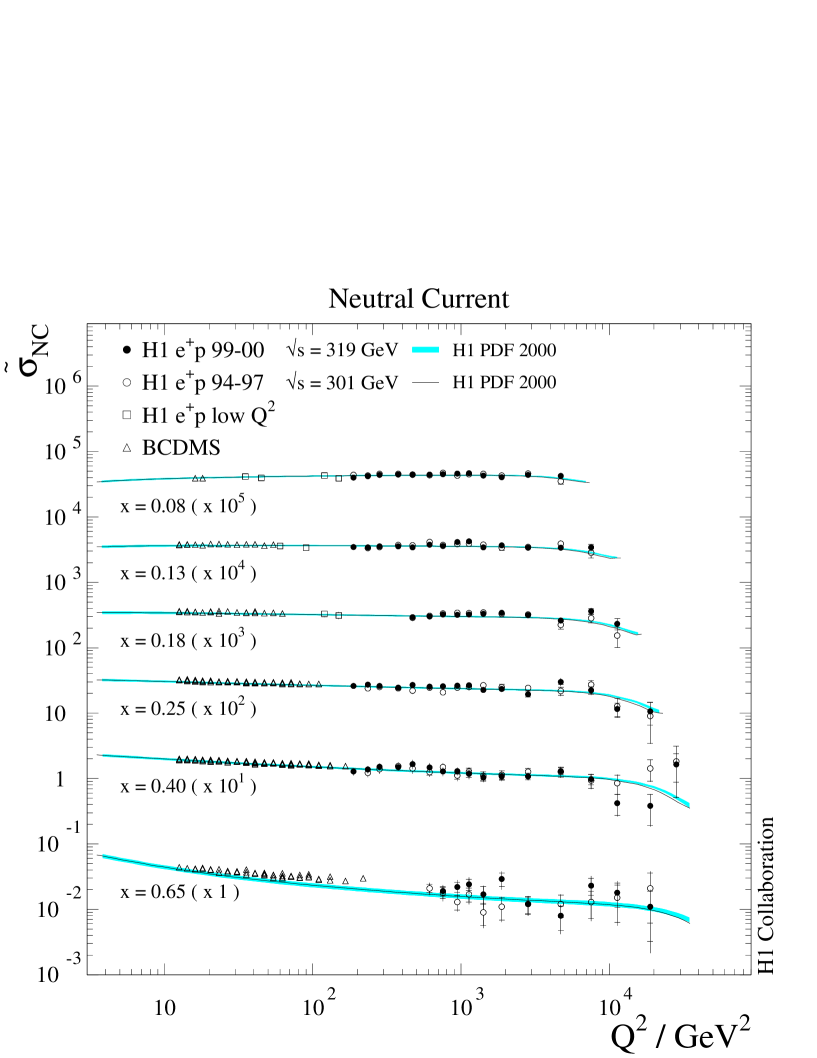
The double differential NC reduced cross section, (defined in eq. 11), is shown in fig. 10 for both the nominal and high- data. In addition the new high- data are presented. The data agree well with the expectations of the H1 PDF fit, which are also shown555The normalisation factors as determined by the QCD fit (table 3) are not applied to the data shown in the figure.. The rise of the Standard Model DIS cross section towards low (high ) departs from the monotonic behaviour of due to the contribution of the longitudinal structure function . This allows to be determined in the high region (section 5.5).
In fig. 11 the NC large cross section data at are compared with the data obtained previously [1] at . The two data sets are found to be in agreement with each other and with the H1 PDF fit. Fig. 11 also shows the data from the recent H1 measurement at lower [30] and the fixed-target data from BCDMS [4]. The fit description of the BCDMS data, which are not used in the fit, is remarkably good except at very large . A similar observation has already been reported in [1, 30]. At the highest a decrease of the cross section is expected due to the negative interference in scattering.
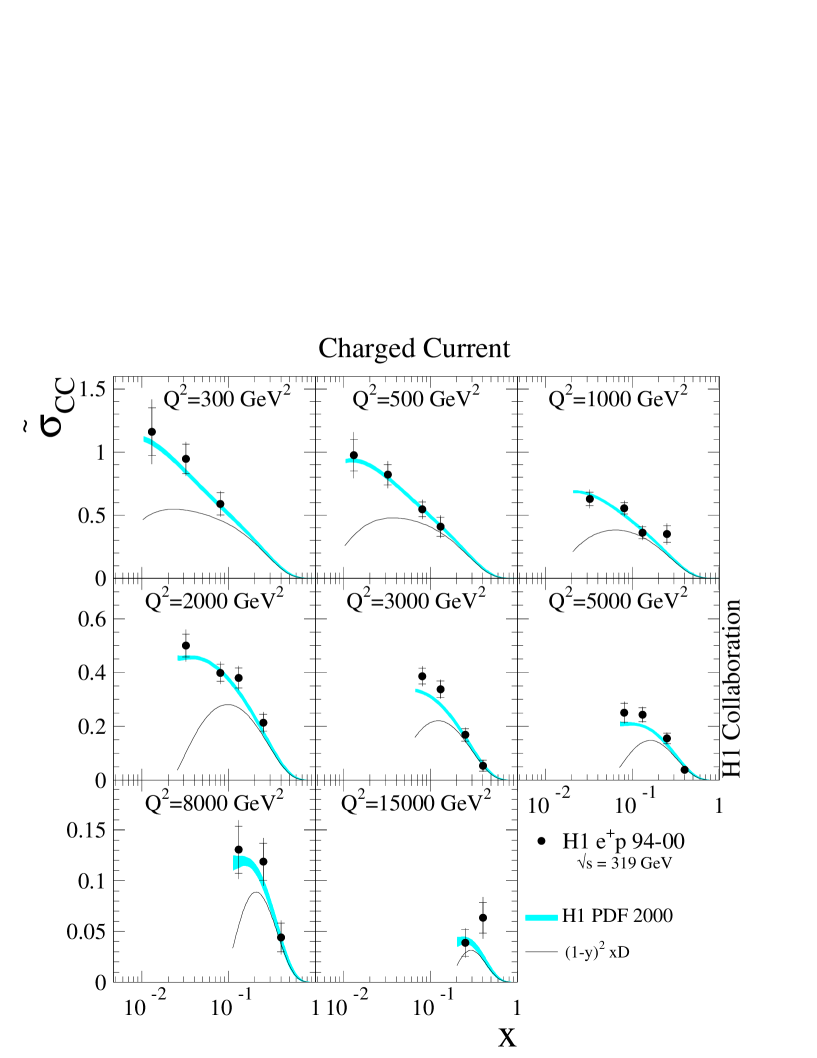
In fig. 12 the reduced CC cross section, (defined in eq. 11), is shown for the new data and the data taken at lower energy between and . These data are found to be compatible with each other considering the weak energy dependence of the reduced CC cross section. An extension of the range for and is achieved due to the improved trigger efficiency. The combined result is compared in fig. 13 with the expectation from the H1 PDF fit. Also shown is the expected contribution of the distribution, which dominates the cross section at large . The HERA CC data can thus be used to constrain the quark distribution in the valence region.
5.3 Fit Results
In this section, the results of the QCD analysis are presented. The value for each data set is given in table 3 as well as the optimised relative normalisation as determined from the fit. The total value666In the calculation of the , the assumption is made that the uncorrelated errors among different data points within one data set stay uncorrelated with the corresponding data points from an independent data set. per degree of freedom (/ndf) is . The NLO QCD fit requires the lowest data (H1 minimum bias , ) to be raised by , corresponding to standard deviations in terms of the normalisation uncertainty excluding the common error of (see section 4.1). In contrast all data for are lowered, by at most . It can not yet be decided whether this behaviour is due to inadequacies in the theory (e.g. the missing higher order terms in ) or experimental effects.
| data set | process | data points | (unc. err.) | (corr. err.) | normalisation |
| H1 minimum bias | NC | ||||
| H1 low | NC | ||||
| H1 high | NC | ||||
| H1 high | CC | ||||
| H1 high | NC | ||||
| H1 high | CC | ||||
| H1 high | NC | ||||
| H1 high | CC | ||||
| Total | |||||
The parameters of the initial parton distributions are given in table 4 (see also [42]) and the distributions are shown in fig. 14. The inner error band describes the experimental uncertainty, while the outer band represents the experimental and model uncertainties added in quadrature.
The experimental accuracy of the initial distributions is typically a few percent in the bulk of the phase space of the H1 data. This accuracy has negligible dependence on but a strong dependence on . The best precision is achieved for the quark distribution, which amounts to about for and reaches and at and , respectively. The quark distribution is only determined with moderate precision as it is predominantly constrained by the CC cross sections, which are still subject to limited precision. The corresponding uncertainties on at the three quoted values are respectively , and .
These uncertainties reflect the kinematic dependence and size of the measurement errors. However the error size also depends significantly on the fit assumptions. If, for example, the constraint between and on the low behaviour of the anti-quark distributions is relaxed, the small uncertainty at low is much increased to and respectively for and . The measurement of the low behaviour of up and down quarks and their possible distinction requires electron-deuteron data to be taken at HERA.
The model parameter uncertainties on the PDFs are determined in a similar manner to [30] and the sources of uncertainty are specified in table 5. The model uncertainties are relatively small with respect to those from experimental sources except at small and low , where they reach and respectively for and at and .
Within the functional form considered (see eq. 16), the parameterisation given in eq. 4.2 is found uniquely. Possible variations within the region of the parameter space do not lead to noticeably different distributions. Thus in this analysis no account is made of uncertainties due to the choice of parameterisations. A completely different ansatz, however, may well lead to different initial distributions, as seen, for example, in the complicated shape of chosen in [33]. The gluon distribution determined in this analysis is consistent with the distribution obtained previously by H1 [30] if the effects of the different heavy flavour treatments are taken into account.
| source of uncertainty | central value | variation | |
|---|---|---|---|
| (GeV) | |||
| (GeV) | |||
| , strange fraction of | |||
| , charm fraction of | |||
| (GeV) | |||
| (GeV) | |||
The full curve in fig. 14 is the result [43] of the fit to H1 and BCDMS data, which gives a /ndf. Excellent agreement of the PDFs between the two fits is observed. For large , the high data of H1 allow distinction between up and down flavours yielding results compatible with those from BCDMS proton and deuteron data. At low only HERA data are available and thus the two fits are forced to be in agreement, apart from possible small effects due to sum rules.
The PDFs from the H1 PDF fit are further compared in fig. 15 with recent results from the MRST [32] and CTEQ [33] groups for two values of at and . The H1 PDF fit is in remarkable agreement with the MRST and in particular the CTEQ analyses, given the many differences in terms of the data sets used, the assumptions made and the treatment of heavy flavours.
5.4 Extraction of the Proton Structure Function
The NC structure function term is obtained from the measured NC double differential cross section according to eq. 1. It is dominated by the structure function in most of the kinematic range. The structure function is extracted using
| (18) |
Here the correction terms and account for the effects of exchange on and (eqs. 2-4) and originates from the longitudinal structure function . These corrections, shown in table 11, are determined using the H1 PDF fit (see section 4). At high and , is sizeable and the extraction of in this region is thus restricted to the kinematic range . It is extended to higher at larger () where the predicted contribution of is small.
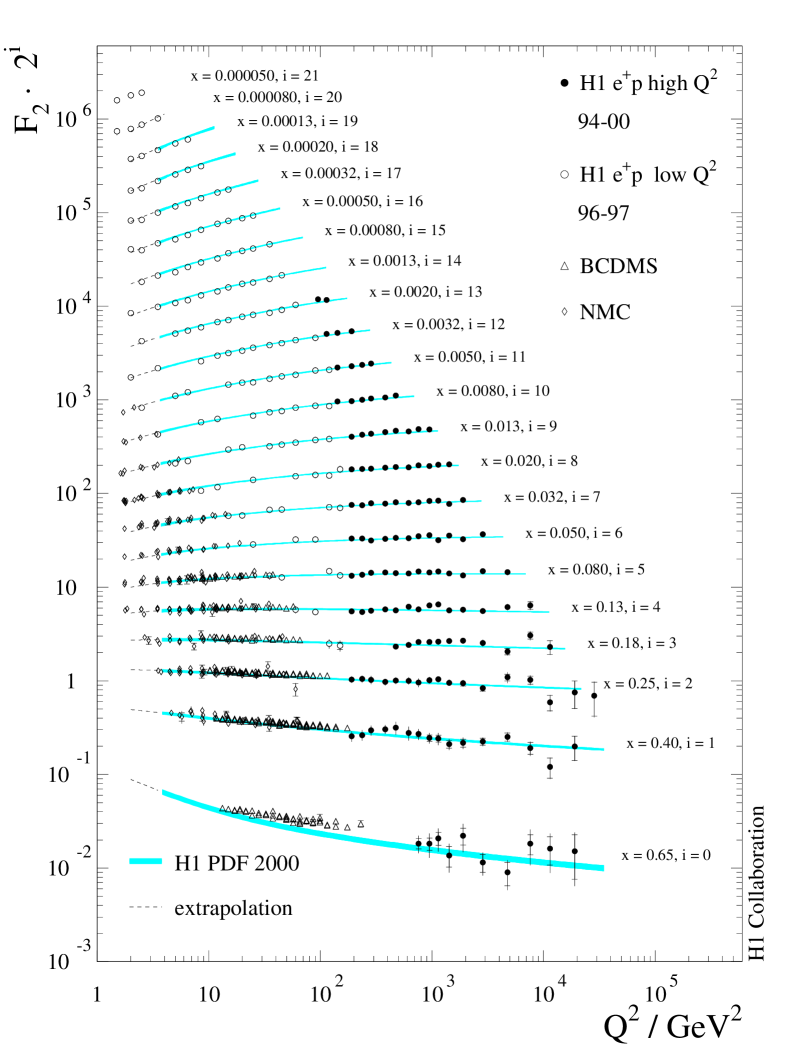
The extracted using the data is presented in table 11. Fig. 16 shows the data using the combined and high data sets. Also shown in the figure are the recent H1 data at lower [30] and structure function data from BCDMS [4] and NMC [44]. The full H1 data cover a range of four orders of magnitude in and . The H1 PDF fit provides a good description of the data over the whole region except for the BCDMS data at , as seen in fig. 11. The fit also gives a good description of the scaling violations observed in the measurements.
5.5 Determination of the Longitudinal Structure Function
The structure function term is used to determine at and . For statistical reasons, the measured cross sections in two neighbouring bins are combined, assuming that the systematic uncertainties are fully correlated. The longitudinal structure function is then determined using the formula
| (19) |
for scattering which, neglecting the small electroweak contributions in the region of this extraction, reduces to the expression
| (20) |
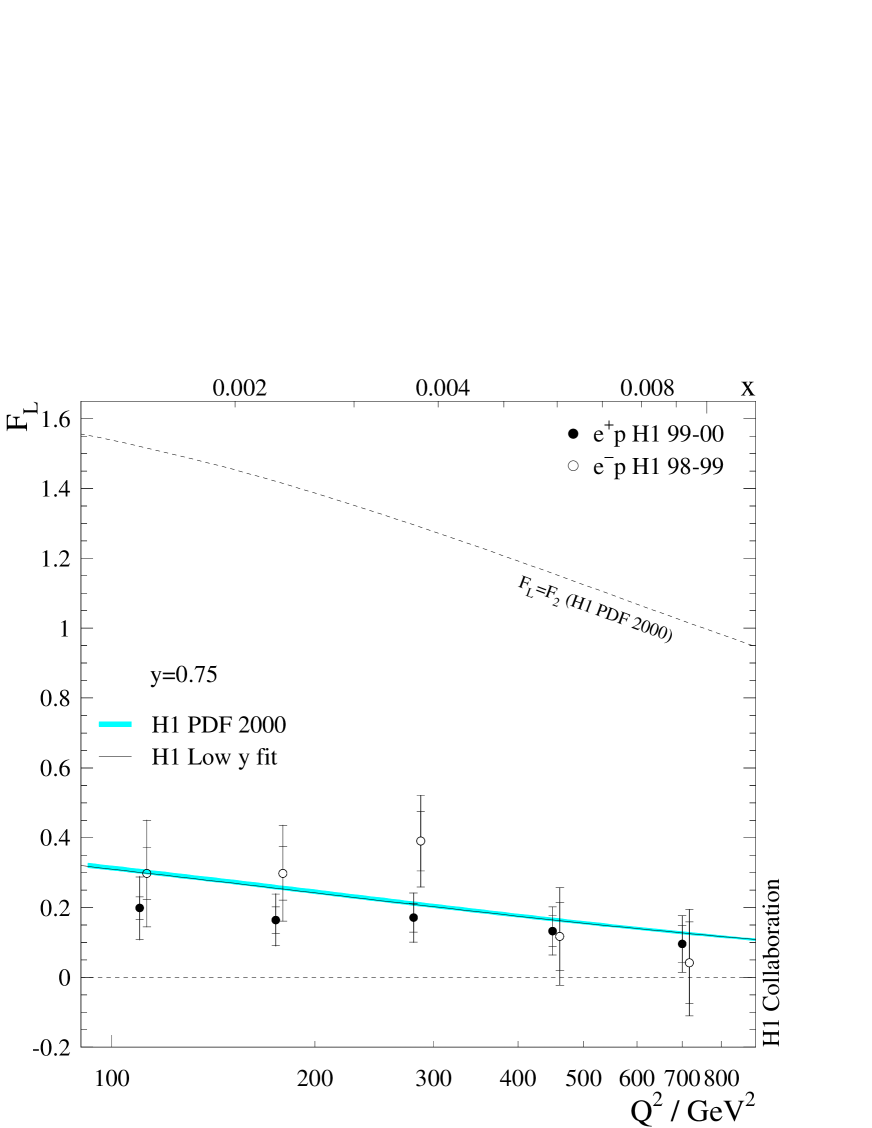
The extraction of relies upon the extrapolation of the fit result for into the high region, that is, to larger for given . In order to avoid a possible influence of the high data region on this calculation, a dedicated NLO QCD fit (H1 Low fit) is performed to H1 data with only and the results are extrapolated using the DGLAP evolution equations. This method was introduced in [45].
Apart from the range restriction, the H1 Low fit follows the same procedure as described in section 4. It results in a ndf and agrees very well with the H1 PDF fit over the full range. The normalisation shifts of the data sets used are found to be within of those from the H1 PDF fit.
In the extraction of the longitudinal structure function, the experimental cross sections are slightly modified using the results of the H1 Low fit for the renormalisation and small shifts from the correlated uncertainties common to the low and the high region. The combined HERA-I measurements of the structure function term and the extracted values of are listed in table 14. The statistical precision is due directly to the cross section measurement at high . The systematic uncertainties arise from the measurement errors at high and the model uncertainties related to the extrapolation of from the low to the high region. The correlations in the systematic uncertainties between low and high are taken into account.
In fig. 17 the determinations of at high are shown for both the and the data sets. The results from both data sets are mutually consistent and are in agreement with the H1 Low fit prediction for , based on the gluon distribution derived from the scaling violations of at larger . The extreme values allowed for ( and ) are clearly excluded by the data. A model independent measurement of and the dependence can, however, only be achieved with reduced beam energies at HERA.
5.6 Measurement of the Generalised Structure Function
At high , the NC cross section in scattering has been observed to be significantly smaller than that in scattering [3], confirming the Standard Model expectation of interference. These earlier H1 data were used to obtain a first measurement of the generalised structure function in the kinematic range and [3]. A similar measurement has been reported recently by ZEUS [46].
Profiting from the enlarged statistics and the reduced systematic uncertainties, the previous measurement of [3] is updated here by using the same published and the full data obtained by H1 at HERA-I. Fig. 18(a) shows the comparison of the and data for three different values at , and , together with the expectations determined from the H1 PDF fit. The generalised structure function , given in table 15, is obtained from
| (21) |
and is compared in fig. 18(b) with the calculation. Since at high and low the expected sensitivity to is smaller than the luminosity uncertainty, the measurement is not performed in this region. The dominant contribution to arises from interference, which allows to be extracted (eq. 4) according to by neglecting the pure exchange contribution, which is suppressed by the small vector coupling . This structure function is non-singlet and has little dependence on . This is illustrated in fig. 18(c). The measured at these values can thus be averaged taking into account the small dependence. The two lowest bins at and are averaged as well. The averaged , determined for a value of , is shown in table 15 and fig. 18(d) in comparison with the QCD fit result. The structure function determines both the shape and magnitude of the valence quark distributions independent of the sea quark distributions. The calculation from the QCD fit, in which the parton densities in the valence region are principally constrained by the NC and CC cross sections rather than the difference between the NC cross sections, gives a good description of the measurement. The averaged structure function is integrated [47] over the measured range, yielding
which is in agreement with , as predicted from the H1 PDF fit.
5.7 The Quark Distributions and at Large
The flavour composition of the proton at high may be disentangled by exploiting the NC and CC cross section measurements. The CC cross section at large is dominated by the quark contribution as may be inferred from fig. 13. Similarly the distribution dominates the CC and NC cross sections at large . Using data points for which the or contribution provides at least of the cross section, as determined from the H1 PDF fit, the up and down quark distributions are determined locally, using the method described in [1, 27]. The extraction relies on weighting the differential cross section measurement with the calculated local flavour contribution and is illustrated in fig. 19, where is the combined result from three independent extractions from the NC and CC data and is determined from the CC data only. This method is complementary to performing a QCD fit, since it is based on the local cross section measurements and is less sensitive to the parameterisations and dynamical assumptions used in the fit.
The extracted and distributions are further compared in fig. 19 with the results of the H1 PDF fit by subtracting and from the fitted and . The two determinations are in good agreement. They also compare well with the recent parameterisations from the MRST [32] and CTEQ [33] groups except for at large , where the results of MRST and CTEQ, being constrained mainly by the BCDMS data, yield a larger up quark distribution.
6 Summary
New measurements are presented of inclusive deep inelastic neutral and charged current scattering cross sections at high momentum transfers from recent data recorded in and by the H1 experiment at HERA. This analysis, together with previous analyses of the and data, completes the H1 measurements of the inclusive cross sections at high from the first phase of HERA operation.
The accuracy of the neutral current (NC) measurements presented here has reached the level of a few percent in the medium range of . The very high NC and charged current (CC) data are still limited by their statistical precision, which is expected to improve in the high luminosity phase of HERA.
For both and scattering data, the region of very large inelasticity is explored, which allows a determination of the longitudinal structure function for the first time in the large momentum transfer range, . The observed interference of the photon and exchange, differing between and NC scattering at high , is used to measure the structure function , superseding the earlier measurement.
The NC and CC cross sections in scattering are sensitive to the sums of up- and down-type quark and anti-quark distributions, , , and . Based on these quark distribution decompositions, a novel NLO QCD analysis is performed, resulting in a first determination of the partonic nucleon structure from inclusive DIS scattering data from H1 alone. The experimental precision achieved in this analysis is about and respectively for and at . The resulting parton distributions are found to be in agreement with those obtained in an analysis also including the BCDMS muon-nucleon data at large . The QCD analysis leads to a good description of all the fitted NC and CC cross section data and of the derived structure functions over more than four orders of magnitude in and .
Acknowledgments
We are grateful to the HERA machine group whose outstanding efforts have made this experiment possible. We thank the engineers and technicians for their work in constructing and maintaining the H1 detector, our funding agencies for financial support, the DESY technical staff for continual assistance, and the DESY directorate for support and for the hospitality which they extend to the non-DESY members of the collaboration. We would like to thank D. Y. Bardin, T. Riemann and H. Spiesberger for helpful discussions.
References
- [1] C. Adloff et al. [H1 Collaboration], Eur. Phys. J. C 13 (2000) 609 [hep-ex/9908059].
- [2] J. Breitweg et al. [ZEUS Collaboration], Eur. Phys. J. C 11 (1999) 427 [hep-ex/9905032]; J. Breitweg et al. [ZEUS Collaboration], Eur. Phys. J. C 12 (2000) 411 [hep-ex/9907010].
- [3] C. Adloff et al. [H1 Collaboration], Eur. Phys. J. C 19 (2001) 269 [hep-ex/0012052].
- [4] A. C. Benvenuti et al. [BCDMS Collaboration], Phys. Lett. B 223 (1989) 485.
-
[5]
H. Spiesberger et al., Proceedings of the Workshop
“Physics at HERA”, vol. 2,
eds. W. Buchmüller, G. Ingelman, DESY (1992) 798. - [6] M. Klein and T. Riemann, Z. Phys. C 24 (1984) 151.
- [7] D. E. Groom et al. [Particle Data Group Collaboration], Eur. Phys. J. C 15 (2000) 1.
- [8] A. Arbuzov et al., Comput. Phys. Commun. 94 (1996) 128 [hep-ph/9511434].
- [9] I. Abt et al. [H1 Collaboration], Nucl. Instrum. Meth. A 386 (1997) 310; I. Abt et al. [H1 Collaboration], Nucl. Instrum. Meth. A 386 (1997) 348.
- [10] B. Andrieu et al. [H1 Calorimeter Group Collaboration], Nucl. Instrum. Meth. A 336 (1993) 460.
- [11] R. D. Appuhn et al. [H1 SPACAL Group Collaboration], Nucl. Instrum. Meth. A 386 (1997) 397.
-
[12]
G.A. Schuler and H. Spiesberger,
Proceedings of the Workshop “Physics at HERA”,
vol. 3, eds. W. Buchmüller, G. Ingelman, DESY (1992) 1419. -
[13]
G. Ingelman, Proceedings of the Workshop “Physics at HERA”, vol. 3
eds. W. Buchmüller, G. Ingelman, DESY (1992) 1366. - [14] A. Kwiatkowski, H. Spiesberger and H. J. Möhring, Comput. Phys. Commun. 69 (1992) 155.
- [15] L. Lönnblad, Comput. Phys. Commun. 71 (1992) 15.
- [16] T. Sjöstrand and M. Bengtsson, Comput. Phys. Commun. 43 (1987) 367.
- [17] A. D. Martin, W. J. Stirling and R. G. Roberts, Phys. Rev. D 50 (1994) 6734 [hep-ph/9406315].
- [18] R. Brun et al., GEANT3 User’s Guide, CERN-DD/EE-84-1 (1987).
- [19] T. Sjöstrand, Comput. Phys. Commun. 82 (1994) 74.
- [20] M. Glück, E. Reya and A. Vogt, Phys. Rev. D 46 (1992) 1973.
- [21] S. Bentvelsen et. al., Proceedings of the Workshop “Physics at HERA”, vol. 1, eds. W. Buchmüller, G. Ingelman, DESY (1992) 23; C. Hoeger, ibid., 43.
- [22] A. Blondel and F. Jacquet, Proceedings of the Study of an Facility for Europe, ed. U. Amaldi, DESY 79/48 (1979) 391.
- [23] U. Bassler and G. Bernardi, Nucl. Instrum. Meth. A 361 (1995) 197 [hep-ex/9412004]; U. Bassler and G. Bernardi, Nucl. Instrum. Meth. A 426 (1999) 583 [hep-ex/9801017].
- [24] A. Dubak, Ph.D. Thesis, Max-Planck-Institut für Physik, Munich, in preparation., also at http://www-h1.desy.de/publications/theses list.html.
- [25] B. Reisert, Ph.D. Thesis, Max-Planck-Institut für Physik,Munich, MPI-PhE/2000-26, also available at http://www-h1.desy.de/publications/theses list.html.
- [26] J. Rauschenberger, Ph.D. Thesis, Hamburg University, 2002, also available at http://www-h1.desy.de/publications/theses list.html.
- [27] Z. Zhang, Habilitation Thesis, LAL preprint, LAL 00-57 (2000) [hep-ph/0012249].
- [28] B. Heinemann, Ph.D. Thesis, Hamburg University, 1999, DESY-THESIS-1999-046, also available at http://www-h1.desy.de/publications/theses list.html.
- [29] H. Spiesberger, Proceedings of the Workshop “Future Physics at HERA”, vol. 1, eds. G. Ingelman, A. De Roeck, R. Klanner, DESY (1996) 227.
- [30] C. Adloff et al. [H1 Collaboration], Eur. Phys. J. C 21 (2001) 33 [hep-ex/0012053].
- [31] S. Chekanov et al. [ZEUS Collaboration], accepted by Phys. Rev. D [hep-ex/0208023].
- [32] A. D. Martin, R. G. Roberts, W. J. Stirling and R. S. Thorne, Eur. Phys. J. C 23 (2002) 73 [hep-ph/0110215].
- [33] J. Pumplin et al., JHEP 0207 (2002) 012 [hep-ph/0201195].
- [34] W. Melnitchouk and A. W. Thomas, Phys. Rev. C 52 (1995) 3373 [hep-ph/9508311].
- [35] C. Adloff et al. [H1 Collaboration], Phys. Lett. B 528 (2002) 199[hep-ex/0108039].
- [36] J. Breitweg et al. [ZEUS Collaboration], Eur. Phys. J. C 12 (2000) 35 [hep-ex/9908012].
- [37] M. Goncharov et al. [NuTeV Collaboration], Phys. Rev. D 64 (2001) 112006 [hep-ex/0102049].
-
[38]
Y. L. Dokshitzer,
Sov. Phys. JETP 46 (1977) 641
[Zh. Eksp. Teor. Fiz. 73 (1977) 1216];
V. N. Gribov and L. N. Lipatov, Yad. Fiz. 15 (1972) 1218 [Sov. J. Nucl. Phys. 15 (1972) 675];
V. N. Gribov and L. N. Lipatov, Yad. Fiz. 15 (1972) 781 [Sov. J. Nucl. Phys. 15 (1972) 438];
G. Altarelli and G. Parisi, Nucl. Phys. B 126 (1977) 298. - [39] W. Furmanski and R. Petronzio, Phys. Lett. B 97 (1980) 437.
-
[40]
C. Pascaud and F. Zomer, LAL preprint, LAL 95-05 (1995);
C. Pascaud and F. Zomer, hep-ph/0104013. -
[41]
M. Botje, QCDNUM15 program, unpublished;
J. Blümlein et al., Proceedings of the Workshop “Future Physics at HERA”, vol. 1, eds. G. Ingelman, A. De Roeck, R. Klanner, DESY (1996) 23. - [42] See http://www-h1.desy.de/psfiles/figures/d03-038.h1pdf2000.errcor for the uncertainties on the parameters and their correlations.
- [43] See http://www-h1.desy.de/psfiles/figures/d03-038.hbfit2000.results for the details of the fit to H1 and BCDMS data.
- [44] M. Arneodo et al. [New Muon Collaboration], Phys. Lett. B 364 (1995) 107 [hep-ph/9509406].
- [45] C. Adloff et al. [H1 Collaboration], Phys. Lett. B 393 (1997) 452 [hep-ex/9611017].
- [46] S. Chekanov et al. [ZEUS Collaboration], [hep-ex/0208040].
- [47] E. Rizvi and T. Sloan, Eur. Phys. J. C, EPJ C direct, 3 (2001) N2 [hep-ex/0101007].


|
|
|||||||||||||||||||||
|
|
|||||||||||||||
| data | |||||||
| data | |||||||