A Study of the Spectrum and Search for a Exotic Meson
Abstract
A partial wave analysis (PWA) of the of the system (where ) produced in the charge exchange reaction at an incident momentum of 18 GeV is presented as a function of invariant mass, , and momentum transfer squared, , from the incident to the outgoing system. , and waves were included in the PWA. The and states are clearly observed in the overall effective mass distribution as well as in the amplitudes associated with wave and waves respectively after partial wave decomposition. The observed distributions in moments (averages of spherical harmonics) were compared to the results from the PWA and the two are consistent. The distribution in for individual waves associated with natural and unnatural parity exchange in the -channel are consistent with Regge phenomenology. Of particular interest in this study is the wave since this leads to an exotic for the system. A wave is present in the data, however attempts to describe the mass dependence of the amplitude and phase motion with respect to the wave as a Breit-Wigner resonance are problematic. This has implications regarding the existence of a reported exotic meson decaying into with a mass near 1.4 GeV.
pacs:
13.20.Jx;14.40.CsI Introduction
The observation nearly four decades ago that mesons are grouped in nonets, each characterized by unique values of – spin (), parity () and charge conjugation () quantum numbers – led to the development of the quark model. Within this picture, mesons are bound states of a quark () and antiquark (). The three light-quark flavors (, and ) suffice to explain the spectroscopy of most – but not all – of the lighter-mass mesons (i.e. below 3 GeV) that do not explicitly carry heavy flavors (charm or beauty). Early observations yielded only those quantum numbers consistent with a fermion-antifermion bound state. The quantum numbers of a system with total quark spin, , and relative angular momentum , , are determined as follows: , and . Thus quantum numbers such as , , and are not allowed and are called exotic in this context.
Our understanding of how quarks form mesons has evolved within quantum chromodynamics (QCD) and we now expect a richer spectrum of mesons that takes into account not only the quark degrees of freedom but also the gluonic degrees of freedom. Gluonic mesons with no quarks (glueballs) are expected. These are bound states of gluons and since the quantum numbers of low-lying glueballs are not necessarily exotic, they should manifest themselves as extraneous states that cannot be accommodated within nonets. Indeed there is evidence for a glueball state CBglue based on overpopulation of the scalar nonet but identification is complicated since the observed states can be a mixture of a glueball and . Excitations of the gluonic field binding the quarks can also give rise to so-called hybrid mesons that can be viewed as bound states of a quark, anti-quark and valence gluon (). An alternative picture of hybrid mesons, one supported by lattice QCD, is one in which a gluonic flux tube forms between the quark and anti-quark and the excitations of this flux tube lead to so-called hybrid mesons Isg85 . Conventional mesons arise when the flux tube is in its ground state. Some hybrid mesons can have a unique signature, exotic , and therefore the spectroscopy of exotic hybrid mesons is not complicated by possible mixing with conventional states. According to the flux-tube model Isg85 and lattice gauge calculations Be97 , one expects the lightest exotic hybrid to have a mass of about 1.9 GeV. In contrast, calculations based on the MIT bag model deViron ; Bar82 ; Jaffe place the mass of the lightest hybrid meson at about 1.4 GeV.
The spectroscopy of exotic mesons provides an attractive starting point for the study of gluonic excitations. Since flux tubes are thought to be responsible for the confinement mechanism in QCD, experimental information on this spectroscopy is of fundamental importance.
I.1 Experimental situation
After about two decades of experimental searches there have been reports of experimental observations of states with by the Brookhaven E852 collaboration in interactions at 18 GeV. One of these has a mass of () MeV and width of () MeV and decays into Adams98 ; SUC2002 and another has a similar mass, () MeV, but a larger width,() MeV, and decays into Ivanov2001 . The E852 collaboration also reported observation of another state with mass () MeV and a width of () MeV decaying into DRT97 ; SUC1999 . If an system is in a wave, the resulting quantum number combination is exotic (). Critical to the identification of this state is not only showing the presence of a wave, but also that the resulting line shape is consistent with a Breit-Wigner and that the phase motion of the , as determined by its interference with the dominant wave cannot be due solely to the resonance. Soon after the E852 report, the Crystal Barrel Collaboration reported an exotic state produced in obtained by stopping antiprotons in liquid deuterium Abe98 . They reported a mass of () MeV and a width of () MeV. A later analysis of supported this evidence for an exotic state Abe99 .
The first claim of an exotic meson decaying into with a mass of 1400 MeV was made by the GAMS collaboration in the reaction Alde88 but a later analysis by the group Yu95 led to ambiguous results. The VES collaboration also presented evidence for a P-wave contribution in Bela93 and at KEK a claim was made for an exotic state Aoy93 as well but with a mass and width close to that of the and leakage from the dominant wave could not be excluded.
Indeed, in all the observations, the wave enhancements have cross sections that are substantially smaller than the dominant so this leakage, usually due to an imperfect understanding of experimental acceptance, is a source of concern. For example, an observed enhancement in the wave in the system at low mass was reported in references Adams98 ; SUC2002 as being due to leakage. Apart from these experimental issues, the interpretation of the nature of low-mass wave amplitude and phase motion should be guided by the principle of parsimony – less exotic interpretations must also be considered.
This work presents a partial wave analysis (PWA) of the system produced in interactions at an incident momentum of 18 GeV using the E852 apparatus. In this analysis both the and are detected through their decays. The starting point uses data corresponding to the reaction . A subset of these data correspond to and the partial wave analysis of the system has been reported on in an earlier publication gunter2001 . Here we present the PWA of data from .
In contrast to the system, charge-conjugation is a good quantum number for the neutral system. In the E852 experiment the and systems have different systematics. The latter relies on measurements from an electromagnetic detector alone while the former also requires information from charged particle tracking in the forward direction. Moreover, as will be discussed below, two resonances dominate the reaction; the scalar ( wave) and the tensor ( wave) providing benchmarks for the PWA. In constrast, only the is dominant in the reaction.
I.2 Outline for this paper
This paper is organized as follows. The experimental overview is presented in Section 2. Event reconstruction and data selection are described in Section 3. The details of the PWA formalism and results are given in Section 4 along with the criteria used to select the physical solution from the set of ambiguous solutions. In Section 5 the results of leakage studies are presented. In Section 6 the distributions in moments (averages of spherical harmonics) are compared with moments calculated from the PWA solutions. Fits to the moment distributions are also presented. In Section 7 the mass and dependence of the PWA solutions are presented and discussed. In particular the distributions for the waves are described within the context of Regge phenomenology. The conclusions are summarized in Section 8.
II Experimental Overview
The E852 apparatus Te98 was built around and included the Multi-Particle Spectrometer (MPS) at BNL. The data used for the analysis reported in this paper were collected in 1994 and 1995 using a nearly pure ( 95%) beam of negative pions of momentum 18.3 GeV. A 30-cm-long liquid hydrogen target was surrounded by a cylindrical drift chamber BY97 and an array of thallium-doped CsI crystals TA96 arranged in a barrel, all located inside the MPS dipole magnet. Drift chambers were used to track charged particles downstream of the target. Two proportional wire chambers (PWC’s), downstream of the target, were used in requiring specific charged particle multiplicities in the event trigger. A 3000-element lead glass detector (LGD) Cr97 measured the energies and positions of photons in the forward direction. The dimensions of the LGD matched the downstream aperture of the MPS magnet. Photons missing the LGD were detected by the CsI array or by a lead/scintillator sandwich array (DEA) downstream of the target and arranged around an aperture to allow for the passage of charged particles.
The first level trigger required that the unscattered or elastically scattered beam not enter an arrangement of two small beam-veto scintillation counters located in front of the LGD. The next level of trigger required that there be no signal in the DEA and no charged particles recorded in the cylindrical drift chamber surrounding the target or in the PWC’s (an all-neutral trigger). In the 1994 run all layers of the cylindrical drift chamber were used in the trigger requirement whereas in the 1995 run, only the outer layer was used. A common off-line analysis criterion required no hits in the cylindrical drift chamber. The final trigger requirement was a minimum deposition of electromagnetic energy in the LGD Cr97 corresponding to 12 GeV.
The LGD is central to this analysis. The LGD was initially calibrated by moving each module into a monoenergetic electron beam. Further calibration was performed by adjusting the calibration constant for each module until the width of the and peaks in the effective mass distribution was minimized. The calibration constants were also used for a trigger processor that did a digital calculation of energy deposited in the LGD and the effective mass of photons striking the LGD Cr97 . A laser-based monitoring system allowed for tracking the gains of individual modules.
Studies were made of various algorithms for finding clusters of energies deposited by photons, including issues of photon-to-photon separation and position finding resolution. These are also described in reference Cr97 .
III Event Reconstruction and Data Selection
Experiment E852 took data in 1994 and 1995 with an approximate seven-fold increase in statistics collected in 1995 compared to 1994.
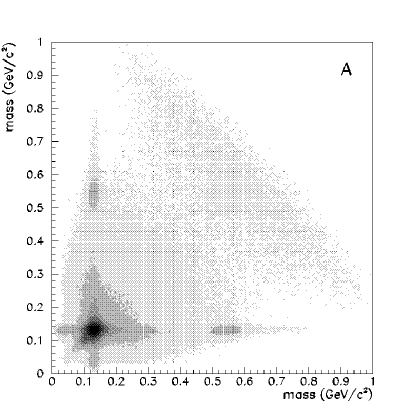
The combined data sets taken in 1994 and 1995 contain approximately 70 million all-neutral triggered events. Of these events, approximately 13 million were found to have four photons in the LGD. Figure 1 shows a scatterplot of one di-photon effective mass against the other di-photon combination in the event. There are clear indications of the presence of and events in the sample. The single clustering at = =0.135 GeV is dominated by events and the two clusterings at =0.135 GeV, =0.540 GeV are dominated by events.
Studies were carried out comparing the 1994 and 1995 data sets for both and events. In each case distributions in the decay angles of the (or ) system were studied in mass bins of 40 MeV and in four bins of , where is the square of the momentum transferred from the beam to the outgoing system. A Kolmogorov test measured the probability that the two distributions (1994 and 1995 data) in each case were consistent with having been drawn from the same parent distribution. The conclusion of this study is that the 1994 and 1995 data sets are statistically indistinguishable.
Events consistent with the production of two ’s dominate the sample. The partial wave analysis of the events is presented in an unpublished thesis of J. Gunter jgth and in a previous paper gunter2001 . The identification of events from the reaction is described in the unpublished thesis of R. Lindenbusch roblin .
The sample of 45,000 events was selected from the 13 million four photon events by imposing various analysis criteria. It was required that no charged particles were registered in the MPS drift chambers or the cylindrical drift chamber surrounding the liquid hydrogen target. This cut was performed at the pre-reconstruction level and was based on total hit multiplicity. Any event with a photon within 8 cm of the center of the beam hole or the outer edge of the LGD was removed.
Monte Carlo studies were carried out to determine the criteria needed to select events and eliminate backgrounds from other processes, especially from events. Events corresponding to , , and were generated and passed through detector simulation, reconstruction, kinematic fitting and other event selection software. The returned from kinematic fitting to the reaction hypothesis was required to be less than 7.8 (95% C.L. for a three-constraint fit). The two-constraint for the hypothesis (no requirement that the missing mass be consistent with the neutron mass) was required to be greater than 100. It was found that this latter cut eliminated true events that have a poor fit to the hypothesis. A further demand was that none of the other final state hypotheses considered (, ) had a better than that used to select the hypothesis.
The final criterion was that the CsI detector registered less than 20 MeV, a cut which eliminated events with low-energy ’s. Background studies roblin estimated the non- background in the . The signal-to-noise ratio varies from about in the mass region 1.2 to 1.5 GeV to in the mass regions below this range and above this range up to 1.8 GeV.
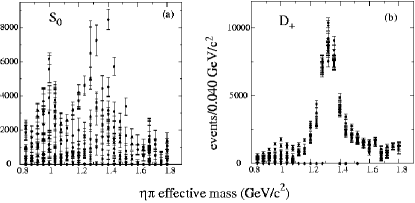
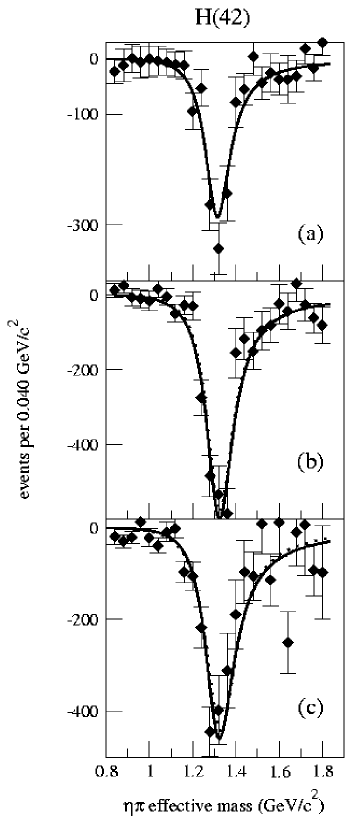
The effective mass distribution is shown in figure 2(a). The and states, one a scalar and the other a tensor, are clearly observed. The presence of both states is important for this analysis since it provides a basis, as will be discussed below, for selecting the physical solutions from among mathematically ambiguous solutions in doing the partial wave analysis. This distribution in effective mass is not corrected for the acceptance of the apparatus but the PWA procedure does take into account the effects of experimental acceptance.
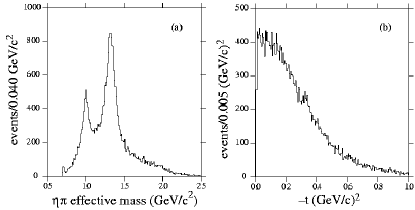
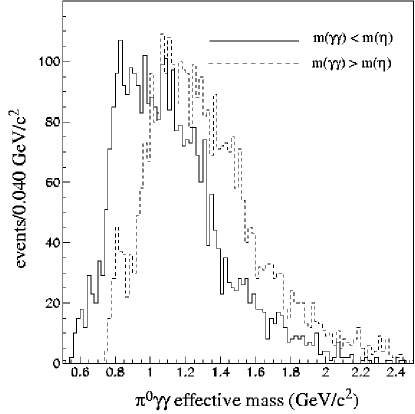
The distribution in is shown in figure 2(b). Figure 3 shows the four-photon effective mass distribution for events with a di-photon mass combination consistent with a and the other di-photon mass either below or above the mass region for a portion of the total four-photon sample. The resulting spectra do not show the enhancements at the and observed in the spectrum.
A possible source of background in the in the mass region are events corresponding to production of the final state and in particular that subset corresponding to where the decays to . There events can enter the sample under study if one of the ’s escapes detection. From a Monte Carlo study of this sample roblin based on a measurement of production in this experiment Te98 it is estimated that at most 10% of the events in the region are due to this background process.
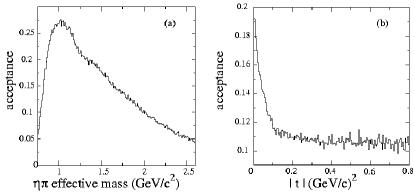
The acceptance in effective mass and was estimated by generating Monte Carlo events corresponding to the reaction . The acceptance functions as a function of effective mass are shown in figure 4. The acceptance in increases for near zero. This comes about because of the all-neutral requirement in the trigger. The recoil neutron produced in the reaction can interact and cause a signal in the CsI detector thereby vetoing true events but for small values of the neutron cannot escape the LH2 target and the event will not be vetoed.
IV Partial Wave Analysis
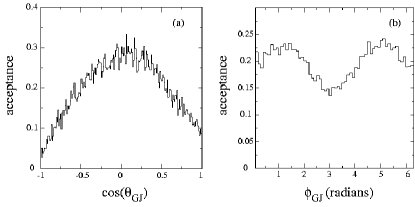
Partial wave analysis is used to extract production amplitudes (partial waves) from the observed decay angular distributions of the system. A process such as , dominated by -channel meson exchange, is conveniently analyzed in the Gottfried-Jackson reference frame. The Gottfried-Jackson frame is defined as a right-handed coordinate system in the center of mass of the produced system with the defined by the beam particle momentum and the perpendicular to the plane defined by the beam and recoil neutron momenta. The decay angles () are determined by the four-momentum vector. At a fixed beam momentum, an event is fully specified by . The acceptances of the E852 apparatus for the Gottfried-Jackson angles were studied using Monte Carlo simulations. Results for the effective mass region from 1.3 GeV to 1.4 GeV are shown in figure 5.
The production amplitudes and their relative phases are extracted from the accumulated angular distributions, for bins in and , using an extended maximum likelihood fit to the distributions in (,) jgth ; roblin ; Chu97 . Fits were performed for three bins in (or simply ) which we label as low- for 0.14 (GeV)2, medium- for 0.14 0.31 (GeV)2, and high- for 0.31 (GeV)2. For each bin the PWA fits were performed in 0.04 GeV-wide mass bins.
Events corresponding to the reaction were processed through PWA software that extracts partial wave amplitudes and phase differences between various partial waves. This procedure takes into account information about the acceptance of the apparatus. The PWA formalism used in this analysis is model independent since the three-body final state follows from a quasi-two body interaction. This is in contrast to the isobar model needed for more complex final states, for example, in which one makes specific assumptions about a series of sequential decays leading to the final state under consideration.
The decay angular distributions are described by an expansion in partial waves that are products of a production amplitude for a state of angular momentum and associated magnetic quantum number and a decay amplitude, also for a given and . The angular momentum is between the and the . The production amplitude takes into account the spin degrees of freedom of the initial and final nucleons and the naturality of the exchange particle. That is, the assumption is made that in this peripheral process the produced state results from a -channel exchange from the nucleon vertex to the meson production vertex. Alternatively one can view the production vertex as a time-reversed decay of the produced state into the beam particle () and the exchanged particle.
Parity conservation in the strong interactions implies a relationship between the magnetic quantum number and naturality. Following Chu97 we choose a basis characterized by the naturality of the exchanged particle. Natural parity exchange obtains if parity and spin are related as (e.g. meson exchange) and the exchange is unnatural if (e.g. meson exchange).
This basis, the reflectivity basis, is one that does not possess the mixed symmetries of the D-functions or spherical harmonics under rotations about the axis. For the linear combination with positive reflectivity, corresponding to natural parity exchange, is:
| (1) |
and the linear combination with negative reflectivity, corresponding to unnatural parity exchange, is:
| (2) |
For the reflectivity is negative and:
| (3) |
The distribution of events in , , and is given by
| (4) | |||||
where the are the production amplitudes and we refer to the various waves as , , , , , , and .
In this analysis we considered (the nomenclature is , and respectively). Waves are further characterized by a subscript if and or if . As noted in Chu97 , amplitudes with are not expected to be important for the production of mesons in quasi-two-body processes. This assumption is borne out by PWA fits to these data indicating little contribution from . We present these results after the discussion of fitting the moments distributions. The amplitudes considered in this analysis, , , , , and are produced via unnatural exchange and and are produced via natural exchange. Waves of different naturality do not interfere. Since the nucleon polarization is not being measured, in equation (4) the dependence on the nucleon helicity is implicit in the production amplitude, e.g. with the upper labels referring to the target and recoil nucleon helicities and the two amplitudes representing nucleon helicity flip and non-flip.
IV.1 Ambiguities and finding the physical solution
There are multiple discrete sets of partial wave amplitudes that can give rise to exactly the same angular distribution Chu97 . It can be shown that for the production of two pseudoscalars with only , and waves there are up to eight ambiguous solutions. For a given bin in these multiple solutions can be found by randomly seeding the fit (using sets of different initial values for the amplitudes) and doing multiple fits.
It is also possible to find the ambiguous solutions analytically, starting with one of the solutions found from the fitting procedure using the method of Barrelet zeroes Bar72 . In this analysis the ambiguous solutions found from multiple randomly seeded fits were found to be consistent with the ambiguous solutions found analytically.
As an example, all ambiguous solutions are shown for the and waves for the full range in in figure 6. The presence of the dominant in the wave leads to a clustering of solutions about the expected Breit-Wigner lineshape. The solutions for the wave are more widely distributed.
When possible, mass-bin to mass-bin continuity along with other independent criteria must be used to select the physical solutions among the ambiguous solutions. In this analysis the presence of the well-established and states, as observed in the mass distribution, provides a means by which to select the physical solution. For each mass bin the solution selected as physical is one where the and amplitudes and the phase difference, , all as a function of mass, are simultaneously most consistent with two interfering Breit-Wigner amplitudes with masses and widths for the and as listed in the Review of Particle Properties Hag02 . For example, referring to figure 6, the amplitude of the physical solution in the 1.0 GeV region should be large and its corresponding amplitude small and in the 1.3 GeV mass region the amplitude should be large and the amplitude should be small. It was found that the requirement that the and solutions simultaneously lie close to the expected line shapes leaves a few ambiguities that are removed when the criterion of proximity to the expected value of is imposed. We note that although the is dominant in the wave, the criterion for selection involved the phase difference between the and waves – the and waves do not interfere. In summary, these criteria were sufficient to uniquely select the physical solution.
In the discussion below that follows the description of fits to experimentally observed moments distributions, we discuss additional quantitative measures for discarding other ambiguous solutions as well as the effect of their inclusion on the stability of the final results. In addition, as discussed below, the -dependences of the selected -wave solutions are well-described by Regge phenomenology as is the ratio , giving us confidence in the selection procedure.
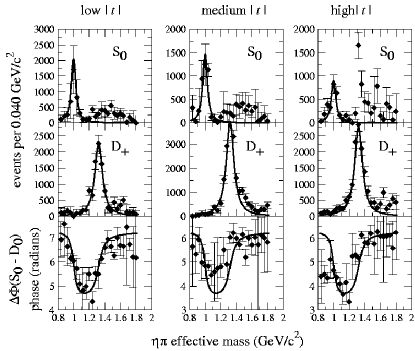
In figure 7 the selected physical solution in each of the low-, medium- and high- regions is shown as a function of mass for the -wave, the wave and the phase difference. Also shown are the corresponding line shapes and phase differences assuming two interfering Breit-Wigner forms for the and – the basis for the criteria used to select the physical solutions. We note that the intensity and phase motion of the -wave is also consistent with the presence of both the and the . The resonance parameters have been extracted from a coupled channel analysis of final states producted in annihilations a01450 . This may account for the excess of events in the 1.4 GeV mass region for the -wave intensity. However because of the large statistical errors in this region we have not been able to unambigously extract the resonance parameters. We will return to this issue in Sections VI and VII.
V Leakage Studies
Incomplete or incorrect understanding of the experimental acceptance can lead to serious systematic effects in this type of analysis. In particular, it is possible that part of a large, dominant partial wave (for example ) could appear as a spurious signal in a different partial wave. We refer to this phenomenon as leakage and study it by intentionally using an incorrect model of the acceptance.
A Monte Carlo sample of pure events was generated including both and waves. This Monte Carlo sample included the effects of experimental acceptance. This sample was analyzed in two ways, in one case our best estimate of the acceptance was used, in the second no correction for the acceptance was made.
The analysis using the acceptance correction should produce as output only and waves with all others consistent with zero. This was found to be the case and the resulting and solutions are compared to the intensity in figure 8(a). A similar result was obtained for all other waves. We conclude that there are no pathological defects in our method since we were able to reproduce correct output from known input.
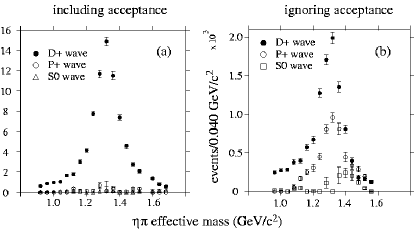
The second analysis provides an upper limit as to the contribution of leakage in this analysis. The acceptance is known to be significantly different than 100% and a function of the kinematic variables, see, for example, figure 4. Approximating the acceptance as equal to 100% independent of the kinematic variables simulates a situation where our understanding of the acceptance is as incorrect as possible, thus providing a limit on the effect of leakage.
It was found that ignoring the acceptance does generate spurious signals in other partial waves. Results for the and partial waves are shown in figure 8(b). Crucial to the interpretation of this spurious partial wave is the fact that even when ignoring corrections for the acceptance, the phase difference is independent of mass. As we will show below, the observed phase difference is a strong function of mass.
VI Experimental Moments
To check the results of PWA fitting, moments of the spherical harmonics were calculated for each bin in for each of the three regions. These moments are labelled as and are defined as
| (5) |
Since
| (6) |
is just the number of events. Moments are directly measured observables and therefore not subject to ambiguities. Given a set of amplitudes, the expected values of the moments can be calculated. If the partial wave expansion is limited to and waves with there are 12 non-zero moments and the following relations hold:
| (7) |
| (8) |
| (9) |
| (10) |
| (11) |
| (12) |
| (13) |
| (14) |
| (15) |
| (16) |
| (17) |
| (18) |
We note that the and moments involve only terms linear in the -wave and the moments only involve -waves. The above equations also underscore the inherent ambiguities in this partial wave analysis. Solving for the amplitudes and their interferences in terms of the non-ambiguous observable moments does not lead to a unique solution.
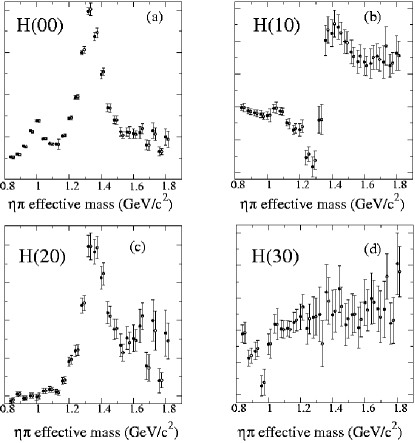
In figure 9 we show the comparison of moments computed directly from data with those calculated from the above expressions using the selected PWA solutions for the ,, and moments. The agreement is excellent and similar results were obtained for the other moments.
VI.1 Fitting the moments
The moments as function of mass were fitted using the above equations and assuming Breit-Wigner resonance line shapes for the , the and a possible -wave resonance. These line shapes specify the form of the mass dependence of the amplitudes and phases (interference terms) in the above equations.
A relativistic Breit-Wigner form was used:
| (19) |
where is the breakup momentum of mass . is a complex, mass-independent normalization, and is mass of the resonance. The energy dependent width is given by
| (20) |
with and the barrier factors given by , , , where the parameterizes the range of the interaction. In the cross section, phase space introduces a factor of which multiplies the intensity function given in equation (4). Finally the -wave contribution was modified by adding an incoherent background parametrized as a linear function in .
There are 21 parameters allowed to vary in the simultaneous fits to the distributions of the 12 moments as a function of mass. The , and -wave Breit-Wigners are each characterized by a mass and width for a total of six parameters. Each of the seven waves is characterized by a complex number but the overall phase for each reflectivity is fixed accounting for 12 more parameters. Finally the slope and intercept of the background and the R-parameter account for the final three parameters. The values of these parameters resulting from the fits are shown in table 1. We have also attempted to include a second -wave resonance to account for a possible in the data. The moment fits were, however, not able to constrain the resonance parameters. We therefore removed the from the moments fits. This has no effect on the results and interpretation of the -wave fits.
| low- | medium- | hight- | ||
| 0.987 | 0.980 | 1.005 | ||
| 0.987 | 0.981 | 0.990 | ||
| 0.094 | 0.246 | 0.37 | ||
| 0.094 | 0.21 | 0.31 | ||
| 1.318 | 1.329 | 1.332 | ||
| 1.318 | 1.329 | 1.335 | ||
| 0.141 | 0.155 | 0.172 | ||
| 0.141 | 0.147 | 0.174 | ||
| 1.386 | 9.99 | 3.47 | ||
| 1.37 | 1.37 | 1.37 | ||
| 0.363 | 0.11 | 0.10 | ||
| 0.37 | 0.37 | 0.37 | ||
| 1.55 | 1.40 | 1.43 | ||
| 1.54 | 1.70 | 2.00 |
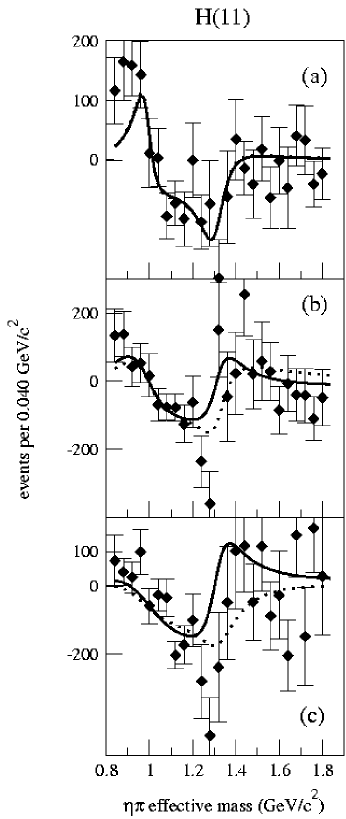
The outcome of the fitting is shown for all moments for the three ranges of described above in figures 10 through 21. The moments shown are corrected for acceptance using the procedure described in reference Chu97 . The solid curves are the result of fits in which all of the 21 parameters described above were allowed to float. The dashed curves are the results of fits where the -wave Breit-Wigner mass was fixed at 1.37 GeV and the the width was fixed at 0.37 GeV. These are the parameters reported for the -wave exotic in the channel in reference SUC1999 .
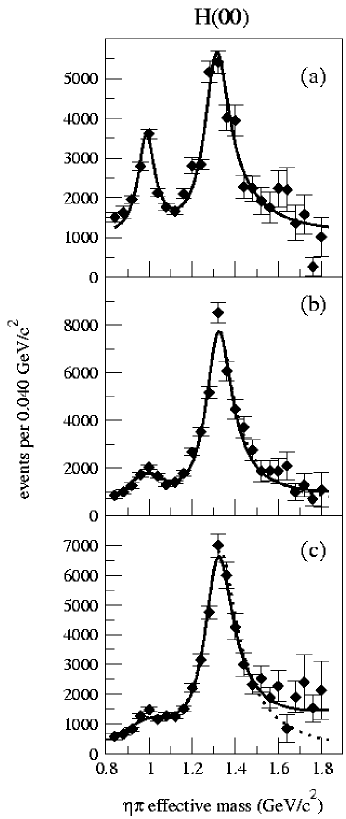
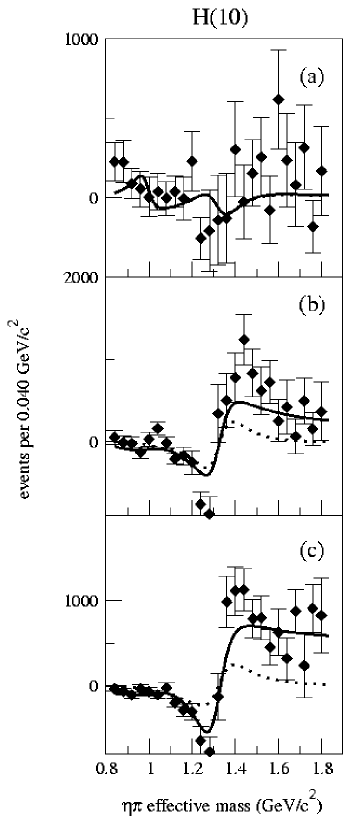
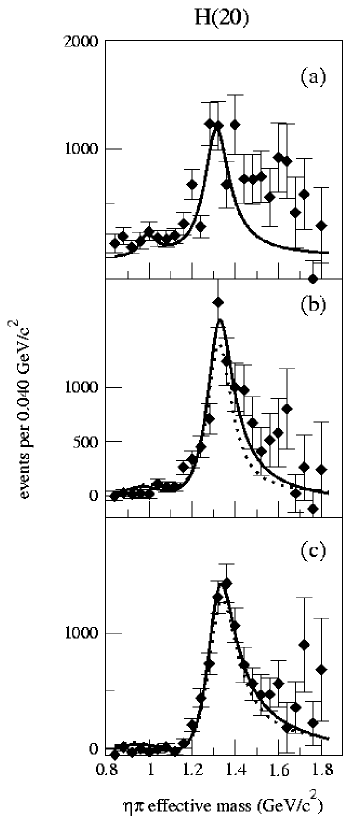
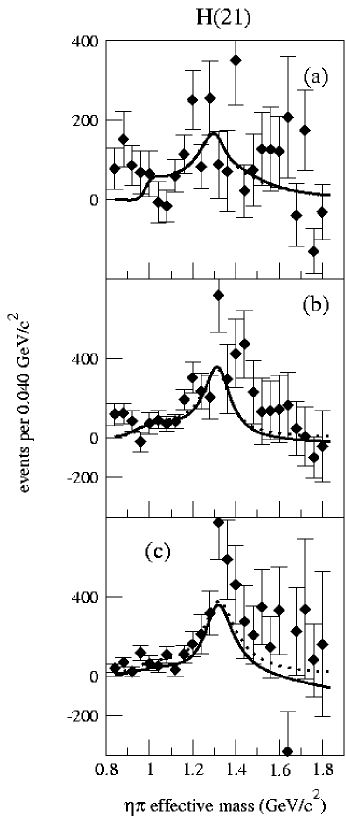
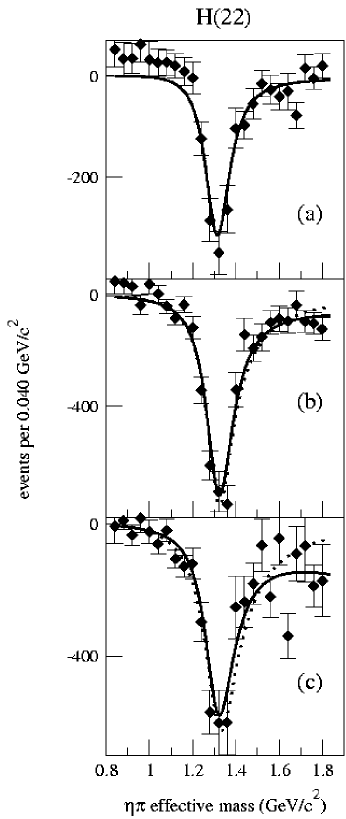
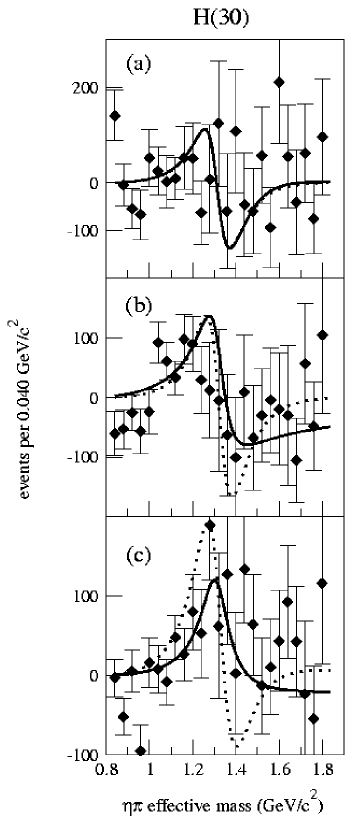
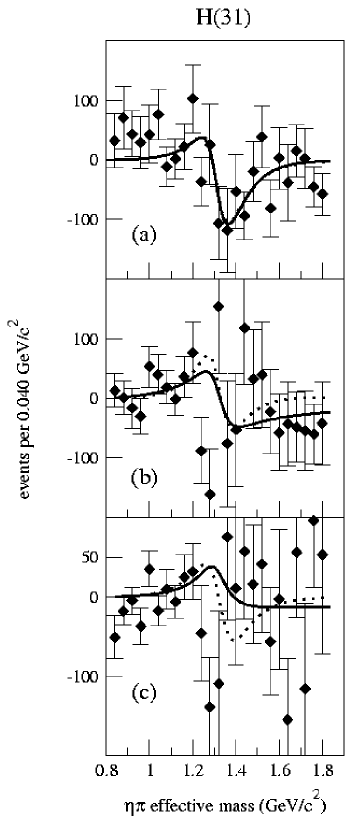
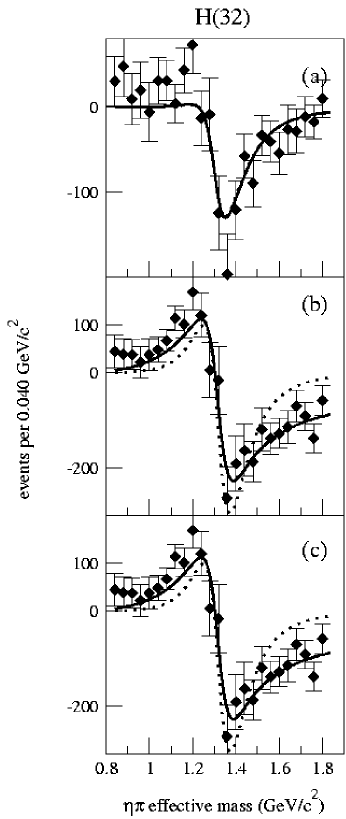
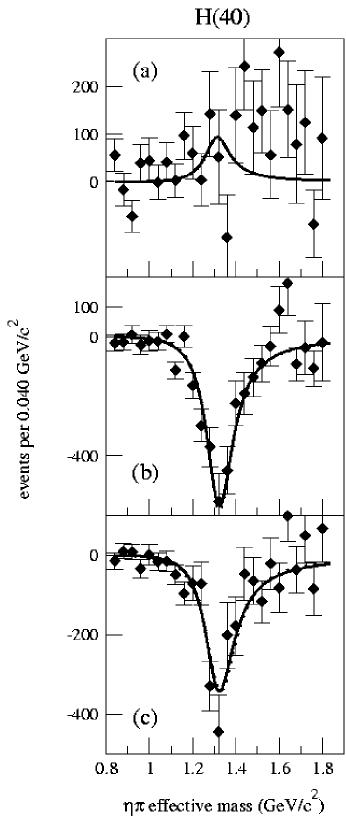
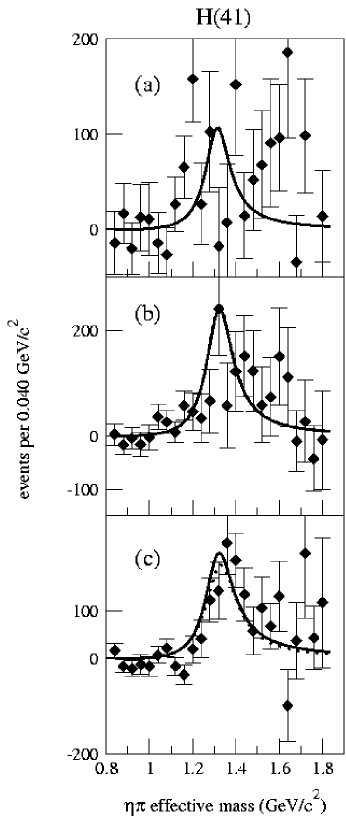
In the low- region, the wave is prominent at 1 GeV and agrees well with the expected contribution to the spectrum from the decay of the meson. The -wave is produced without flipping helicities at the meson vertex and therefore it is dominant at low- and decreases with increasing . The structure at 1 GeV in the and moments (figures 11 and 12 respectively) reflects the interference between the and waves and it is noticeable only at low- where the -wave production is the strongest. The wave dominates the spectrum at 1.3 GeV and since it is produced with a meson helicity flip it is suppressed at low- and it is the largest in the medium- region. In all three -regions, however it is well described by a Breit-Wigner shape corresponding to the meson. As the production increases (to medium and large -regions), the structure in the moment (figure 11) moves to the region and a similar structure in the moment (figure 16) appears. Similarly, the interference of the negative reflectivity -waves with the negative reflectivity -waves is reflected in the moments and (figures 12 and 17 respectively) at 1.3 GeV.
The fit corresponding to the fixed -wave parameters (dashed curve) is significantly worse in (figure 11) – a moment linear in the -wave and somewhat worse or no better in the other moments that are linear in the -wave – (figure 12), (figure 16) and (figure 17). In addition to the moment distribution, the other moments – , , and – are primarily sensitive to the presence of the meson, and therefore are not very sensitive to treatment of -waves in the fit. The fit with the -wave parameters fixed gives a significantly worse per degree of freedom ( from 1.70 to 2.00) as compared to the case when the -wave parameters are allowed to float ( from 1.37 to 1.43). In the later case, however, it was found that no single set of consistent parameters could be found for the waves across the three -ranges. In the low- range the -wave with mass of 1.39 GeV and width of 0.36 GeV was found, which is the only solution consistent with what was reported for the channel SUC1999 . However, even in this -range other solutions could also be found with masses ranging from 1 to 5 GeV. For example, a solution for a -wave with a mass of 0.91 GeV and a width of 1.05 GeV had a . This is because the interference with the -waves is weak at low- and the -wave is too narrow to constrain the away from the 1.3 GeV region. The medium- to large- range should be the best for constraining the waves. Here the waves are dominant and some -wave is still present. In this -range, however, acceptable solutions (with comparable ) different from the one listed in table 1 could not be found.
VII Mass and Dependence of Partial Waves
VII.1 PWA solutions and fits to the moments
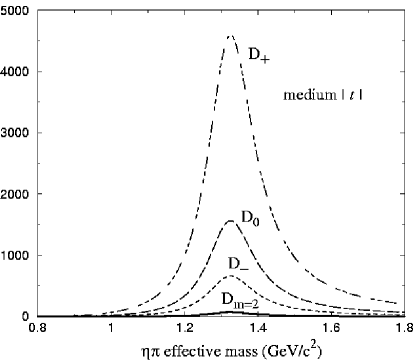
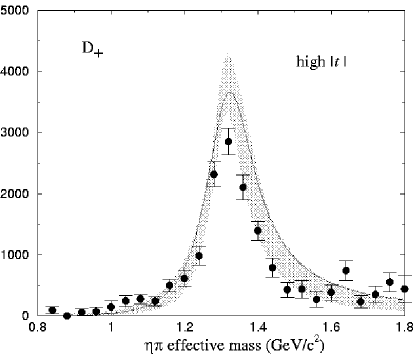
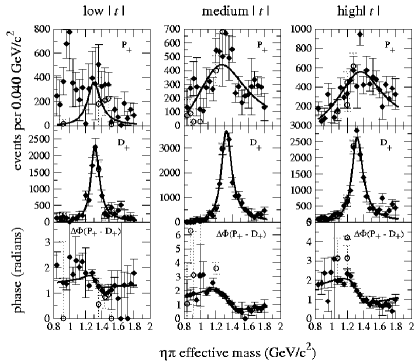
In figures 22 through 24 various partial waves and phase differences are shown as a function of mass for the low-, medium- and high- ranges. In particular we show the mass dependence of the and amplitudes and the phase difference. Also shown is the mass dependence of the and amplitudes and the phase difference. The filled data points indicate the selected (physical) solutions. The additional points indicated by open circles and dashed error bars are those ambiguous solutions that satisfy conditions described below.
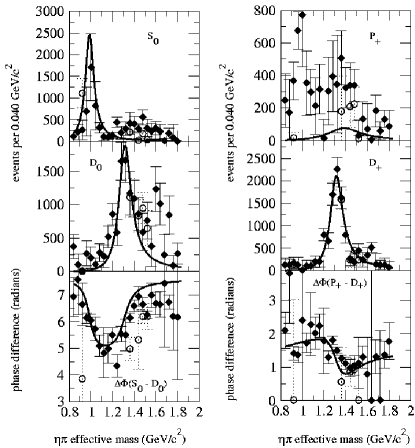
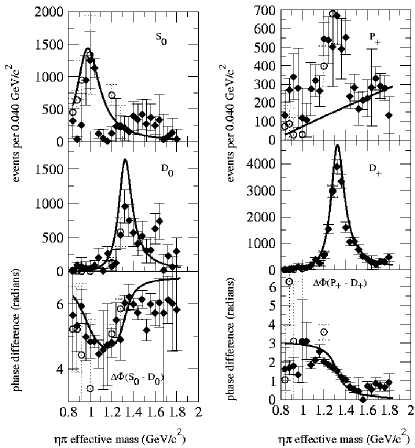
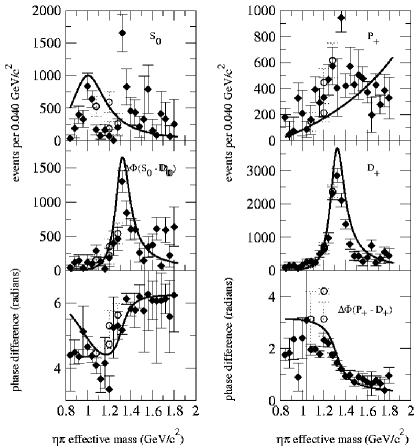
The curves are the result of the fits to the moments where the -wave Breit-Wigner parameters are allowed to float. We refer the reader to similar plots shown in figure 7 for the and amplitudes and the phase difference along the the curves used to select the solutions.
The results of the fits to the moments (recalling that the moments are unambiguous) were used to study the possible inclusion of other ambiguous solutions not selected as the physical solutions. We compute a that measures the deviation of other ambiguous solutions from the partial wave solutions obtained from the moments fits. This requirement was imposed separately for the and -waves and the phase difference. In some cases several ambiguous solutions were found to have similar to the selected solutions and these are included in figures figures 22 through 24 as the open circles with dashed error bars. The mass-dependent fits involving only the and amplitudes and the – as described below – phase difference were insensitive to the inclusion of these solutions.
The fits shown in figures 22 through 24 describe the and in all three regions. The values obtained for the mass and width of the as shown in table 1 are consistent with nominal values for this well understood state. The is well described in the low- region and the mass and width shown in table 1 for the agree with published values. As increases the production of the decreases and the description of the wave in figure 24, for the high- range is problematic. In this region the wave includes mostly structureless background naturally subsumed into the wave. Requiring that the wave be described by a Breit-wigner wave yields a width that is wide and driven by the phase motion of the via the phase difference. As noted above, the moment fits did not constrain the parameters of a possible second scalar resonance, the . In the mass-dependent amplitude and phase difference fits, the inclusion of a second scalar resonance In the low- region yields and for the mass and width of the second resonance, while in the medium- region we obtain and , respectively. No stable fit was found for high- data.
The moments fits poorly describe the waves in all three regions and the amplitude peaks in the vicinity of the dominant wave strongly suggesting leakage. We also note that the wave has an additional lower mass peak in the vicinity of the in the low- region (see figures 22 and 23 where production of the is strong – again suggesting leakage. Our Monte Carlo studies indicate that leakage of dominant waves can lead to false peaks in other amplitudes but it is unlikely to cause false phase motion. Indeed this wave enhancement at about the mass of the follows closely the behavior of the wave in its dependence on both mass and momentum transfer squared. Furthermore as shown in figure 22 and especially in figure 23 the additional solutions allowed by the selection criteria (those indicated by open circles) do not alter the wave shape but reduce the amplitude of the wave in the region of GeV/. Furthermore, the fits to the moments do not reveal any wave signal at GeV/ and due to angular momentum barrier effects it is expected that at low breakup momentum the wave should dominate over the wave.
VII.2 Systematics and the fitting procedure
The assumption was made earlier that waves with were not important. In order to test this assumption the additional waves, one for each reflectivity, were included in the fits for all the moments including the and moments. The Breit-Wigner distributions corresponding to the resulting fits are shown in figure 25 for the , , waves and the two waves of opposite reflectivities (the two curves are indistinguishable in the plot). This supports our original assumption.
The systematics of varying all possible fit assumptions was studied for the -wave for the high- region and the results are shown in the plot of figure 26. We chose to study this high- region since the description of the wave amplitude is poorest for this region ((see figure 24). The curve is the result of a of the overall fit to the moments. The shaded region corresponds to the variations in the fit by letting the Breit-Wigner parameters for all the other waves vary in all possible combinations – that is, being fixed at nominal values or allowed to float. The wave is within the systematic errors.
VII.3 Mass-dependent fits
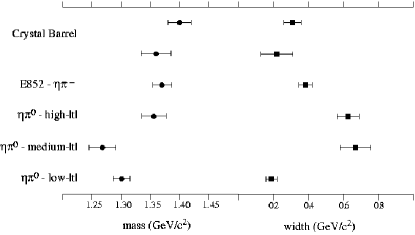
The dependence of the measured and amplitudes and the phase difference as a function of mass was fitted to two interfering Breit-Wigner line shapes following the method of reference SUC1999 . Fits carried out separately for the three ranges in are presented in the plots of figure 27 and the fit parameters are listed in table 2. In figure 28 the -wave parameters obtained from the mass dependent fits are compared to those reported in references SUC1999 ; Abe98 ; Abe99 . The -wave mass obtained for the high- range is consistent with that reported in the channel but the width observed here is significantly higher. The values obtained for the mass in the low- and high- ranges are lower than for the channel. The conclusion is that no consistent set of resonant -wave parameters can describe the data while the resonant parameters obtained for the are consistent for various ranges in mass and and consistent with well-established parameters from earlier experiments.
| all | low- | medium- | high- | ||
| 1.326 | 1.316 | 1.329 | 1.326 | ||
| 0.169 | 0.127 | 0.154 | 0.166 | ||
| 1.272 | 1.301 | 1.268 | 1.356 | ||
| 0.66 | 0.19 | 0.67 | 0.629 | ||
| 3.23 | 2.13 | 1.51 | 1.60 |
VII.4 Description of the dependence of the -waves
Figure 29 shows the dependence of the , and -waves as a function of . Since the is dominant in these waves and the production of these waves is associated with exchanges well known from Regge phenomenology, a comparison of data with this known phenomenology is a check on the methodology. Indeed the dependence is well described.
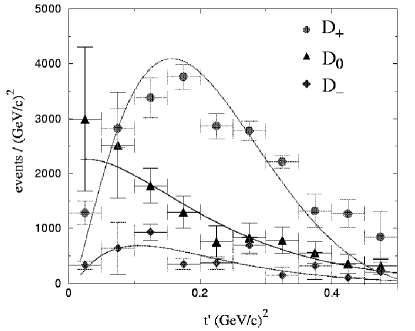
The wave is produced via a natural -channel charge exchange which is dominated by the trajectory and is parametrized by, IW
| (21) |
| (22) |
Here the and are the nucleon helicity flip and non-flip amplitudes respectively, with in equation 22 according to reference IW , and
| (23) |
The parameters of the trajectory are given by , IM . The fit of the -distribution given by Eq. (22) to the measured -distribution involves one parameter – the overall normalization and is shown in figure 29. Some discrepancy is seen at large- , in particular the characteristic dip of the exchange at is not seen. This indicates that there is some absorption required for the .
The wave is produced via unnatural exchange and is expected to be dominated by the in the nucleon helicity flip amplitude and the tensor, -trajectory, () in the non-flip amplitude. These can parametrized by, IW
| (24) | |||
| (25) |
with the parameters of the two trajectories given by , , and IM .
The -wave is produced by unnatural parity exchange and its dependence is given by . The fit to the measured wave intensity has two parameters – the normalization of the nucleon helicity flip and non-flip amplitudes – and is also shown in figure 29.
VII.5 Ratio of -waves
In a paper discussing the PWA of the system produced in peripheral interactions Sad99 , Sadovsky uses a criterion for selecting the physical solution among the ambiguous solutions. The test involves a measurement of the ratio . According to Regge phenomenology this ratio should fall like where is determined from other experiments. At =18 GeV this ratio is expected to be . Integrating the distributions in figure 29 over all we obtain .
VIII Conclusions
A partial wave and moment (averages of spherical harmonics) analysis of data collected in experiment E852 from the reaction (where ) as a function of effective mass and momentum-transfer-squared was performed. The presence of two well-established and resonances allows for the imposition of criteria for selecting the physical solution among the mathematically ambiguous solutions. The physical solution is consistent with the presence of two interfering Breit-Wigner resonances for these states. The distribution in 12 acceptance-corrected moments, , calculated directly from the data are consistent with moments calculated from the PWA solutions.
Every term in the moments with odd (5 of the 12) is linear in the wave and the observed moments distributions are non-zero clearing indicating that the data demand the presence of a wave. To allow for the inclusion of a possible resonance with exotic quantum numbers, the moments are thus fit with the assumption of three interfering Breit-Wigner resonances for the -wave and -wave and -wave.
The data suggest weak production of the . The was established by the Crystal Barrel collaboration in and a01450 with production ratios for equal to and respectively. These are qualitatively consistent with our results. The dominant , and -waves are consistent with production of the and fits to the their line shapes are consistent with the resonance parameters of this well-established tensor resonance. Moreover, the observed -dependence of the individual waves are well described by Regge phenomenology as is their ratio. Finally the and in the data are well described as Breit-Wigner resonances produced via a -channel exchange mechanisms regardless the treatment of the -wave, and/or incoherent background.
While the Breit-Wigner parameterization of the wave and wave is physically well motivated and confirmed by the data, the resonance representation of the -wave is problematic. The data unambiguously indicated that the phase of the -wave increases as the function of the mass which corresponds to an attractive interaction in the -wave channel. However, the data do not require the phase of the -wave to increase over nor is there compelling evidence for the intensity of the -wave to have a resonance shape in the mass range studied, i.e from threshold to .
Mass-dependent fits, restricted to the and amplitudes and phase difference, following the method of reference SUC1999 reporting an exotic meson decaying into , yield results inconsistent with those of reference SUC1999 and among the three ranges in this analysis. The discrepancy in the resonance parameters found by fitting the natural waves alone is, however, smaller than the one found by fitting the full data sample (moments).
However, by restricting the study to only , waves and the phase, , important additional information from the remaining data is ignored. For example, an exotic wave resonance should have the same resonance parameters in all three, , and -waves. These wave represent different spin projections of the resonance and the data should discriminate between their production strengths.
Furthermore, we have found that the intensity of the weak waves, i.e. and -wave above the region are more affected by leakage from the strong, waves due to the than are the phase differences. Thus, since the mass-dependent fit to the natural waves alone, is strongly constrained by the intensity distribution of the -wave, it tends to follow the line shape, and force the fit to mimic a -wave resonance with mass near the mass.
In a separate paper we will present an alternative description of the mass dependent -wave amplitude and phase that does not require the existence of an exotic meson but is consistent with re-scattering.
IX Acknowledgments
The authors wish to thank the members of the MPS group at BNL as well as the staffs of the AGS and BNL. This work was supported in part by the National Science Foundation and the U. S. Department of Energy.
References
- (1) References from Crystal Barrel for the glueball at 1500 MeV.
- (2) N. Isgur and J. Paton, Phys. Rev. D31, 2910 (1985).
- (3) C. Bernard et al [MILC Collaboration], Phys. Rev. D56, 7039 (1997).
- (4) F. de Viron and J. Ewyers, Nucl. Phys. B185, 391 (1981).
- (5) T. Barnes and F. E. Close, Phys. Lett. B 116, 365 (1982).
- (6) R. Jaffe, Phys. Rev. D15, 267 (1977).
- (7) G. S. Adams et al, Phys. Rev. Lett. 81, 5760 (1998).
- (8) S. U. Chung et al, Phys. Rev. D. 65, 072001 (2002).
- (9) E. I. Ivanov et al, Phys. Rev. Lett. 86, 3977 (2001).
- (10) D. R. Thompson et al, Phys. Rev. Lett. 79, 175 (1997).
- (11) S. U. Chung et al, Phys. Rev. D 60, 092001-1 (1999).
- (12) A. Abele et al, Phys. Lett. B 423, 175 (1998).
- (13) A. Abele et al, Phys. Lett. B 446, 349 (1999).
- (14) D. Alde et al, Phys. Lett. B 205, 397 (1988).
- (15) Yu. Prokoshkin, S. A. Sadovski, Phys. Atom. Nucl. 58, 606 (1995).
- (16) G. M. Beladidze et al, Phys. Lett. B 313, 276 (1993).
- (17) H. Aoyagi et al, Phys. Lett. B 314, 246 (1993).
- (18) J. Gunter et al, Phys. Rev. D 65, 092001-1 (2001).
- (19) S. Teige et al, Phys. Rev. D59, 1 (1999).
- (20) Z. Bar-Yam et al, Nucl. Instrum. Meth. Phys Res A 386, 235 (1997).
- (21) T. Adams et al, Nucl. Instrum. Meth. Phys Res A 368, 617 (1996).
- (22) R. R. Crittenden et al, Nucl. Instrum. Meth. A387, 377 (1997).
- (23) J. Gunter, Ph.D. thesis, Indiana University, 1997.
- (24) R. Lindenbusch, Ph.D. thesis, Indiana University, 1997.
- (25) S. U. Chung, Phys. Rev. D 56, 7299 (1997).
- (26) E. Barrelet, Nuovo Cimento A 8, 331 (1972).
- (27) K. Hagiwara et al, Phys. Rev. D66, 010001 (2002).
- (28) C. Amsler, et al, Eur. Phys. J. C 23, 29 (2002).
- (29) A.C. Irving and R.P. Worden, Phys. Rept. 34, 117 (1977).
- (30) A.C. Irving and C. Michael, Nucl. Phys. B82, 282 (1974).
- (31) S. A. Sadovsky, Nucl. Phys. A655, 131c (1999).