The HERA-B Ring Imaging Čerenkov Counter
Abstract
The HERA-B RICH uses a radiation path length of 2.8 m in C4F10 gas and a large 24 m2 spherical mirror for imaging Čerenkov rings. The photon detector consists of 2240 Hamamatsu multi-anode photomultipliers with about 27,000 channels. A 2:1 reducing two-lens telescope in front of each PMT increases the sensitive area at the expense of increased pixel size, resulting in a contribution to the resolution which roughly matches that of dispersion. The counter was completed in January of 1999, and its performance has been steady and reliable over the years it has been in operation. The design performance of the RICH was fully reached: the average number of detected photons in the RICH for a particle was found to be 33 with a single hit resolution of 0.7 mrad and 1 mrad in the fine and coarse granularity regions, respectively.
keywords:
ring imaging Čerenkov detectors, photomultiplier tubes, HERA-B,1 ,2 ,3 ,4 ,5
1 Introduction
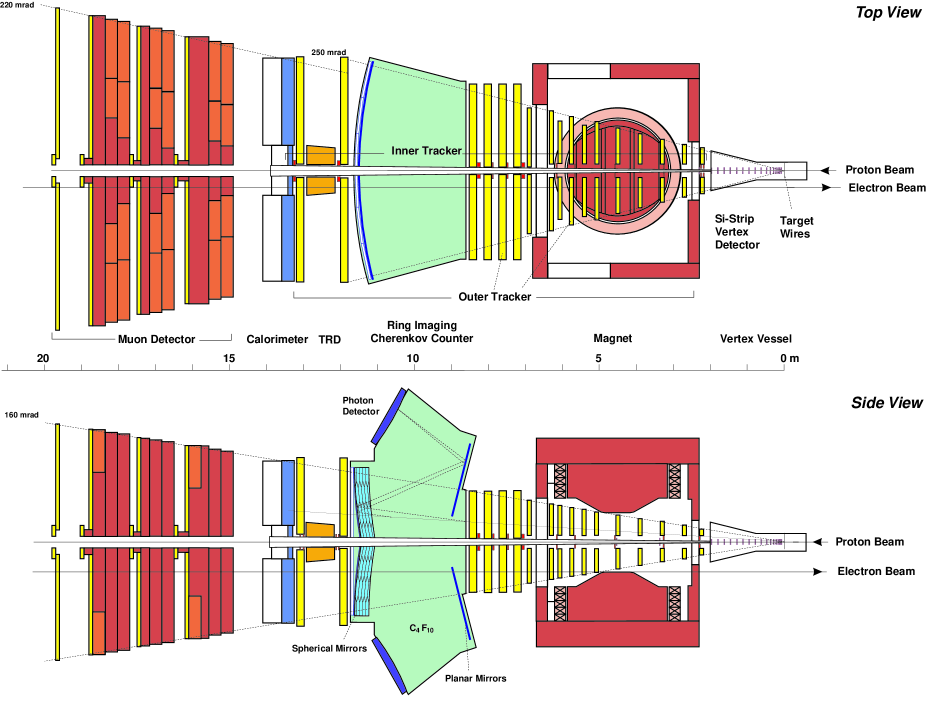
HERA-B, a fixed target experiment (see Fig. 1) at the HERA storage ring at DESY, was designed [1] to measure rare processes in the decays of mesons. The mesons are produced in collisions of 920 GeV/c protons with a fixed target, which consists of 8 wires which can be individually inserted into the halo of the proton beam in order not to disturb experiments measuring collisions. One of the essential components of the spectrometer is the Ring Imaging Cherenkov counter (RICH) [1, 2, 3, 4]. The main purpose of the RICH counter is the identification of charged hadrons, in particular kaons from decays of mesons. Identifying charged kaons essentially means separating them from pions in the momentum range between 3 GeV/c and about 50 GeV/c at an interaction rate of up to 40 MHz.
This paper is organized as follows. We shall first discuss the design criteria and their implementation. The components of the counter will be presented, as well as the monitoring and analysis programs. Finally, results of measurements made with the counter will be discussed, and the performance of the RICH as an identification device, and also as a tracking device, will be presented.
2 Design Criteria
In a fixed target experiment such as HERA-B where one has to deal with an intense flux of charged particles, the design choices of a ring imaging Čerenkov counter are governed by the following criteria. To achieve the necessary performance, a sufficient number of Čerenkov photons (at least 20) has to be detected per ring image of a particle [1]. This requirement fixes the length of a gas radiator to a few meters. The high rate capability of the photon detector requires a detector with pad readout, which limits the resolution to a few millimeters. This, in turn, together with the required high resolution in the measurement of the Čerenkov angle for single photons (better than 1 mrad) sets the mirror focal length value to several meters. Last but not least, the requirement that single photons are efficiently detected with low background, forces the photon detector to be kept out of the solid angle for charged particles and conversion products.
3 Implementation
3.1 Radiator
Perfluorobutane gas () was chosen for the HERA-B RICH radiator, since it combines a relatively high refractive index, , and low dispersion (5% variation in over the spectral acceptance from 300 nm to 600 nm [5]). In this gas the Čerenkov radiation threshold momenta for pions and kaons are 2.7 GeV/c and 9.6 GeV/c, respectively. For particles, the Čerenkov angle is 52.4 mrad, while the difference in Čerenkov angle is 0.9 mrad at 50 GeV/c. The r.m.s. angular spread due to dispersion amounts to 0.33 mrad. Since some freons are known to scintillate considerably, (e.g. CF4), we have studied C4F10 scintillation [6] and found that this contribution to background is less than 0.2 detected photons per charged particle.
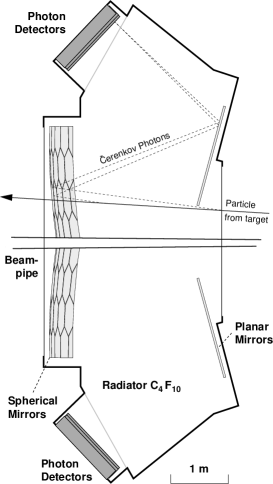
The radiator vessel, made from stainless steel plates with 1 mm aluminum particle entrance and exit windows (see Fig. 2), is placed about 8.5 m downstream of the target (see Fig. 1). Two beam shrouds made of carbon fiber-reinforced epoxy resin CFK close the gas volume around the two beam pipes for protons and electrons. The Čerenkov light exits the vessel through 2 mm thick UV grade Plexiglass windows [7]. The vessel is filled with 108 m3 of C4F10 gas, which is being circulated in a closed system with liquefaction stages for cleaning and buffering [8, 9]. Requirements on impurities are moderate due to operation in the visible and near UV part of the Čerenkov spectrum. The radiator gas is kept at 2.5 mbar overpressure relative to ambient pressure. Additionally, a bubbler with a 10 mbar pressure difference threshold is attached to the vessel.
3.2 Mirrors
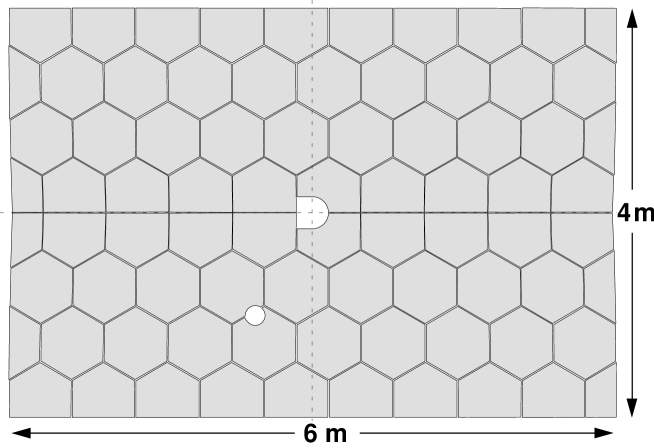
The main imaging device is a spherical mirror placed inside the radiator vessel with the center of the sphere near the target and a radius of curvature of 11.4 m. The mirror, a 6 m by 4 m rectangular cutout from the sphere, consists of 80 full or partial hexagons made from 7 mm thick Pyrex glass, coated with 200 nm of aluminum and 30 nm of MgF2 (see Fig. 3). To be able to place the focal surface outside the particle flux (160 mrad vertically), the mirror is split horizontally and both halves are tilted by 9∘ away from the beam-line. A set of two planar mirrors, composed of 18 rectangular elements each, translates the focal surface to the photon detector area above and below the radiator vessel (see Fig. 2). The planar mirrors are made of float glass, thus being significantly cheaper than Pyrex mirrors at the required optical quality. All 80 spherical and 36 planar mirrors are mounted on a rigid, low mass support structure inside the radiator volume and can be individually adjusted by stepper motors from the outside.
The mirror quality was determined upon delivery by measuring for each segment the radius of curvature and the fraction of reflected light, and by recording a Ronchi image to check the homogeneity of the mirror surface [10]. The reflectivity was required to exceed 85% in the wavelength interval from 250 nm to 600 nm. From the data gathered, the mirror segments were grouped in a tiling scheme according to their optical quality and resolution requirements [11].
All mirrors were aligned to better than the required precision by surveying them inside the vessel. An off-line data based algorithm was developed for monitoring of the positions of the mirror segments during the measurement [12].
3.3 Photon detector
Two types of wire chamber based photon detectors were initially considered, a CsI photocathode in a MWPC, and a TMAE detector with 10 cm deep, 8 x 8 mm2 unit cells. After considerable success of on-the-bench and beam tests [13, 14, 15], the detectors were tested in a high rate environment, as expected in the HERA-B experiment. Both detectors had to be abandoned; the TMAE detector showed a prohibitive decrease of avalanche gain due to aging effects [16, 17], while the CsI photocathode could not be routinely produced and maintained with sufficiently high quantum efficiency, in addition to problems with rates in excess of a few kHz per pixel [18, 19].
The actual photon detector consists of Hamamatsu multi-anode R5900-00-M16 and R5900-03-M4 photomultiplier tubes (PMTs). In what follows they are denoted by M16 and M4. The M16 version has 16 pads of 4.5 x 4.5 mm2 each, with a 12-stage, metal-foil dynode system [20]. The M4 version has 4 pads of 9 x 9 mm2 each, and 10 dynodes. The quantum efficiency of the M16 photocathode with borosilicate window has a broad plateau in the wavelength region between 300 nm to 500 nm and a maximum value about 20%. The M4 tubes have a UV transparent window, which shifts the low wavelength cut-off to about 250 nm. The other PMT characteristics, such as the required cathode high voltage ( 1000 V), current amplification (107), dark current ( 1 nA), pulse rise time (0.8 ns), transit time spread (0.3 ns) are also satisfactory [20]. In the initial set of on-the-bench measurements [21], the single photon counting properties of the photomultiplier tube were investigated, in particular the efficiency for single photon detection as well as the background count rate. It was established that the PMT allows for a good single photoelectron detection efficiency (above ), with very small cross talk (below ), low background rate (few Hz per channel, Fig. 4), and acceptable uniformity as shown in Figs. 5 and 6 [22].


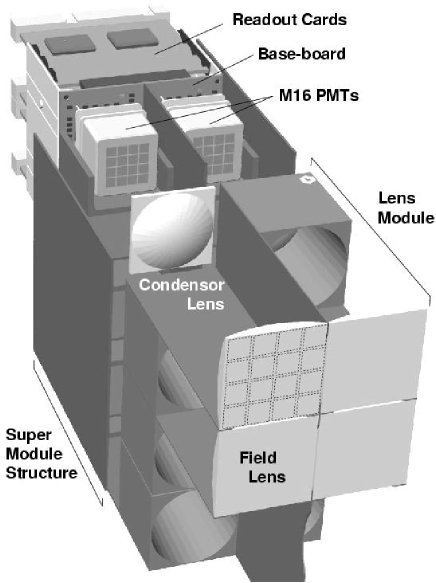
The PMTs have the outer dimension of mm2 with an active area of mm2. They are positioned on a mm2 grid. To increase the fraction of the active area, a two lens demagnification system (2:1) was designed, as shown in Fig. 7 [26]. The lenses are made of UVT perspex [27] with high transparency over most of the wavelength region where the photocathode is sensitive (Fig. 8). The angular acceptance of the optical system is also satisfactory and is uniform for incident angles below about 110 mrad [28]. The increase in the photodetector active area is achieved at the expense of increasing the pixel size from the 4.5 x 4.5 mm2 PMT pad size to 9 x 9 mm2 pixel in the central detector region. The resulting angular measurement error (0.46 mrad) slightly exceeds the spread due to dispersion (0.33 mrad). For the outer detector region, with lower track densities and lower typical track momentum, the photon flux is smaller, and the resolution requirements looser. In order to reduce the detector cost, this detector part uses the M4 version of the tube with two times larger pads (9 x 9 mm2). The same lens system thus results in 18 x 18 mm2 pixels which correspond to an angular measurement error of 0.92 mrad.
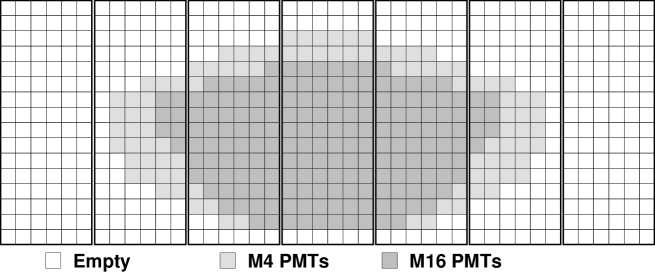
In order to reduce the contribution of spherical aberration to the overall resolution of the Čerenkov angle, an optimal surface of the Čerenkov photon detector was calculated [29, 30]. Each half-detector (upper and lower) consists of 7 flat supermodules placed to approximate the optimal surface, which is close to the shape of a flattened (ellipsoidal) cylinder. Such an arrangement also ensures better acceptance for the Čerenkov photons, which should be incident onto the flat supermodules at angles below 110 mrad. The supermodules are rectangular 1.1 0.4 m2 boxes containing a grid made from 1 mm thick soft iron sheets that serve as magnetic shield and mounting structure for the PMT base-boards and the light collection system. The two types of photomultipliers were arranged according to occupancy and reconstruction requirements as indicated in Fig. 9. Altogether 1488 M16 PMTs and 752 M4 PMTs are needed to cover the detector surface, thus totaling 26816 read-out channels.
Prior to the installation in the photon detector tests of all the 2305 acquired PMTs (1543 M16’s and 762 M4’s) were made in the laboratory [23]. Čerenkov photons produced in a 1 cm thick quartz window by particles from a 90Sr source were used as a stable light source [24]. Four PMTs were tested simultaneously, of which one was used as a reference. For each photomultiplier tube, the source and background rates were recorded as a function of high voltage and threshold setting. On the basis of these tests, the photomultipliers were grouped according to similar high voltage characteristics, allowing all PMTs within a group to be connected to the same high voltage, thus minimizing the number of independent HV channels [25]. The results obtained for the optimal high voltage as well as for the relative PMT sensitivity were compared to values provided by the manufacturer, and good agreement was found [23]. The count rates of the reference M4 and M16 photomultipliers, recorded during the quality assessment tests and also continually measured after the tests, were used in order to obtain an estimate of the long term stability. The count rate decrease in two years of operation is consistent with the known decay rate of the 90Sr source.
3.4 Read-out and monitoring
To mount, power, and read out the photomultipliers, two types of base-boards were developed, one for M4 and one for M16 PMTs. Each base-board is a light-tight, four-layer (M16) or two-layer (M4) circuit-card, 70 70 mm2 in size, equipped with surface mount components. One side of the board holds four custom designed sockets and voltage divider chains, appropriate for the particular type of PMT; the other side contains one (M4) or four (M16) connectors for the 16-channel readout-cards, attenuation circuitry, and two daisy-chainable high voltage connectors. The voltage divider chain is composed of a sequence of 1 M and 560 k resistors that was optimized for single photon counting at high rates [31]. The base-boards are mounted in such a way that the PMTs are positioned at centers of the mm2 grid (see Fig. 10).
Between two and five base-boards, with their PMTs selected for similar optimal operating voltage (ranging from 750 V to 890 V), are powered by a single output of a 160-channel CAEN SY527 high-voltage supply [25].
The front end electronics board employed in the system is a 16-channel board [32] based on the ASD8, an amplifier, shaper, and discriminator chip [33]. The board was developed for the Outer Tracker (OTR), the main tracking system of the HERA-B spectrometer. Since the photomultiplier tube signals are typically considerably higher than the pulses for drift chambers, a charge divider was added in front of the ASD8 board (1:10 for M16, and 1:5 for M4 PMTs). The front end electronics boards were arranged according to their optimal threshold voltage by using test data which were obtained by varying pulse height and threshold voltages [34]. The same test was also used to reject faulty boards.
The low voltage supply system for the ASD8 boards is powered by four KEPCO ATE 6-100M supplies, delivering voltages of and separately to the upper and lower photon detector halves [35]. Analog outputs of 16 photon detector channels are transmitted to the electronics hut for diagnostic purposes.
The signals from the ASD8 cards are transmitted over 7.5 meter long 16 channel twisted pair cables to the Front End Drivers (FEDs). For each FED set there are 4 daughter cards with 16 cable connections, and one mother card, such that each FED set can accomodate up to 1024 channels [36, 37]. The RICH uses 28 such sets. The FED mother board provides the interface to the HERA-B Fast Control System, which provides a clock signal for synchronization as well as triggers to indicate event forwarding. The mother board also provides the interface to the HERA-B DAQ System via the SHARC protocol [38], as well as a ring buffer memory capable of storing 128 events, pending the First Level Trigger decision.
A sizable fraction of the operating parameters of the RICH counter (low voltage and threshold for the front end electronics boards, temperatures at the photon detector and power supplies) are controlled by a Field Point [39] based system. Two separate systems are used for monitoring the high voltage [25] and steering the gas system [8]. The overall control of these systems is implemented with a server-user interface system. The server process is running on a VME computer connected to the Field Point system through a RS232 cable. In the case of a malfunction (if the temperature, threshold, or low voltage are out of range) the server switches off the low voltage power supplies. The parameters can be monitored and set via a tcl/tk and BLT based graphical user interface program running on a linux PC and communicating with the server through a TCP-IP based protocol. The RICH low voltage and high voltage slow control systems are integral parts of the overall HERA-B slow control system [40].
As a triggerable light source for testing the photon detector in the periods without beam induced reactions, a system of light emitting diodes (LED) was installed at the sides of the photon detector windows [41]. The system provides good illumination over the whole photon detector area.
3.5 Expected performance
The number of detected photons on a ring measured by a Čerenkov detector is often parametrized as , where m is the length of the radiator, is Čerenkov angle, and is the detector response parameter. From the data available on the quantum efficiency [20], mirror reflectivities [11], window and optical system transmissions [26], one calculates the merit factor cm-1. Accordingly, the expected number of photons for particles approaching the velocity of light ( mrad) amounts to 32.
Individual contributions to the expected single photon resolution are summarized in Table 1. The optical error includes contributions from spherical aberration, mirror quality and alignment of mirrors, while photon detector resolution is dominated by detector granularity with a small contribution of the alignment of photon detector components. The contribution of multiple scattering in the RICH counter [42] depends on momentum and is given by . The resulting single photon resolution, () for the regions covered by M16 (M14) PMTs, does not include the contribution from the track direction as given by the tracking system, and will therefore be referred to as intrinsic resolution.
| error source | M16 PMT | M4 PMT |
|---|---|---|
| photon detector resolution | 0.50 mrad | 0.93 mrad |
| dispersion | 0.33 mrad | |
| optical errors | 0.25 mrad | |
| multiple scattering | ||
| total intrinsic resolution | ||
4 Data Analysis
Several computer programs were developed for the analysis and monitoring of the data collected by the RICH counter. In the initial phase of the commissioning of the HERA-B spectrometer, when major parts of the main tracking system were not yet available, a stand-alone ring search algorithm was employed [43, 10]. The program searches for rings with a given ring radius, starting at the maximum value and scanning down to of the maximal ring radius. Only rings with a sufficiently high signal over background ratio are stored, and the corresponding hits are excluded from further ring search. As described in section 6, the reconstructed ring center gives information that can be used in tracking. The algorithm is routinely used to monitor the current maximal value of the Čerenkov angle [44] which is, in turn, used as the input for all particle identification algorithms. Small variations of refractive index and thus of the Čerenkov angle are caused by pressure and temperature variations of the radiator gas. We note that several alternative ring search algorithms were also tested on the data [45].
For highly populated events, typical for the reactions recorded in the HERA-B spectrometer, additional information helps to improve the particle identification capabilities. The information from the tracking system, track direction and momentum, is used to determine the expected position of the ring center and the expected ring radius for various particle hypotheses. To evaluate the likelihood for each individual hypothesis, extended maximum likelihood methods [46] are applied, either directly [47, 48] or combined with an expectation-maximization algorithm [49, 50]. The latter is described in more detail in section 5.
Another way to take the track information into account is to perform a seeded ring search in regions given by the track direction and momentum [10]. Since only restricted regions corresponding to five hypotheses are scanned, this approach is quicker than the stand-alone ring search. Recently, a new particle identification method was developed which maximizes the likelihood value by allowing the track direction to vary within errors given by the track fit [51].
5 Measurements and Results
5.1 Photon detector performance

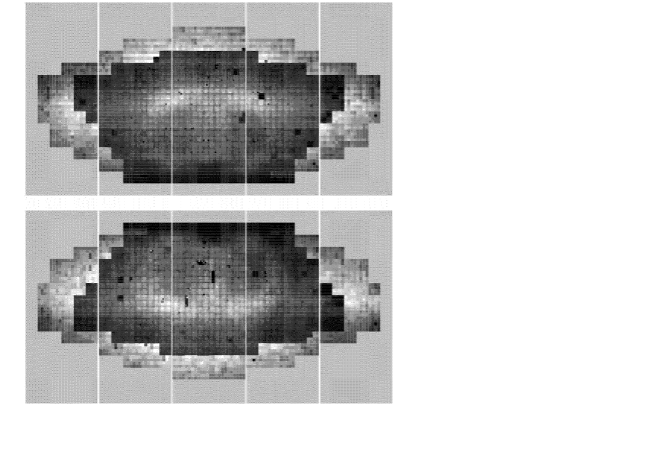
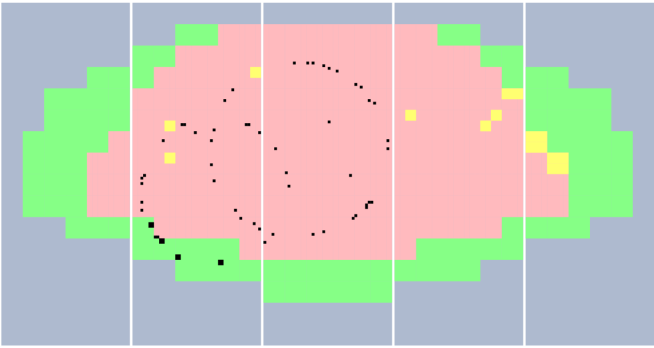
In the first step of the commissioning of the system, some basic parameters were investigated. Fig. 11 gives the count rate versus high voltage for a representative photomultiplier. It is shown that the curves measured in-situ with the HERA proton beam agree nicely with the 90Sr source measurements. The time averaged occupancy is shown in Fig. 12, where the region occupied by M16 PMTs is clearly distinguished from the region occupied by M4 PMTs. The fraction of dead channels is about , and is partly due to missing PMTs and partly due to PMTs which were damaged during the installation phase. Only about 0.3% of the 26816 channels were found to be noisy, and were excluded from the analysis. As a result, very clean rings can be observed in low multiplicity events such as the one shown in Fig. 13. The absence of random hits in the event also confirms the earlier result that the background due to scintillation in the radiator gas is negligible.
5.2 Number of photons
In order to obtain the basic RICH parameters from the data, initially only events with a small number of Čerenkov rings were analyzed [35]. For each ring, the number of photon hits was counted and the Čerenkov angle was determined, obtaining a point in Fig. 14. It is seen that the observed rings follow the expected dependence of the number of photons versus the Čerenkov angle. The largest measured Čerenkov angle of 52.4 mrad also corresponds to the expectation for particles (). The parameter was calculated for each of the isolated rings and the distribution is plotted in Fig. 15, from which it is seen that the mean value is 42 cm-1. This value corresponds to 33 detected Čerenkov photons for particles.


5.3 Angular resolution


To determine the Čerenkov angle uncertainty given by a single Čerenkov photon, tracks with known identity are selected. For each track within a given momentum interval, one fills a histogram with the photon hits at their reconstructed Čerenkov angle, so that the hits due to Čerenkov rings should show up as a peak, as shown on Fig. 16. The distribution was fitted with a Gaussian function and polynomial background. The resulting momentum dependence of the single photon resolution is shown in Fig. 17. As expected, the single photon resolution depends on the particle momentum. For the high momentum tracks the resolutions of 0.81 mrad and 1.0 mrad were measured for the regions covered by M16 and M4 PMTs, respectively. The difference between the measured single photon resolution and the expected intrinsic resolution (as shown in Fig. 17) is attributed to the error in the measurement of charged particle trajectory, which was not taken into account in the calculation of the expected intrinsic Čerenkov angle uncertainty (Table 1).
The intrinsic resolution of the RICH counter was studied by the stand-alone ring search analysis [52], and turned out to be consistent with the expected values. The intrinsic resolution in Čerenkov angle given by a single Čerenkov photon was also obtained with the aid of hits in the electromagnetic calorimeter [53]. For the selected set of tracks with cluster energy above 50 GeV, the center of the Čerenkov ring is accurately determined from the straight line connecting the center of the cluster with the wire target (the magnetic field was off for this measurement). The single Čerenkov photon resolutions obtained correspond to = 0.7 mrad ( = 1.0 mrad) for the M16 (M4) PMTs, in good agreement with expected values given in Table 1.
The particle identification capabilities are affected by the high multiplicity of rings in a single event. Typically 50 overlapping rings are present in an event of which about 1/3 could be associated with measured tracks, while the rest belong to tracks coming from secondary interactions. As a result, channel occupancies in some regions are as large as 25%. We note that in such an environment the resolution in the Čerenkov angle measurement of a track does not simply scale with the inverse of the square root of the number of detected photons.
6 Particle Identification Performance
To illustrate the particle identification capabilities, a maximum likelihood fit was performed on Čerenkov angle distributions for individual tracks. Fig. 18 shows the resulting bands for different particles in the plot of reconstructed Čerenkov angle versus momentum, as obtained by analyzing a sample of measured data.

Two methods are routinely used for particle identification, a ring search based and a track based algorithm. The ring search based particle identification combines the stand-alone and seeded approach discussed in Section 3.5. In the first step, the stand alone reconstruction is attempted and rings found are matched with tracks. In the next step, tracks found by the vertex detector and the tracking detectors, that were not matched with a RICH ring, are used as seeds in a seeded ring search.
For the track based particle identification the extended likelihood method is used [46], combined with the expectation-maximization algorithm. The method is described in detail in [49, 50]. The first step in the method is the calculation of Čerenkov angle (as described in [29]) for all track-photon pairs with the Čerenkov angle smaller than 70 mrad. The Čerenkov angles of the pairs are stored in a list, together with a probability (weight, ) that the photon from a pair is emitted by the track of that pair. Initially the weights are set to , where is the number of tracks corresponding to a specific photon hit. In the next step the expectation-maximization algorithm is applied to the list of pairs. The result of the algorithm is a set of new values of weights . In this way the track-photon pair which is more likely to be the right one, gets a larger weight.
In the last step the extended likelihood probabilities are calculated for 6 possible hypotheses for the identity of a track: electron, muon, pion, kaon, proton and other. The last one represents the case, where the distribution of Čerenkov angles of photons for a given track is consistent with the background. The resulting likelihood probabilities have the range of values between 0 and 1 and are normalized so their sum equals to one. We note that the background level is determined on an event-by-event basis for each individual track.
The selection of tracks belonging to a particular particle type is made by applying a cut on the appropriate likelihood. For easier use, three levels of selection are defined: soft, medium and hard. The levels are set to 0.05 (soft), 0.50 (medium) and 0.95 (hard) for pion selection and 0.05 (soft), 0.30 (medium) and 0.95 (hard) for kaon or proton selection.
To determine the efficiencies and misidentification probabilities from the measured data, an a priori knowledge of particle types is required. The following reconstructed decays were used: , as a source of pions, and as a source of protons, antiprotons and pions, and , as a source of kaons. For the first two decays a very clear signal in the invariant mass plot is obtained by cutting on the secondary vertex distance and removing the reflections (, in , and similarly for and ). The decay products come from the primary vertex together with roughly 10 other particles. The invariant mass plot shows a huge combinatorial background. To reduce the background, one of the particles was used to tag the decay by identifying it as a kaon. The other one was used for efficiency and misidentification evaluation. In all cases, the number of particles of a given type surviving the selection criteria, and the number of all particles of the same type in a selected momentum bin were obtained by fitting a Gaussian plus a linear function to the invariant mass plots.

The results are presented in Fig. 19. At medium selection criteria, kaon identification efficiency for momenta between 10 GeV/c and 60 GeV/c lies in a range from 60% to 95%, with typically about 5% pion mis-identification probability. The corresponding proton identification efficiency for momenta from 20 GeV/c to 60 GeV/c lies in a range between 60% and 80% with less than 5% pion mis-identification probability. In the region below kaon and proton Čerenkov threshold, the efficiencies are 70% for kaons (from 5 GeV/c to 10 GeV/c), and from 60% to 80% for protons (momentum region between 5 GeV/c and 20 GeV/c) with less than 20% pion mis-identification. Below 5 GeV/c the performance is degraded due to track direction uncertainty caused by multiple Coulomb scattering, and a small number of Čerenkov photons for pion tracks.
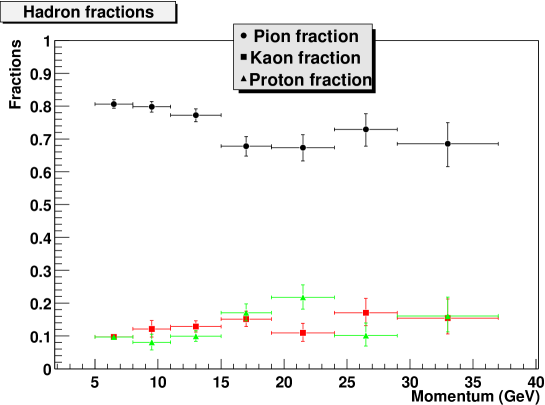
Examples of performance and impact on physics analyses are shown in Figs. 20-22. From Figs. 20 and 21, it is seen that the inclusion of the requirement that both tracks are identified improves the signal to background ratio in the and decays. By using the particle identification as provided by the RICH counter, a measurement of hadron fractions was performed [48]. The results shown in Fig. 22, agree with Monte Carlo predictions.


7 RICH as a Tracking Device
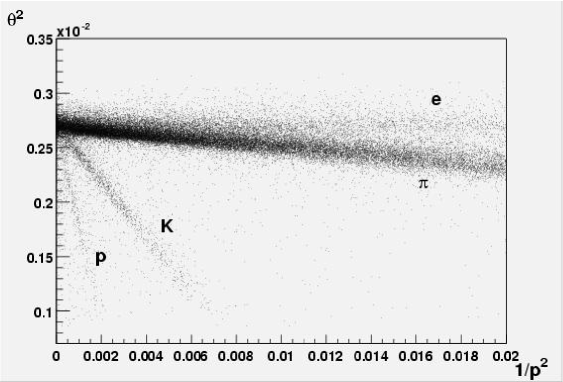
The RICH can also serve as a tracking device [52]. This turned out to be very useful in the initial phase of the HERA-B experiment when the main tracking system was not available. From the centers of the rings found on the photon detector by the stand-alone ring search algorithm, track directions were deduced. In the non-bending plane they were matched with track candidates from the silicon vertex detector. From the deflection in the bending plane the momentum of the particle could then be determined. With both the Čerenkov angle and momentum deduced from the data, an excellent particle identification was possible even without the main tracking system, as illustrated in Fig. 23.
8 Summary
The HERA-B ring imaging Čerenkov detector behaves as expected in all respects. The detector parameters, 33 detected photons for particle, photons/cm and single photon resolutions of = 0.7 mrad (1.0 mrad) for regions with finer (coarser) granularity, are in very good agreement with design values. Estimates of the basic parameters obtained from measurements of physical properties of RICH components agree well with the direct measurements. Therefore, we conclude that the functioning of the counter is well understood. Results on particle identification of highly populated events are also satisfactory and meet the requirements. Finally, it is worth adding that during the 4 years the detector has been in operation, not the least degradation of performance has been observed.
9 Acknowledgments
We want to express our thanks to the DESY laboratory for the strong support since the conception of the HERA-B experiment. We are especially grateful to the following persons and their groups: M. Bosteels (CERN), J. Eržen (IJS Ljubljana), K. Ludwig (DESY), E. Michel (DESY), H.B. Peters (DESY), P. Pietsch (DESY), M. Pohl (DESY Zeuthen), J. Spengler (MPI Heidelberg), and T. Stoye (DESY). We acknowledge the support from the U.S. Department of Energy (DOE), Ministry of Education, Science and Sports of Slovenia, Fundação para a Ciência e Tecnologia of Portugal, Spanish CICYT under the contract AEN99-0483, Internationales Büro, Jülich, and the Texas Advanced Research Program.
References
- [1] T. Lohse et al., Proposal for HERA-B, DESY PRC-94/02, May 1994.
- [2] P. Križan, R. Mankel, D. Ressing, S. Shuvalov, M. Spahn, Nucl. Instr. A 351 (1994) 111.
- [3] J.L. Rosen, Nucl. Instr. Meth. A 408 (1998) 191.
- [4] S. Korpar et al., Nucl. Instr. and Meth. A 433 (1999) 128.
- [5] E. Fokitis et al, Nucl. Physics Proc. Suppl. B44 (1995) 246; E. Fokitis et al, Nucl. Instr. and Meth. A 371 (1996) 255.
- [6] R. Pestotnik, Diploma Thesis, University of Ljubljana, Ljubljana (1996).
- [7] H12 003, CYRO Industries Data Sheet.
-
[8]
D. Broemmelsiek, J. Pyrlik,
http://www-hera-b.desy.de/subgroup/detector/
rich/rich/gas_system/Welcome.html, Hamburg (2001). -
[9]
M. Bosteels, HERA-B RICH Gas System,
http://st-support-cooling-
electronics.web.cern.ch/st-support-cooling-electronics/GasSystemWeb/
HeraB/DescrgazRICH1vessel.HTM, Geneva (2002). - [10] D. Dujmić, Doctoral thesis, University of Texas, Austin (2001).
- [11] D. Dujmić, K. Reeves, HERA-B RICH Note 97-182, Hamburg (1997).
- [12] A. Gorišek, P. Križan, S. Korpar and M. Starič, Nucl. Instrum. Meth. A 433 (1999) 408.
- [13] T. Hamacher et al., Nucl. Instr. and Meth. A 371 (1996) 289.
- [14] P. Križan, M. Cindro, V. Cindro, S. Korpar, G. Omahen, A. Stanovnik, M. Starič, Nucl. Instr. and Meth. A 364 (1995) 243.
- [15] P. Križan, S. Korpar, M. Starič, A. Stanovnik, M. Cindro, D. Škrk, M. Zavrtanik, T. Hamacher and E. Michel, 1994 IEEE NSS Conference Record, Volume 2 (1995) 985.
- [16] J. Pyrlik at al., Nucl. Instr. and Meth. A 414 (1998) 170.
- [17] S. Korpar, P. Križan, A. Stanovnik, M. Starič, D. Škrk, IEEE Trans. Nucl. Sci. Volume 46 (1999) 317.
- [18] P. Križan, S. Korpar, M. Starič, A. Stanovnik, M. Cindro, D. Škrk, M. Zavrtanik, T. Hamacher, E. Michel, Nucl. Instr. and Meth. A 371 (1996) 151.
- [19] P. Križan et al., Nucl. Instr. and Meth. A 387 (1997) 146.
- [20] Hamamatsu Data Sheets for R5900-M16 and R5900-M4 Photomultipliers
- [21] P. Križan, S. Korpar, R. Pestotnik, M. Starič, A. Stanovnik, E. Michel, C. Oehser, W. Schmidt-Parzefall, A. Schwarz, T. Hamacher, D. Broemmelsiek, J. Pyrlik, Nucl. Instr. and Meth. A 394 (1997) 27.
- [22] S. Korpar et al., Nucl. Instr. and Meth. A 478 (2002) 391; P. Križan, ICFA Instrum. Bull. Volume 19 (1999) 3.
- [23] S. Korpar et al., Nucl. Instr. and Meth. A 442 (2000) 316.
- [24] V. Cindro, S. Korpar, P. Križan, A. Stanovnik, M. Starič, D. Škrk, Nucl. Instr. and Meth. A 337 (1994) 609.
- [25] J. Pyrlik and K. Lau, HERA-B Note 97-141, DESY, Hamburg (1997).
- [26] J. McGill, R. Schwitters, HERA-B Note 96-278, DESY, Hamburg (1996); D. Broemmelsiek, Nucl. Instr. and Meth. A 433 (1999) 136.
- [27] Lenses were manufactured by Wahl Kunststoffoptik GmbH, the material used was PMMA UV.
- [28] R. Eckmann, M. Ispirian, S. Karabekyan, J. McGill, R. Schwitters, HERA-B Note 97-162, DESY, Hamburg (1997).
- [29] P. Križan, M. Starič, Nucl. Instr. and Meth. A 379 (1996) 124.
- [30] R. Schwitters, HERA-B Note 97-088, DESY, Hamburg (1997); D. Dujmić, R. Schwitters, HERA-B Note 98-052, DESY, Hamburg (1998).
- [31] S. Korpar, R. Pestotnik, P. Križan, IJS Report, IJS-DP-7615, Ljubljana (1997); HERA-B Note 97-079, DESY, Hamburg (1997).
- [32] K. Berkhan, H. Kolanoski, M. Pohl, U. Uwer and S. Vassiliev (for the HERA-B Collaboration), Proceedings of the Fifth Workshop on Electronics for LHC Experiments, Snowmass, Colorado, USA, CERN 99-09.
- [33] F.M. Newcomer et al., IEEE Trans. Nucl. Sci. Volume 40 (1993) 630.
- [34] I. Ari, M. Chmeissani, P. Conde, Ll. Garrido, D. Gascon, R. Miquel, D. Peralta and J. Sieiro, Nucl. Instr. and Meth. A 457 (2001) 627.
- [35] D. Škrk, Doctoral thesis, University of Ljubljana, Ljubljana (1999).
- [36] H. Albrecht et al. (HERA-B Outer Tracker Group), to be submitted to Nucl. Instr. and Meth.
- [37] K. Reeves, Doctoral thesis, University of Texas, Austin (2001).
- [38] Analog Devices, ADSP-2106x SHARC User’s Manual, First Edition (1995).
- [39] FieldPoint User Manual, National Instruments Corporation.
- [40] V. Rybnikov, HERA-B Note 99-166, DESY, Hamburg (1999).
- [41] H. Calção et al., IEEE Trans. Nucl. Sci. Volume 46 (1999) 377; H. Calção et al., HERA-B Note 99-009, DESY, Hamburg (1999).
- [42] P. Glässel, Nucl. Instr. and Meth. A 433 (1999) 17.
- [43] R. Schwitters, HERA-B Note 98-088, DESY, Hamburg (1998); R. Eckmann, D. Dujmić, HERA-B Note 00-004, DESY, Hamburg (2000).
- [44] D. Dujmić, HERA-B Note 00-016, DESY, Hamburg (2000).
- [45] J. Carvalho, HERA-B Note 99-008, Hamburg (1999); M. Ispiryan, S. Ramachandran HERA-B Note 99-184, Hamburg (1999); P. Križan, D. Tement, HERA-B Note 98-157, Hamburg (1998).
- [46] P. Baillon, Nucl. Instr. and Meth. A 238 (1985) 341.
- [47] I. Ariño, Ll. Garrido, HERA-B Note 99-108, Hamburg (1999).
- [48] I. Ariño, Doctoral thesis, University of Barcelona, Barcelona (2001).
- [49] M. Starič, P. Križan, Nucl. Instr. and Meth. A 433 (1999) 279.
- [50] R. Pestotnik, Doctoral thesis, University of Ljubljana, Ljubljana (2001).
- [51] R. Schwitters, HERA-B Note 01-066, Hamburg (2001); D. Dujmić, HERA-B Note 01-103, Hamburg (2001).
- [52] R. Schwitters et al., HERA-B Note 00-020, DESY, Hamburg (2000); D. Dujmić, R. Eckmann and R. F. Schwitters, Nucl. Instrum. Meth. A 461 (2001) 563.
- [53] P. Križan et al., Nucl. Instrum. Meth. A 471 (2000) 30.