The NAIAD experiment for WIMP searches at Boulby mine and recent results
B. Ahmed a, G. J. Alner b, H. Araujo a,
J. C. Barton c, A. Bewick a,
M. J. Carson d, D. Davidge a, J. V. Dawson a, T. Gamble d,
S. P. Hart b,
R. Hollingworth d, A. S. Howard a, W. G. Jones a,
M. K. Joshi a,
V. A. Kudryavtsev d 111Corresponding author,
e-mail: v.kudryavtsev@sheffield.ac.uk, T. B. Lawson d,
V. Lebedenko a,
M. J. Lehner d 222Now at the University of Pennsylvania, Philadelphia,
PA 19104, USA, J. D. Lewin b, P. K. Lightfoot d,
I. Liubarsky a,
R. Lüscher a, J. E. McMillan d, B. Morgan d,
G. Nicklin d,
S. M. Paling d, R. M. Preece b, J. J. Quenby a,
J. W. Roberts b,
M. Robinson d, N. J. T. Smith b, P. F. Smith b,
N. J. C. Spooner d 333Corresponding author,
e-mail: n.spooner@sheffield.ac.uk,
T. J. Sumner a, D. R. Tovey d
a Blackett Laboratory, Imperial College of Science, Technology and Medicine, London SW7 2BZ, UK
b Particle Physics Department,
Rutherford Appleton Laboratory, Chilton, Oxon
OX11 0QX, UK
c Department of Physics, Queen Mary, University of London, London E1 4NS, UK
dDepartment of Physics and Astronomy, University of Sheffield, Sheffield S3 7RH, UK
Abstract
The NAIAD experiment (NaI Advanced Detector) for WIMP dark matter searches at Boulby mine (UK) is described. The detector consists of an array of encapsulated and unencapsulated NaI(Tl) crystals with high light yield. Six crystals are collecting data at present. Data accumulated by four of them (10.6 kgyear exposure) have been used to set upper limits on the WIMP-nucleon spin-independent and WIMP-proton spin-dependent cross-sections. Pulse shape analysis has been applied to discriminate between nuclear recoils, as may be caused by WIMP interactions, and electron recoils due to gamma background. Various calibrations of crystals are presented.
Key words: Scintillation detectors, Inorganic crystals, Dark matter, WIMP, Pulse shape analysis
PACS: 29.40.Mc, 14.80.Ly, 23.60.+e, 95.35.+d, 95.30.Cq
Corresponding authors: V. A. Kudryavtsev and N. J. C. Spooner, Department of Physics and Astronomy, University of Sheffield, Hicks Building, Hounsfield Rd., Sheffield S3 7RH, UK
Tel: +44 (0)114 2224531; Fax: +44 (0)114 2728079;
E-mail: v.kudryavtsev@sheffield.ac.uk, n.spooner@sheffield.ac.uk
1. Introduction
The UK Dark Matter Collaboration (UKDMC) has been operating NaI(Tl) detectors at the Boulby Mine underground site for several years [1]. Limits on the flux of weakly interacting massive particles (WIMPs), that may constitute up to of the mass of the Galaxy, have been published using the data from the first encapsulated detector [2, 3]. Pulse shape analysis (PSA) has been applied to the data to distinguish between slow scintillations arising from background electron recoils and fast scintillations due to nuclear recoils, which are expected from WIMP-nucleus interactions [4]. Improved limits were then obtained by the DAMA experiment, which also used NaI(Tl) scintillation detectors with PSA and had larger statistics [5].
Since then, the DAMA group moved to a simple annual modulation analysis of the background rate in its crystals without using PSA. The group claims that it observes an annual modulation consistent with the expected signal from WIMP-nucleus interactions with a specific set of WIMP parameters [6].
Although several existing experiments have a potential to probe the whole region of WIMP parameters allowed by the DAMA signal (see, for example, Refs. [7, 8, 9, 10], and Ref. [11] for recent review), they use other techniques and other target materials. This leaves room for speculation about possible uncertainties in the comparison of results. These uncertainties are related to systematic effects and nuclear physics calculations. Running an experiment, NAIAD, with the same target (NaI) and detection technique but different analysis would help in the understanding of possible systematic effects. Such an experiment will also be complemetary to more sensitive detectors in studying regions of WIMP parameter space favoured by the DAMA positive signal.
The advance of the UKDMC NaI(Tl) experiment has been blocked for a few years by the discovery of a fast anomalous component in the data from several encapsulated crystals [1]. These events were faster than typical electron recoil pulses and faster even than nuclear recoil pulses [1, 12]. Similar events have also been seen by the Saclay group [13]. The most plausible explanation of these events at the moment is implanted surface contamination of the crystal by an alpha-emitting isotope from radon decay [14, 15].
NAIAD was constructed with unencapsulated crystals to allow better control of the crystal surface, to reduce the background due to such events and to improve the light collection [16]. Such an experiment could probe the region of WIMP parameters allowed by the DAMA experiment using a similar detection technique and target, and reach the region favoured by some SUSY models [16]. NaI has an advantage of having two targets with high and low masses, thus reducing uncertainties related to nuclear physics calculations. The detectors are sensitive to both spin-independent and spin-dependent interactions. The experiment is complementary to other dark matter experiments at Boulby, such as ZEPLIN [10] (xenon gas and double-phase xenon detectors) and DRIFT [17] (time projection chamber with directional sensitivity). The array of NaI(Tl) detectors can also be used as a diagnostic array to study background and systematic effects for other experiments at Boulby. (Note that the new data from this array are indeed free from an anomalous fast component [15]).
In this paper we present the status of the NAIAD array (NaI Advanced Detector) at Boulby. Section 2 describes the experimental set-up. The analysis procedure, various calibrations and their results are presented in Section 3. WIMP limits from data collected up to the end of 2001 are shown in Section 4. Our conclusions are given in Section 5.
2. NAIAD experiment
The NAIAD array is operational in the underground laboratory at Boulby mine (North Yorkshire, UK) at a vertical depth of about 1100 metres. In its final stage the NAIAD array will consist of eight NaI(Tl) crystals from different manufacturers (Bicron, Hilger, VIMS). At present (May 2002) 6 detectors are running with a total mass of 46 kg. Two detectors contain encapsulated crystals, while 4 other crystals are unencapsulated. To avoid their degradation by humidity in the atmosphere, the unencapsulated crystals have been sealed in copper boxes filled with dry nitrogen. The UKDMC moved away from the original proposal to run the crystals in pure mineral oil [16] because of an observed slow degradation of one of the crystals with that system.
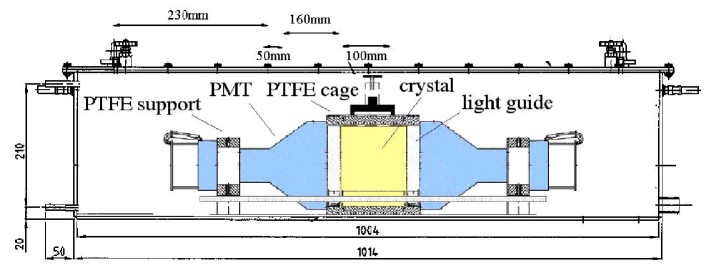
A schematic view of one detector is shown in Figure 1. A crystal (in the middle) is mounted in a 10 mm thick solid PTFE (polytetrafluoroethylene) reflector cage and is coupled to light guides. The two 4-5 cm long quartz light guides are also mounted in the PTFE cages and are coupled to 5 inch diameter low background photomultiplier tubes (PMTs), ETL type 9390UKB. Only selected low background materials are used in the detector design including oxygen-free high-conductivity copper and PTFE.
Temperature control of the system is achieved through copper coils outside the copper box. Chilled water is constantly pumped through the coils maintaining the temperature of the crystals at C during a single run, where depends on the crystal and is typically about C. The temperature of the crystal, ambient air, water in the pipes and copper is measured by thermocouples. Although the temperature differs from one crystal to another, for any particular crystal it remains stable within C during a single run. If, for any reason (for example, chiller failure), the variation of crystal temperature exceeds the predefined limit, the data from these periods are not included in the analysis. If any changes in the experimental set-up result in a change of the mean temperature of the crystal, the data from different runs are not combined together, but assumed to come from different experiments, so only the resulting limits can be combined.
Pulses from both PMTs are integrated using a buffer circuit and then digitised using a LeCroy 9350A oscilloscope driven by a Macintosh computer running Labview-based data acquisition (DAQ) software. The digitised pulse shapes (5 s total digitisation time, 10 ns digitisation accuracy) are passed to the computer and stored on disk. The gain of the PMTs is set to give about 2.5 mV per photoelectron. This has been found to be the optimum between the high gain required by digitisation and noise level, and low gain to avoid afterpulses. Low threshold discriminators are typically set to 10 mV threshold, which corresponds to about 4 photoelectrons (pe) or about 1 keV for the crystal with total light yield of 8 pe/keV.
Copper boxes containing the crystals are installed in lead and copper “castles”, to shield the detectors from background due to natural radioactivity in the surrounding rock. The data reported here were taken without neutron shielding. Wax and polypropylene neutron shielding around the castles has now been installed, thus improving the sensitivity of the experiment to WIMP interactions.
The temperature of the crystals is monitored by the “slow control” part of the data acquisition. Crystal temperature and ambient temperature are recorded in the data stream for each event. The temperature of the lead in the castle and water in the pipes is stored in “log” files. The slow control part of the DAQ is also responsible for daily calibration of the detectors with gamma sources, described in Section 3.
The light yield of the crystals is obtained from measurement of the single photoelectron pulses (about 2.5 mV after electronic noise subtraction) and the 122 keV -peak from 57Co. The six crystals currently collecting data have light yield from 4.6 up to 9 pe/keV. The light yield is checked every 2-4 weeks and is found to be stable within 10% for all crystals. The longest operated crystal, running since the summer of 2000, shows a degradation of no more than 10% over the whole operation period.
After the first period reported here, the data acquisition was changed from the oscilloscope based system described above to one based on fast Acqiris CompactPCI digitisers. This has allowed significant reduction in the dead time of the data acquisition, which is particularly important for high rate calibration runs. The cost of DAQ hardware has been reduced dramatically, since several detectors can now be controlled by one computer, and high-cost oscilloscopes have been substituted by Acqiris digitisers.
3. Analysis procedure and calibrations
Final analysis has been performed on the sum of the pulses from the two PMTs attached to each crystal. The parameters of the pulses from each PMT have been used to apply so-called asymmetry cuts (described below) to remove those events with obvious asymmetry between the pulses from each PMT. Our standard procedure of data analysis involves fitting of a single exponential to each integrated pulse in order to obtain the index of the exponent, , the amplitude of the pulse, , and the start time, . The scintillation pulses from nuclear and electron recoils have been shown to be nearly exponential in shape [4]. In addition to these, the mean time of the pulse (mean photoelectron arrival time), as an estimate of the time constant, of the fit, number of photoelectrons and the energy are also calculated for each pulse. The conversion of the pulse amplitude to the number of photoelectrons and the energy is done using pre-determined conversion factors, which come from energy and single photoelectron calibrations. These calibrations are performed typically every 2-4 weeks to ensure that there are no changes in the PMT gains or crystal degradation. (Note that the monitoring of the temporal behaviour of the energy spectrum in most cases can also reveal if changes have occurred in the system). Energy calibration is performed with 57Co gamma-ray source (122 keV line).
For each run (or set of runs) the “energy – time constant” () distribution is constructed. If all operational settings (including temperature) are the same for several runs, the () distributions for these runs are summed together. Time periods with temperature of the crystal outside a predefined range have been removed from the analysis. Also all events with less than 20 ns in either PMT are excluded.
To reduce PMT noise and, particularly, events where a spark (flash) in the dynode structure of one PMT [18] is seen by both PMTs, the so-called “asymmetry cuts” are applied. These cuts are based on Poisson statistics and use the asymmetry in amplitude, time constant and start time of noise (non-scintillation) pulses from the two PMTs to remove them.
For any small energy bin (1 keV width, for example), the time constant distribution can be approximated by a Gaussian in ((Gauss) function) [2, 12] (for a more detailed discussion of the distributions see [19] and references therein):
| (1) |
The -distributions are fitted with a Gaussian in with three free parameters: mean time constant , width and normalisation factor . In experiments where a second population is seen (for example, nuclear recoils from a neutron source or possible WIMP-nucleus interactions), the resulting -distribution can be fitted with two (Gauss) functions with the same width (we assume the same width for both populations since the width is determined mainly by the number of collected photoelectrons).
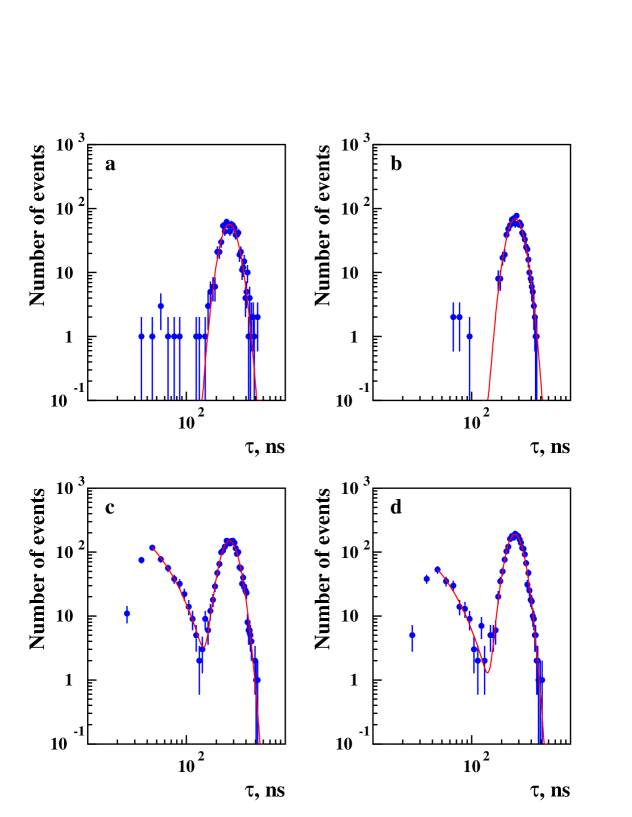
The aim of the analysis procedure is to find the second population of events in -distributions or to set an upper limit on its rate. To reach this, the response of the crystals to various radiations should be known. This is achieved through the measurements of the -distributions for all energies of interest (2-40 keV) with gamma-ray (60Co) and neutron (252Cf) sources. Photons from high-energy gamma-ray source produce Compton electrons in the crystal volume similar to those initiated by gamma-ray background at Boulby. Neutrons collide elastically with the nuclei of the crystal giving nuclear recoils similar to those expected from WIMP-nucleus elastic scattering. Calibration experiments were performed on all crystals at the surface prior to moving the crystals underground. Although the temperature was not maintained exactly the same as the operational temperature in the mine, this was found to have no effect on the ratio of the mean time constants of nuclear and electron recoils, .
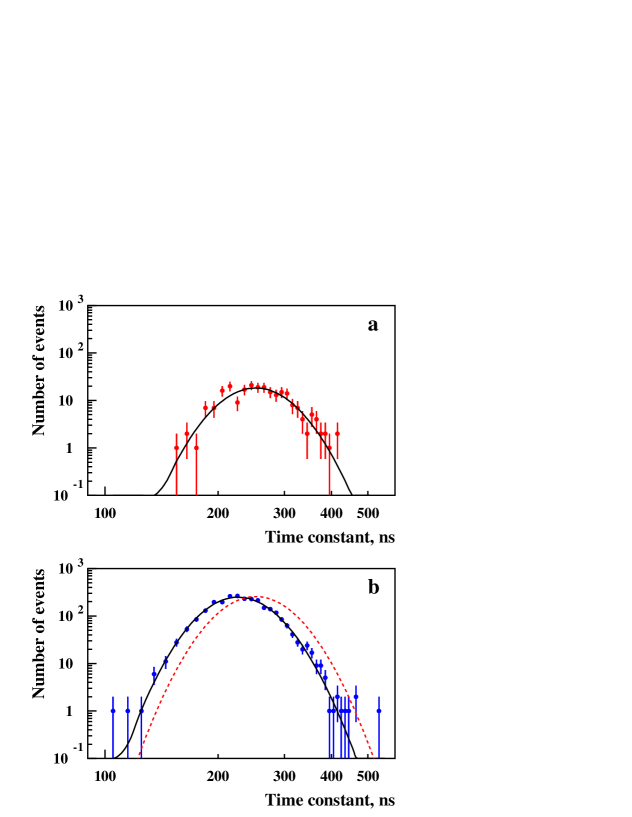
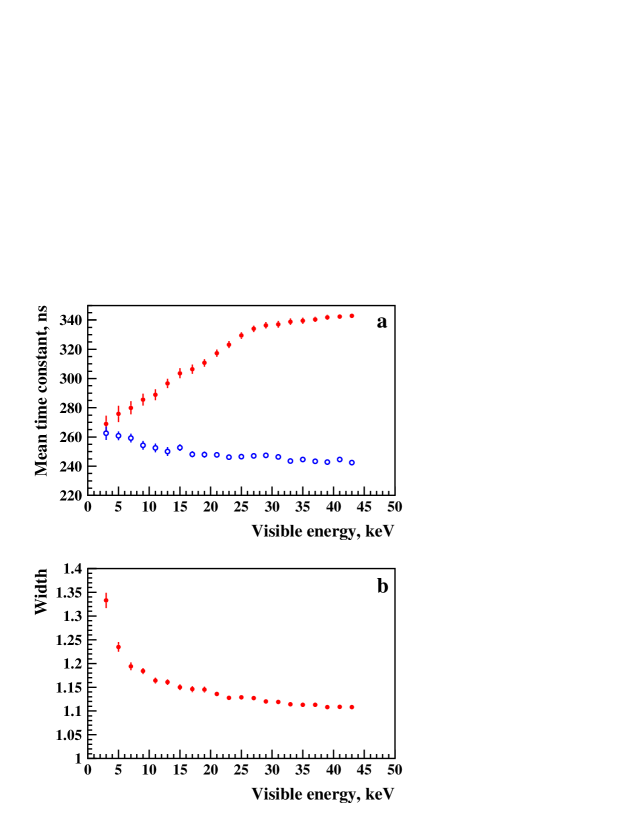
Figure 2 shows the -distributions of events in one of the crystals (DM77) collected with gamma-ray (a) and neutron (b) sources for 7-8 keV visible energy. Figure 3 shows the mean time constants of electron and nuclear recoils (a) and the width of the (Gauss) fit (b) as functions of energy. As can be seen from Figure 3 the discrimination between nuclear and electron recoils is possible only at visible energies more than 4 keV. However, for crystals with high light yield, the width, , is small and the discrimination power is significant even at low energies [16]. Our measurements of the time constant as a function of energy are in agreement with the results reported in Ref. [13].
Another critical feature of the detector response is the energy resolution. It is important in the procedure of setting limits on the rate of nuclear recoils produced by WIMP-nucleus interactions. The procedure requires calculation of the recoil spectra as functions of visible energy for various WIMP masses and their comparison with the measurements [20]. A recoil spectrum calculated in a particular model should be folded with the detector response function to obtain a visible energy spectrum. The detector response function in this case is the energy resolution function, which gives the probability distribution of the deposited energy being seen by a detector as a certain visible energy. Assuming the probability distribution is a Gaussian function (for a Poisson process with large number of photoelectrons), the energy resolution is characterised by the width, , of the Gaussian function or by the full width at half maximum of the distribution, FWHM (the latter is applicable to any form of the detector response function).
The energy resolution of the NAIAD detectors is normally measured during the standard procedure of energy calibration with a 57Co source (122 keV line) performed every 2-4 weeks. However, nuclear recoils from WIMP-nucleus interactions can be seen mainly at low visible energies (4-30 keV). Ideally, we need to perform the measurements of energy resolution as a function of energy at low energies. However, practically this is impossible because we cannot access the surface of the crystals sealed in the copper boxes during the experiment, and low energy photons will be absorbed in the copper or other materials surrounding the crystal. Moreover, even for unencapsulated crystals, any calibration with low energy photons refers only to the surface area close to the gamma-ray source (due to the high photon absorption). The uniformity of the crystal is essential for the use of such a calibration.
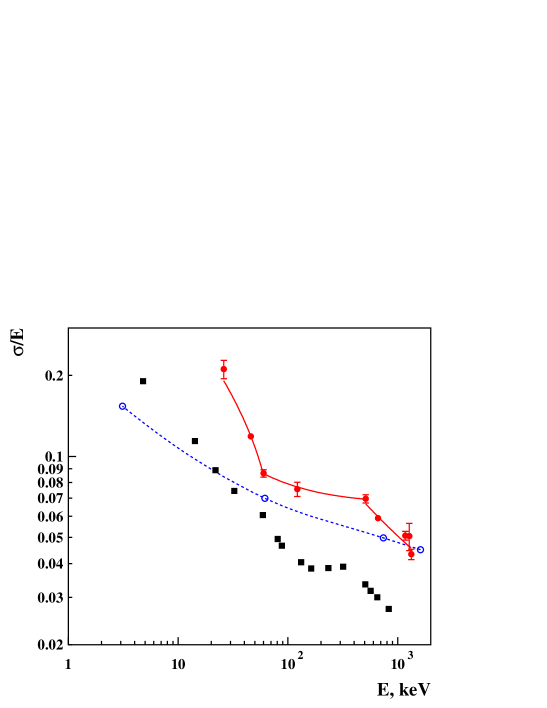
Prior to moving the detectors underground the energy resolutions of the crystals at various energies were measured with a number of gamma-ray sources. Figure 4 shows the width of the Gaussian fit to the measured gamma-ray line as a function of photon energy (filled circles) for one of the UKDMC crystals (DM77). The gamma-ray sources were attached to the crystal surface during the measurements. For low-energy sources, when the photons are absorbed within a few millimetres or less, the dependence of the energy resolution on the source position was investigated. The energy resolution of the sum of the pulses from the two PMTs was found to be independent of the source position, thus confirming the uniformity of the crystal. (Note, however, that this conclusion refers to the crystal surface only, since low-energy photons cannot penetrate deeply into the crystal volume).
The data presented in Figure 4 cannot be fitted with a single function. Our measurements agree reasonably well with the measurements by Sakai [21], in which a small size ( cm3) NaI(Tl) crystal was used. The data from Ref. [21] are shown by filled squares in Figure 4 (FWHM has been converted to the width of Gaussian fit using the relation: =FWHM/2.35). Both measurements (UKDMC and Ref. [21]) reveal a complicated dependence of the energy resolution on the energy. Three regions with different slopes are clearly seen. Similar effects were reported earlier (see, for example, Ref. [22] and references therein), although for a restricted energy range. Note that the resolution of our crystal is worse than the one reported in Ref. [21] due to the much larger crystal used.
According to the theory of scintillation counting (for discussions see Refs. [22, 23]) the energy dependence of the resolution function is approximated as:
| (2) |
The parameters and have been determined from the best fits to the data in three energy regions, as shown in Figure 4. This procedure has been repeated for all crystals. The energy resolution has been extrapolated to lower energies (4-20 keV) using Eq. (2) with the parameters for low energy region (26-60 keV).
Also shown in Figure 4 are the reported measurements of energy resolution by the DAMA group [24] (open circles, dashed curve is drawn through the centres of the points). At high energies the resolution of DAMA crystals is similar to ours, while at low energies it is much better than ours and even better than that of the much smaller crystals (filled circles from Ref. [21]). The energy dependence of the resolution of the DAMA crystals is different from our measurements and those of Ref. [21]. The lowest energy at which the resolution was measured by the DAMA group, is a little more than 3 keV, but the authors of Ref. [24] did not specify the source of this line. At 4 keV (the minimal energy at which we observed discrimination between electron and nuclear recoil) a typical resolution of NAIAD detectors is about 0.5 (0.56 for DM77 shown in Figure 4), a factor of 3-4 poorer than in the DAMA experiment. The resolution given by DAMA for their crystals is even better than the theoretical limit, determined by the light yield, which contradicts the basic theory of scintillation counting [22]: for a light yield of about 6 pe/keV [25], the resolution limit at 3.2 keV (the first point on the graph [24]) is – poorer than the value reported by DAMA ( [24]).
4. Results and discussion
The UK Dark Matter Collaboration has been operating the detectors of the NAIAD array since the winter of 2000. The first crystal (DM74) was immersed in pure mineral oil and ran for more than six months until degradation of the crystal surface resulted in a significant decrease of the light yield. The second crystal (DM72) was installed in summer of 2000 in a sealed copper box and has been running since then with a loss of light yield of no more than 10%. The data collected with these two crystals have been used to set preliminary limits on the WIMP-proton spin-dependent and WIMP-nucleon spin-independent cross-sections [26, 27].
More crystals were added to the array in 2001. At present six detectors are running with a total mass of 46 kg. None of the 6 crystals show anomalous fast events. Two more crystals are expected to be added in 2002. The final mass of the array will be about 65 kg.
The data from 4 crystals have been used to set the limits on WIMP-nucleus cross-section reported here. The total statistics include five runs, with one of the crystals (DM74) running twice: in mineral oil and in dry nitrogen (after re-polishing). Table 1 shows main characteristics and statistics for all detectors.
The software energy threshold has been set to 2 keV, while the typical energy threshold of discriminators was about 1 keV. An energy range from 2 to 30 keV has been used in the data analysis. Pulse shape discrimination has been applied for pulses exceeding 4 keV. Since there is no visible discrimination between electron and nuclear recoils below 4 keV, the total background rate has been used to set upper limits on the nuclear recoil rate at 2-4 keV.
Figure 5 shows typical time constant distributions at 6-8 keV from data and calibration runs. The PMT noise events are seen at small values of time constants. These events are fitted with an exponential, in addition to the log(Gauss) fit to the scintillation pulses. Figure 5 does not reveal any visible difference between data and calibration runs in terms of time constant distributions (apart from the presence of PMT noise at small ). The limit on the nuclear recoil rate at any particular energy has been obtained by fitting the measured time constant distribution with two (Gauss) functions having known parameters: mean time constants and widths, known from Compton and neutron calibrations. An exponential fit to the PMT noise has been added if necessary. Free parameters thus remaining were the total numbers of electron and nuclear recoils. These numbers have been restricted to non-negative values. The best fit numbers of nuclear recoils have been found to be either zeros or small positive values. The positive values have normally been within 1.5 standard deviations from zero, implying that they were statistical fluctuations around the mean value equal to 0. (Note that negative values have no physical meaning and were not allowed in the analysis). No statistically significant number of nuclear recoils has been found for any energy bin or any crystal under consideration. Thus, the upper limits on the nuclear recoil rate have been obtained for each energy bin and for each crystal. As was mentioned above, the visible energy spectrum of nuclear recoils is the convolution of the calculated spectrum with the detector response function. This means that there is no model-independent procedure of unfolding the expected recoil spectrum from the visible spectrum.
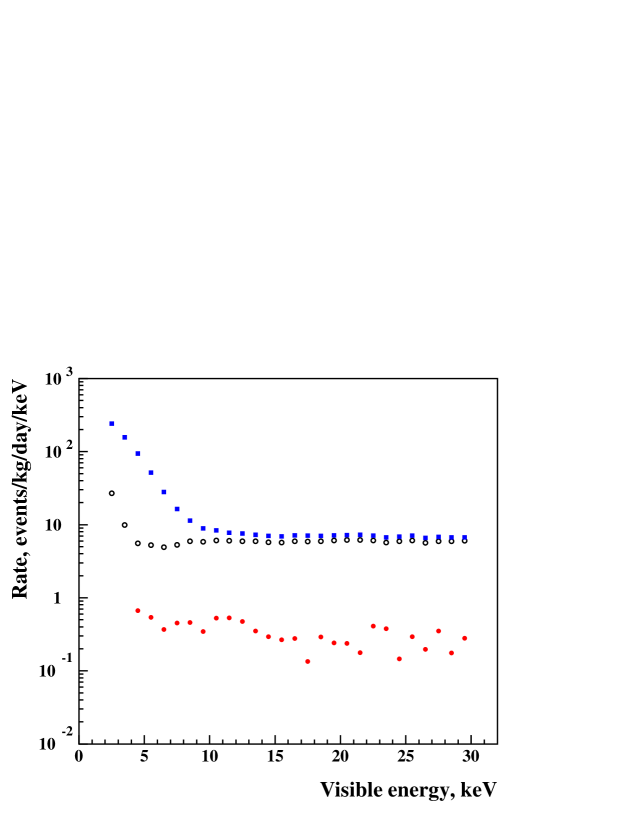
Figure 6 shows a typical total energy spectrum from one of the crystals, spectrum of electron recoils after asymmetry cuts from the fit to the main peak on the time constant distribution, and the 90% C.L. upper limits on the nuclear recoil rate for various energy bins. The limit on the nuclear recoil rate at 4-5 keV for our statistics is typically about (10-20)% of the background rate due to the discrimination power of PSA. Note that the limit on the nuclear recoil rate presented in Figure 6, when analysed in terms of WIMP-nucleon interactions, is the convolution of the expected rate from WIMP interactions and the detector response function. This makes direct comparison of the limits on the rate from different experiments difficult. We found that for all our crystals the rate below 4 keV, where the discrimination cannot be applied, does not contribute much to the limits on the WIMP-nucleus cross-section. This is because of the increase in rate with decrease in visible energy, that gives a factor of 20 difference in a residual rate (after discrimination) between 3-4 keV and 4-5 keV bins. This increase in residual rate is higher than the difference in expected rate from WIMP interactions folded with our typical detector response function. This makes the limit on the cross-section weakly sensitive to the points below the disrimination threshold.
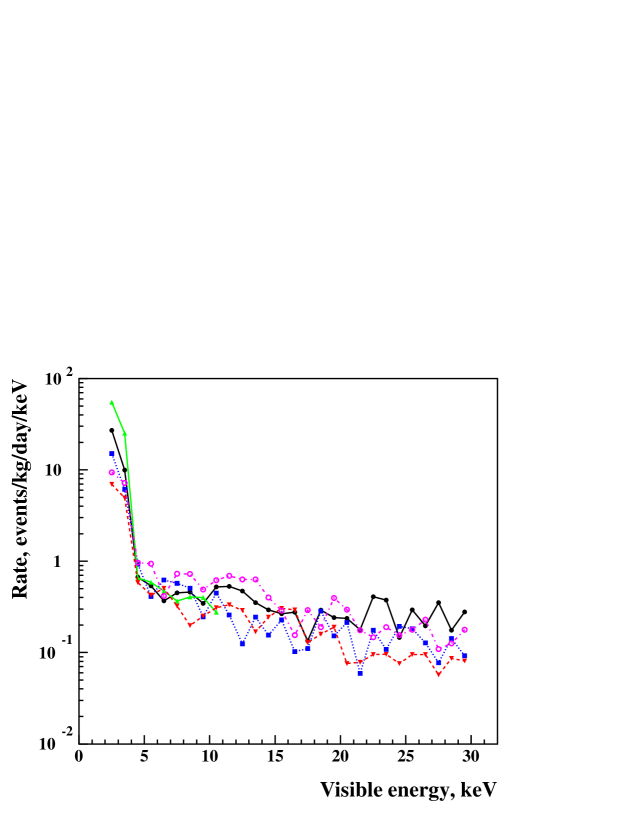
The 90% C.L. limits on the nuclear recoil rate as a function of visible (measured) energy are shown in Figure 7 for each crystal. The limits on the nuclear recoil rate for each energy bin and each crystal have been converted into limits on the WIMP-nucleon spin-independent and WIMP-proton spin-dependent cross-sections following the procedure described by Lewin and Smith [20]. Expected nuclear recoil spectra from WIMP-nucleus interactions have been calculated for a halo model with parameters: = 0.3 GeV cm-3, = 220 km/s, = 650 km/s and = 232 km/s. For the spin-independent case the form factors have been computed using Fermi nuclear density distribution with the parameters to fit muon scattering data as described in Ref. [20]. The WIMP-nucleus scattering has been taken proportional to . For the spin-dependent case a pure higgsino is assumed. The spin factors and form factors have been computed for sodium and iodine nuclei on the basis of nuclear shell model calculations of Ressell and Dean [28] using their “Bonn A potential” results for iodine. The quenching factors (scintillation efficiencies) have been taken as 0.275 for sodium and 0.086 for iodine recoils [4].
The limits on the cross-section for various energy bins, targets (sodium and iodine) and crystals have been combined following the procedure described in Ref. [20] assuming the measurements for different energy bins and different crystals are statistically independent. First, the limits on the cross-sections from various energy bins (for each crystal) have been combined statistically using the equation:
| (3) |
where is the limit on the cross-section for WIMP-nucleon interaction (WIMP mass ) at 90% C.L. from the energy bin with central energy . The index denotes the crystal, while the index denotes the nucleus (sodium or iodine).
Limits for sodium and iodine each ignore the contribution of the other element; a better estimate of the combined limit from NaI is given by:
| (4) |
Note that the fraction of each element by weight was taken into account in the calculation of the interaction rate for each element.
Finally, the limits from different crystals have been combined using the equation below, taking into account that the data were statistically independent and no positive signal was detected in any of the crystals:
| (5) |
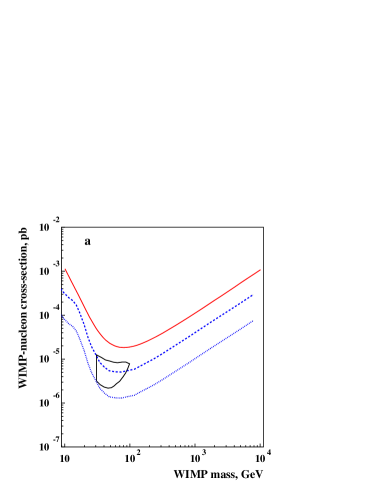
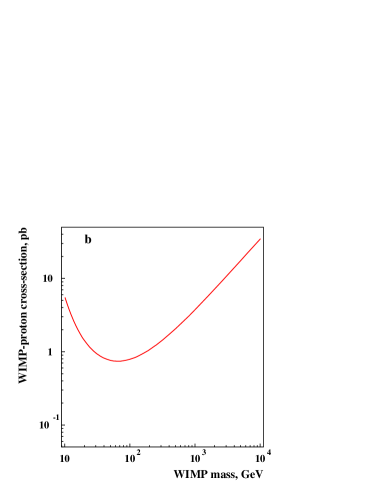
Figure 8a (b) shows the current NAIAD limits on WIMP-nucleon spin-independent (WIMP-proton spin-dependent) cross-section as functions of WIMP mass based on the data described in Table 1. Also shown in Figure 8a are the region of parameter space favored by the DAMA positive annual modulation signal (DAMA/NaI-1 through DAMA/NaI-4) [6] (closed curve), limits on the cross-section set by the DAMA experiment (DAMA/NaI-0) using pulse shape analysis (dashed curve) and the projected limit of DAMA experiment (DAMA/NaI-0 through DAMA/NaI-4, dotted curve), if the DAMA group applies pulse shape discrimination to all available data sets (see [15] for discussion). It is obvious that the DAMA group could confirm or refute the signal, observed in their annual modulation analysis, using pulse shape analysis applied to all five data sets. Note that we do not show here the world best limits on spin-independent cross-sections set by CDMS-I [7], EDELWEISS [8] and ZEPLIN-I [10]. A paper on the ZEPLIN-I experiment, which will discuss this further, is in preparation.
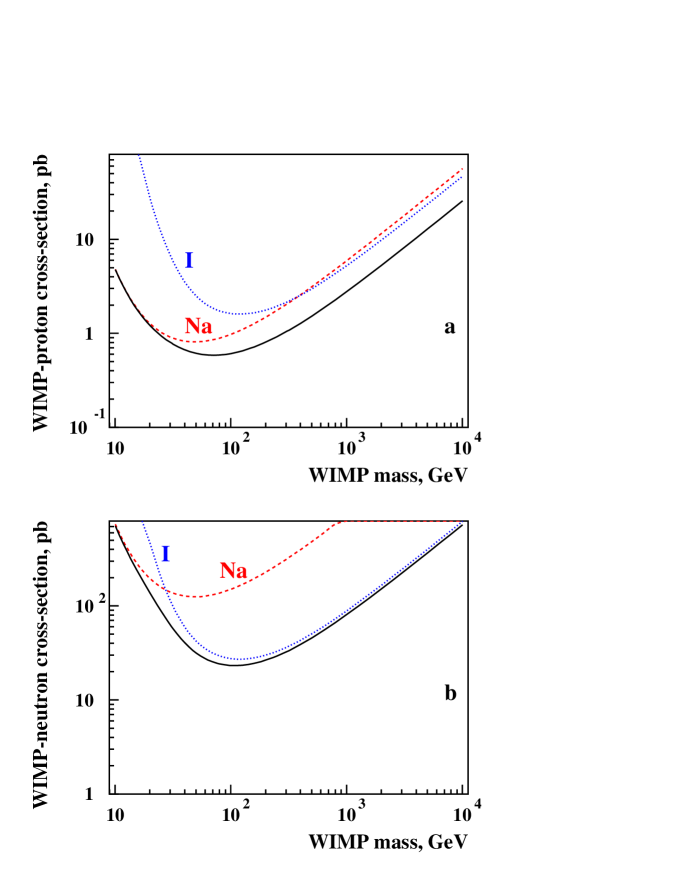
Model-independent limits on spin-dependent WIMP-proton and WIMP-neutron cross-sections, calculated following the procedure described in Ref. [29], are presented in Figure 9.
A further two crystals have been recently added to the array, increasing the total mass to about 65 kg. Recently installed detectors (unencapsulated DM74 in dry air, encapsulated DM80 and DM81) show higher light collection and better discrimination than earlier modules. The latter two were installed at the beginning of 2002 and have a light yield of about 8 photoelectrons/keV. Once sufficient data are collected, these will be included in further analysis.
The sensitivity of the NAIAD array is currently restricted by the presence of PMT noise pulses. These pulses occur mainly when a discharge in the dynodes of one PMT is seen by both of them. The noise is reduced by applying asymmetry cuts as described in Section 3 but is still present in the time constant distributions at low energies (see Figure 5). We plan to investigate this noise in detail and improve the software cuts to eliminate it. Our preliminary estimates show that complete suppression of this noise may result in a factor of 2 improvement in sensitivity.
The sensitivity of the data presented here is also limited by the slow DAQ, based on LeCroy oscilloscopes and Labview software. This restricts the rate and hence the statistics of the calibration runs performed with gamma-ray sources. (Note that increasing the time spent on the calibration runs decreases the time available for real data taking). Thus, the parameters of the time constant distributions are known with a finite accuracy, which is taken into account in the data analysis. Having moved to the fast Acqiris CompactPCI digitisers we expect to collect more events with gamma-ray and neutron sources, improving the accuracy of the best fit parameters.
We are also working on improvements to the pulse fitting procedure, studying more complicated functions to fit the pulse shapes, as was suggested in [4, 19]. Finally, we are looking into more sophisticated ways to set limits on the nuclear recoil rate using Poisson statistics, rather than analysis, which does not work properly with small number of events. All improvements in the analysis, including full suppression of the noise, may increase the NAIAD sensitivity for a given statistics by a factor of 3.
We expect that changes to the DAQ, improvements in the data analysis and light collection, suppression of the PMT noise and increased statistics will result in the improvement of our current limits by a factor of 10 in the next 2-3 years of data taking.
5. Conclusions
The status of the NAIAD experiment for WIMP dark matter search at Boulby mine has been presented. The detector consists of an array of NaI(Tl) crystals with high light yield. Currently six crystals are collecting data. Pulse shape analysis has been used to discriminate between nuclear recoils, possibly caused by WIMP interactions, and electron recoils due to gamma-ray background. We have presented upper limits on the WIMP-nucleon spin-independent and WIMP-proton spin-dependent cross-sections based on the data accumulated by four modules (10.6 kgyear exposure). We expect further improvement in sensitivity by a factor of 10 in the next 2-3 years of data taking based on increased statistics, increased light yield of new crystals and improved data analysis.
6. Acknowledgments
The Collaboration wishes to thank PPARC for financial support. We are grateful to the staff of Cleveland Potash Ltd. for assistance. We also thank the referee for very useful comments.
References
- [1] P. F. Smith et al. Physics Reports, 307 (1998) 275.
- [2] P. F. Smith et al. Physics Letters B, 379 (1996) 299.
- [3] J. Quenby et al. Astroparticle Physics 5 (1996) 249.
- [4] D. R. Tovey et al. Physics Letters B, 433 (1998) 150.
- [5] R. Bernabei et al. Physics Letters B, 389 (1996) 757.
- [6] R. Bernabei et al. Physics Letters B, 480 (2000) 23.
- [7] R. Abusaidi et al. (CDMS Collaboration). Phys. Rev. Lett., 84 (2000) 5699; D. Abrams et al. (CDMS Collaboration). Submitted to Phys. Rev. D, astro-ph/0203500.
- [8] A. Benoit et al. Physics Letters B, 513 (2001) 15; A. Benoit et al., astro-ph/0206271.
- [9] M. Altmann et al. Contribution to the X International Symposium on Lepton and Photon Interactions at High Energies (23-28 July 2001, Rome), astro-ph/0106314.
- [10] N. J. T. Smith for the Boulby Dark Matter Collaboration. Talk at the 4th Intern. Workshop on the Identification of Dark Matter (IDM2002) (2-6 September 2002, York, UK), http://www.shef.ac.uk/phys/idm2002.html.
- [11] N. J. C. Spooner and V. A. Kudryavtsev. PRHEP-hep2001/201.
- [12] V. A. Kudryavtsev et al. Physics Letters B, 452 (1999) 167.
- [13] G. Gerbier et al. Astroparticle Physics 11 (1999) 287.
- [14] N. J. T. Smith, J. D. Lewin and P. F. Smith. Physics Letters B, 485 (2000) 9.
- [15] V. A. Kudryavtsev et al. Astroparticle Physics, 17 (2002) 401.
- [16] N. J. C. Spooner et al. Physics Letters B, 473 (2000) 330.
- [17] M. J. Lehner et al. Proceedings of the 3rd Intern. Conf. on Dark matter in astro- and particle physics (Heidelberg, 2000), p. 590.
- [18] H. R. Krall. IEEE Trans. Nucl. Sci., NS-14 (1967) 455.
- [19] D. R. Tovey. Ph. D. Thesis, University of Sheffield (1998).
- [20] J. D. Lewin and P. F. Smith. Astroparticle Physics 6 (1996) 87.
- [21] E. Sakai. IEEE Trans. Nucl. Sci., NS-34 (1987) 418.
- [22] J. B. Birks. The Theory and Practice of Scintillation Counting, Pergamon Press, 1964.
- [23] P. Dorenbos, J. T. M. de Haas and C. W. E. van Eijk. IEEE Transactions on Nuclear Science, 42 (1995) 2190.
- [24] R. Bernabei et al. (DAMA Collaboration). European Physical Journal C, 18 (2000) 283.
- [25] R. Bernabei et al. (DAMA Collaboration). Nuovo Cimento, A112 (1999) 545.
- [26] V. A. Kudryavtsev et al. Proc. of the 3rd Intern. Workshop on the Identification of the Dark Matter (York, 2000), ed. by N. J. C. Spooner and V. A. Kudryavtsev, p. 337.
- [27] V. A. Kudryavtsev et al. Proc. of the 27th Intern. Cosmic Ray Conf. (Hamburg, 2001), HE3.5.
- [28] M. T. Ressell and D. J. Dean. Phys. Rev. C, 56 (1997) 535.
- [29] D. R. Tovey et al. Physics Letters B, 488 (2000) 17.
| Crystal | Mass, kg | Light yield, pe/keV | Time, days | Exposure, kgdays |
|---|---|---|---|---|
| DM74 (oil) | 8.50 | 117.1 | 995.7 | |
| DM72 | 3.94 | 274.0 | 1079.4 | |
| DM76 | 8.32 | 101.2 | 842.3 | |
| DM77 | 8.41 | 62.2 | 522.9 | |
| DM74 (dry nitrogen) | 8.40 | 52.2 | 438.7 | |
| Total exposure | 3879 |