Abstract
A search for the light pseudoscalar sgoldstino production in three-body decay has been performed with the “ISTRA+” detector exposed to the 25 GeV negative secondary beam of the U-70 proton synchrotron. No signal is seen. Upper limits for the branching ratio at confidence level vary between and in the effective mass range from 0 up to 190 MeV. Our results improve the limits published by the E787 Collaboration in the mass interval between 0 and 120 MeV and are the first ones at higher masses.
1 Introduction
In supersymmetric models with spontaneous supersymmetry breaking superpartners of a Goldstone fermion — goldstino, pseudoscalar and scalar , should exist. In various versions of gravity mediated and gauge mediated theories one or both of these weakly interacting bosons — sgoldstinos — are light and therefore can be observed in kaon decays. Moreover, if sgoldstino interactions with quarks conserve parity,(as in left-right extensions of MSSM), and P is lighter than S, so that and , sgoldstinos show up in the decay , rather than in much better constrained . The phenomenology of light sgoldstinos in this scenario is considered in details in [1]. Under assumption that sgoldstino interactions with quarks and gluons violate quark flavor and conserve parity, low energy interactions of pseudoscalar sgoldstino with quarks are described by the Lagrangian:
| (1) |
with
| (2) |
with coupling constants proportional to the left-right soft terms in the matrix of squared masses of squarks:
| (3) |
Here the scale of supersymmetry breaking is denoted as .
The constraints on the flavor-violating coupling of sgoldstino
to quarks is evaluated using the
mass difference and violating parameter in the neutral kaon
system:
.
It has been shown in [1]
that, depending on the phase of sgoldstino-quark coupling, these
constraints result in the following limits on the branching ratio:
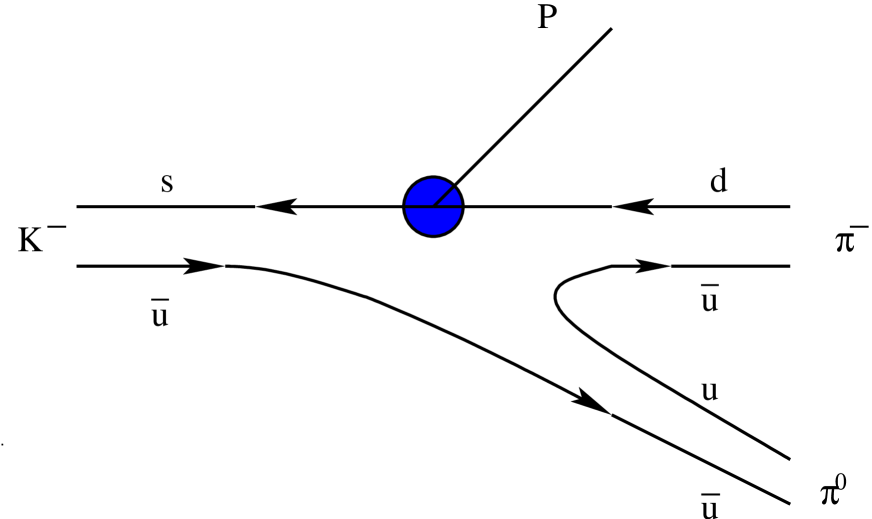
(see Fig. 1 for the diagram of the decay). A search for P in
charged kaon decays is of particular interest for the case
, when the corresponding branching ratio of is
small.
Light sgoldstino decays into two photons or into a pair of charged leptons,
two photon decay dominating almost everywhere in the parameter space.
Depending on the parameter , where
is the photino mass, sgoldstino decays either inside
or outside the detector. In the present search we assume that sgoldstino decays
outside the detector, i.e is invisible.
The existing limits on the branching
are at the
level of [2], whereas the limits for the
scalar sgoldstino can be estimated from the
studies of the at the level of
, see [3] for recent review.
The aim of our present study is to search for invisible pseudoscalar sgoldstino in the decay of . Experimental setup and event selection are described in Section 2, the results of the analysis are presented in Section 3 and the conclusions are given in the last Section.
2 Experimental setup and event selection
2.1 Experimental setup
The experiment is performed at the IHEP 70 GeV proton synchrotron U-70. The spectrometer ISTRA+ has been described in some details in our recent papers on [4], [5] and decays [6], here we briefly recall characteristics relevant to our analysis. The 40 m spectrometer ISTRA+ is located in the negative unseparated secondary beam line 4A of U-70. The beam momentum is GeV with . The admixture of in the beam is , the beam intensity is per 1.9 sec U-70 spill. A schematic view of the ISTRA+ setup is shown in Fig. 2. The momentum of a beam particle deflected by the magnet M1 is measured by four proportional chambers BPC1—BPC4 with 1 mm wire step, the kaon identification is done by three threshold Cerenkov counters Č1—Č3. The 9 meter long vacuumated decay volume is surrounded by eight lead glass rings used to veto low energy photons. The same role is played by 72-cell lead glass calorimeter SP2. The decay products deflected in the magnet M2 with 1 Tm field integral are measured with 2 mm step proportional chambers PC1—PC3, with 1 cm cell drift chambers DC1—DC3 and finally with 2 cm diameter drift tubes DT1—DT4. A wide aperture threshold Cerenkov counter Č4 is filled with He and used to trigger electrons. SP1 is a 576-cell lead glass calorimeter, followed by HC — a scintillator-iron sampling hadron calorimeter. MH is a 11x11 cell scintillating hodoscope, used to solve ambiguity for multitrack events and improve the time resolution of the tracking system, MuH is a 7x7 cell muon hodoscope.
The trigger is provided by scintillation counters S1—, beam Cerenkov counters and by the analog sum of amplitudes from last dinodes of the SP1 : T=, here S4 is a scintillation counter with a hole to suppress beam halo, S5 is a counter downstream of the setup at the beam focus, - a requirement for the analog sum to be larger than a MIP signal. ,

During first run in March-April 2001, 363 million of trigger events were logged on DLT’s. During second physics run in November-December 2001 350 million trigger events were collected with higher beam intensity and somewhat stronger trigger requirements. This information is supported by about 100 million MC events generated using Geant3 [7] for dominant decay modes. Signal efficiency for possible sgoldstino production has been estimated using one million generated events for the first run configuration and 0.5 million events for the second run configuration, for each effective mass point in the mass interval from 0 to 200 MeV with a step of 10 MeV. These signal events were weighted using the matrix element given in [1].
2.2 Event selection
Data collected in two runs, Spring 2001, first run, and Winter 2001, second run, are used. Some information on the data processing and reconstruction procedures is given in [4, 5, 6], here we briefly mention the details, relevant for + missing energy event selection.
The muon identification (see [5]) is based on the information from the SP1 — a 576-cell lead glass calorimeter and the HC — a scintillation-iron sampling calorimeter. The electron identification (see [4]) is done using ratio — of the energy of the shower associated with charged track and charged track momentum.
A set of cuts is designed in order to suppress various backgrounds to possible sgoldstino production:
0) Events with one reconstructed charged track and with two electromagnetic showers in the electromagnetic calorimeter SP1 are selected. We require the effective mass m to be within MeV from m. The effective two-photon mass distributions
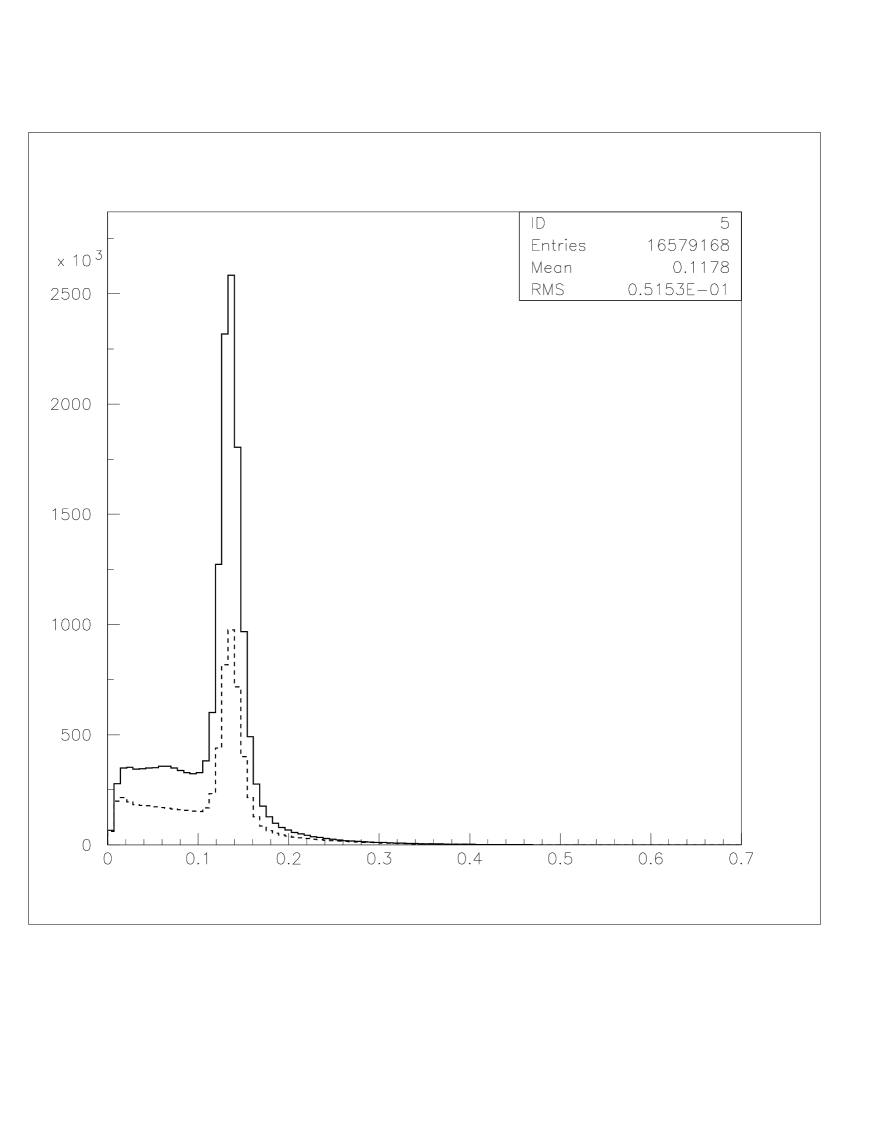
for two runs are shown in Fig. 3. Events with vertex inside interval cm are selected.
1) Next cut is a ”soft” charged pion identification, tracks having electron or muon flag ( as described in [4, 5] ) are rejected.
2) Events with missing energy below 3 GeV are rejected. The cut on the missing energy serves to reduce contribution. In Fig. 4 missing energy spectra for the second run data, MC background and MC signal with of 90 MeV are compared.

3) Events with within MeV from m135 MeV a selected (Tough cut).
4) Fourth cut suppresses events with extra photons irradiated by charged particles in a detector material upstream M2-magnet. Such photons have nearly the same coordinate on the SP1 face as the charged track, i.e event is rejected if at least one photon has cm.
5) Fifth cut removes events having good 2C-fit.
6) The following cut is a restriction on the charged pion momentum in the kaon rest frame: MeV. It is designed to suppress the tails of the decay.
7) Seventh cut is against remaining muon contamination.It is required that the energy in SP1, associated with charged track, should exceed 0.7 GeV. This cut requires ”early” hadron shower in SP1 and has , unfortunately, low signal efficiency. We plan to get rid of it in our final analysis.
8) The following cut is designed to suppress contribution: only the events with missing momentum crossing SP1 transverse plane within SP1 working aperture are selected.

9) The ”Veto” cut uses information from the Guard System GS and the guard electromagnetic calorimeter SP2: absence of signals above noise threshold is required. The influence of the ”Veto” cut on the two-photon effective mass spectrum is illustrated in Fig. 5. No signal is seen after the ”Veto” cut.
10) As a result of the previous cuts, -signal practically disappears from the mass spectrum. This allows to perform effective linear background subtraction procedure. The interval MeV around m mass value is used as the signal region, remaining events are used for the background estimate.
The data reduction information is given in Table 1 for two runs and is compared in Tables 2,3 with MC-background statistics and with MC-signal statistics for the sgoldstino mass of MeV.
The influence of the last eight cuts on the missing mass squared spectrum , which is used as the signal ”estimator” is is shown in Fig. 6 for the second run data. The left wide bump in Fig. 6 is due to decays, the shift to negative missing mass squared is caused by the use of the pion mass in its calculations. Second peak is caused by decay with gammas from second escaping detection.
Fig. 7 illustrates the background subtraction procedure: in the first(third) figure the missing mass squared spectrum after cut 10 is shown for the first(second) run (solid curve) together with the normalized background(dashed curve) estimated from the spectrum side bands ( 99–117 MeV and 153–171 MeV). The second(forth) figure show signal-background difference for two runs. No sgoldstino signal is observed, the peak around 0.02 GeV2 is due to remaining background.
| Cut | Events run 1 | Events run 2 | ||
|---|---|---|---|---|
| (0) 1 and m near m() | 4398982 | 11339975 | ||
| (1) no (e, ) | 978752 | 1.48 | 8762220 | 1.29 |
| (2) E GeV | 716830 | 4.16 | 1430781 | 6.12 |
| (3) narrow m() band | 581653 | 1.23 | 1297087 | 1.10 |
| (4) conv. gammas | 322073 | 1.81 | 723248 | 1.79 |
| (5) no fit | 230424 | 1.40 | 487246 | 1.48 |
| (6) MeV | 150926 | 1.53 | 322298 | 1.51 |
| (7) MeV | 17101 | 8.83 | 51624 | 6.24 |
| (8) cm | 12922 | 1.32 | 40356 | 1.28 |
| (9) Veto | 5255 | 2.46 | 11183 | 3.61 |
| (10) meV | 2691 | 1.95 | 6125 | 1.94 |
| Cut | Events mix MC | MC signal with m=90 MeV | ||
|---|---|---|---|---|
| (0) 1 and m near m() | 1278382 | 207315 | ||
| (1) no (e, ) | 1156685 | 1.11 | 203841 | 1.02 |
| (2) E GeV | 158181 | 7.31 | 168179 | 1.21 |
| (3) narrow m() band | 149679 | 1.06 | 165105 | 1.02 |
| (4) conv. gammas | 91251 | 1.64 | 94503 | 1.75 |
| (5) no fit | 48067 | 1.90 | 68325 | 1.38 |
| (6) MeV | 32151 | 1.50 | 67528 | 1.01 |
| (7) MeV | 6880 | 4.67 | 22346 | 3.02 |
| (8) cm | 5283 | 1.30 | 17883 | 1.25 |
| (9) Veto | 2257 | 2.34 | 17770 | 1.01 |
| (10) MeV | 1521 | 1.48 | 15737 | 1.13 |
| Cut | Events mix MC | MC signal with m=90 MeV | ||
|---|---|---|---|---|
| (0) 1 and m near m() | 5117109 | 120594 | ||
| (1) no (e, ) | 4627156 | 1.11 | 119292 | 1.01 |
| (2) E GeV | 618446 | 7.48 | 98098 | 1.22 |
| (3) narrow m() band | 565772 | 1.09 | 96504 | 1.02 |
| (4) conv. gammas | 346226 | 1.63 | 54206 | 1.78 |
| (5) no fit | 118536 | 2.92 | 37124 | 1.46 |
| (6) MeV | 114160 | 1.04 | 36835 | 1.01 |
| (7) MeV | 21824 | 5.23 | 11800 | 3.12 |
| (8) cm | 16597 | 1.28 | 9462 | 1.25 |
| (9) Veto | 7229 | 2.30 | 9407 | 1.01 |
| (10) MeV | 5114 | 1.41 | 8541 | 1.10 |

 |
 |
3 Analysis and results
 |
 |
In order to calculate the upper limits we have fitted the residual missing mass distribution by the sum of the background and the signal Gaussian with fixed width of GeV2, as determined from the signal MC.
The signal MC is also used to determine the efficiency of our cuts. The background has been described by two components: the Gaussian for peak and a linear background. For the second run an additional wide Gaussian centered at -0.015 has been used. Fit results are illustrated in Fig. 7 for the first and second run, respectively.
The upper limits at the 90 confidence level are calculated from the value
| (4) |
where is the number of events in the signal Gaussian. During the fit we impose the constraint that is nonnegative. Sigma is a non-Gaussian error in . The upper limit is calculated as
| (5) |
with equal to ; with 0.98798 equal to and equal to the number of reconstructed decays found to be 1500000 events for the first run and 4500000 events for the second run.
The values and are respective acceptances for and decays. The acceptance is equal to for the first run and for the second run. This acceptance includes both the reconstruction efficiency and geometrical acceptance. The results of the fits are given in Table 4. As the background conditions for the two runs are different, the first run provides better upper limits for some regions regardless of the lower luminosity. The estimated systematic errors for the upper limits are at the level of 20 .

| M, MeV | Eff. , | UL | Eff. , | UL | ||
|---|---|---|---|---|---|---|
| 0 | 0.64 | 0 | 1.84 | 0.85 | 0 | 2.39 |
| 10 | 0.66 | 0 | 1.76 | 0.86 | 0 | 2.40 |
| 20 | 0.67 | 0 | 1.69 | 0.92 | 0 | 2.10 |
| 30 | 0.74 | 0 | 1.48 | 0.99 | 0 | 1.73 |
| 40 | 0.81 | 0 | 1.30 | 1.05 | 0 | 1.65 |
| 50 | 0.88 | 0 | 1.16 | 1.18 | 0 | 1.56 |
| 60 | 1.05 | 0 | 0.98 | 1.32 | 0 | 1.10 |
| 70 | 1.09 | 0 | 1.01 | 1.73 | 0 | 0.70 |
| 80 | 1.21 | 0 | 1.15 | 1.62 | 0 | 0.66 |
| 90 | 1.33 | 0 | 2.02 | 1.76 | 0 | 0.57 |
| 100 | 1.41 | 0 | 4.24 | 1.90 | 0 | 0.54 |
| 110 | 1.53 | 10.96 | 3.96 | 2.09 | 0 | 0.62 |
| 120 | 1.60 | 17.22 | 2.24 | 2.27 | 0 | 1.04 |
| 130 | 1.63 | 0 | 3.86 | 2.36 | 0 | 2.26 |
| 140 | 1.66 | 0 | 3.79 | 2.46 | 0 | 2.12 |
| 150 | 1.61 | 8.27 | 4.25 | 2.49 | 0 | 1.89 |
| 160 | 1.74 | 014.91 | 2.33 | 2.41 | 020.96 | 1.65 |
| 170 | 1.48 | 020.95 | 3.46 | 2.35 | 019.98 | 1.61 |
| 180 | 1.42 | 021.00 | 3.60 | 2.18 | 15.0 | 1.61 |
| 190 | 1.27 | 016.19 | 3.11 | 2.01 | 029.29 | 2.77 |
| 200 | 0.85 | 015.89 | 4.54 | 1.26 | 6.4915.96 | 3.00 |
| M, MeV | UL | |
|---|---|---|
| 0 | 0 | 1.85 |
| 10 | 0 | 1.78 |
| 20 | 0 | 1.61 |
| 30 | 0 | 1.37 |
| 40 | 0 | 1.14 |
| 50 | 0 | 0.88 |
| 60 | 0 | 0.68 |
| 70 | 0 | 0.58 |
| 80 | 0 | 0.49 |
| 90 | 0 | 0.50 |
| 100 | 0 | 0.58 |
| 110 | 0 | 0.85 |
| 120 | 0 | 1.61 |
| 130 | 0 | 1.20 |
| 140 | 0 | 0.91 |
| 150 | 0 | 0.87 |
| 160 | 0 | 0.99 |
| 170 | 0 | 1.03 |
| 180 | 0 | 1.31 |
| 190 | 0 | 1.57 |
| 200 | 13.66 | 3.08 |
The final result obtained using combined statistics of two runs is given in Table 5. The weighted ratio with the weights proportional to the runs statistics has been used for the combined data sample. Fig. 9 shows a comparison of our result with that published by the E787 collaboration [2].
Special attention should be paid to the region near m mass. If we assume that the sgoldstino mass is exactly equal to that of and that the remaining peak is due to sgoldstino signal, then the upper limit for this point is .
4 Summary and conclusions
A search for a possible pseudoscalar sgoldstino production in the decay has been performed. It was assumed that sgoldstino decays outside the setup, i.e is invisible. No signal is seen in the mass interval between 0 and 200 MeV. The 90 confidence upper limits obtained vary between and for the sgoldstino mass range of MeV. These results improve the confidence limits published by the E787 Collaboration.
In future, we plan to extend our search for a sgoldstino signal in the scenario when the decay happens inside the setup.
The authors would like to thank D.S. Gorbunov, V.A. Matveev, V.A. Rubakov, for numerous discussions.
The INR part of the collaboration is supported by the RFFI fund contract N00-02-16074.
References
- [1] D.S. Gorbunov and V.A. Rubakov, Phys. Rev. D64 (2001) 054008.
- [2] S. Adler et al., E787 Collaboration, Phys. Rev. D63 (2001) 032004.
- [3] L. Littenberg, Rare kaon and pion decays, Lectures given at the PSI Summer School on Particle Physics, Zuoz, 2002, preprint hep-ex/0212005.
- [4] I.V. Ajinenko et al., Study of the decay, IHEP preprint 2001-051(2001); hep-ex/0112023,2001.
- [5] I.V. Ajinenko et al., Study of the decay, IHEP preprint 2002-6(2002).
- [6] I.V. Ajinenko et al., Measurement of the Dalitz plot slope parameters for decay using ISTRA+ detector, IHEP preprint 2002-16, Protvino, 2002.
- [7] R. Brun et al, CERN-DD/EE/84-1, CERN, Geneva, 1984.