QCD at high energy (experiments) ††thanks: Talk presented at the International Conference on High Energy Physics, Amsterdam, 24-31 July 2002.
Abstract
Recent measurements of QCD interactions involving large momentum transfers are reviewed. The status of measurements of the strong coupling constant is summarised. Recent developments in the measurement and interpretation of deep inelastic scattering, proton-anti-proton collisions and two-photon processes are discussed. While QCD at next-to-leading order gives a qualitative description of many processes, next-to-NLO calculations are now required to allow quantitative information to be extracted from hadron-initiated multijet data. This is illustrated by a discussion of recent data on the photoproduction of dijet events at HERA.
1 Introduction
Experimentation over the last three decades has established quantum chromodynamics (QCD) as the theory that describes the interactions of quarks and gluons. The phenomenology of QCD is rich, a consequence of the gluon self-interactions. These interactions cause the strong coupling, , to fall with increasing momentum scale, . When is large, is small and perturbative QCD (pQCD) can be used to give an excellent description of hadronic phenomena. Conversely, as falls and grows, higher-order diagrams become increasingly important. When is comparable to the masses of initial or final state hadrons, the effects of confinement begin to become important. In this kinematic regime, non-perturbative models must be employed to obtain insight into the dynamics of the process under consideration.
A complete and quantitative understanding of QCD over the full kinematic range is required before it can be claimed that the Standard Model (SM) is understood. For some processes, for example jet production in annihilation, inclusive deep inelastic lepton-nucleon scattering and inclusive jet production in and scattering, the QCD description is precise enough at next-to-leading order (NLO) for quantitative information, such as the value of , to be extracted from the data. The description of other processes is, at best, qualitative. Examples include multijet and heavy quark production in and scattering. My purpose in this brief contribution is to review the data on hard processes, i.e. those for which is ‘small’, and by comparing the data to the pQCD predictions establish where quantitative information can be extracted and where progress is required for the development of a full, quantitative understanding of QCD.
2 Measurement of colour factors and
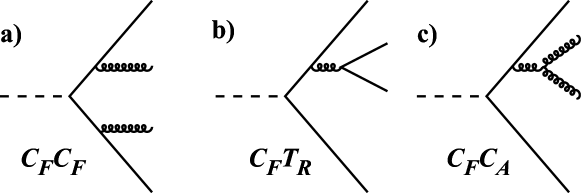
Electron-positron annihilation to hadrons at high energy is well suited to the measurement of the parameters of QCD since the initial state contains no hadrons. Four-jet production in annihilation is of particular interest since at leading order (LO) the cross section is proportional to . An illustrative subset of Feynman diagrams contributing at LO is shown in figure 1. Note that the gluon self interaction (figure 1c) contributes at LO. The ‘multiplicity’ of the various colour configurations allowed by the theory is coded in the colour factors , , and as indicated. The angular momentum of the initial states that may contribute are determined by the vector nature of the electroweak interaction. Hence, angular correlations amongst the final state jets may be used to disentangle the various diagrams.
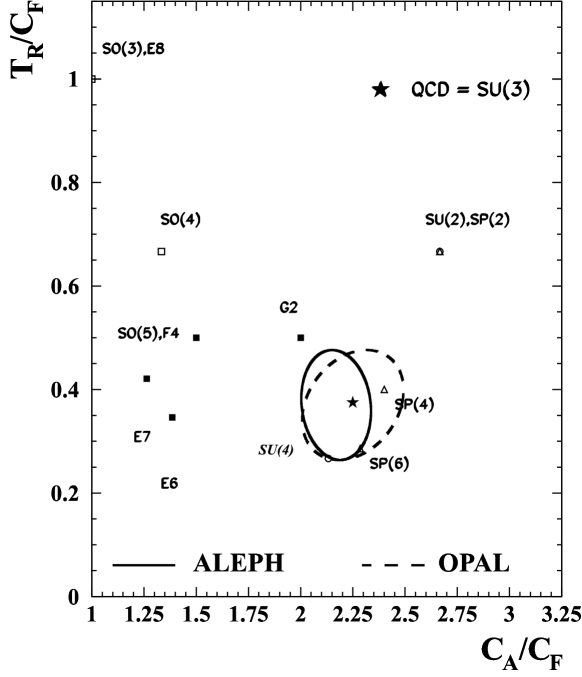
The LEP experiments ALEPH and OPAL have each made a simultaneous fit to the four-jet rate and the distributions of the angular correlations to determine simultaneously the colour factors and , where is the mass of the boson [1, 2]. The results are summarised in figure 2.
The DELPHI collaboration has also presented such an analysis based on a smaller data sample [3]. Four-jet production in annihilation is able to determine the colour factors with a precision of . Additional constraints may be obtained from the ratio of the multiplicity of gluon-induced jets to that of quark-induced jets. This has been done by DELPHI, the result is shown in figure 3 [4].
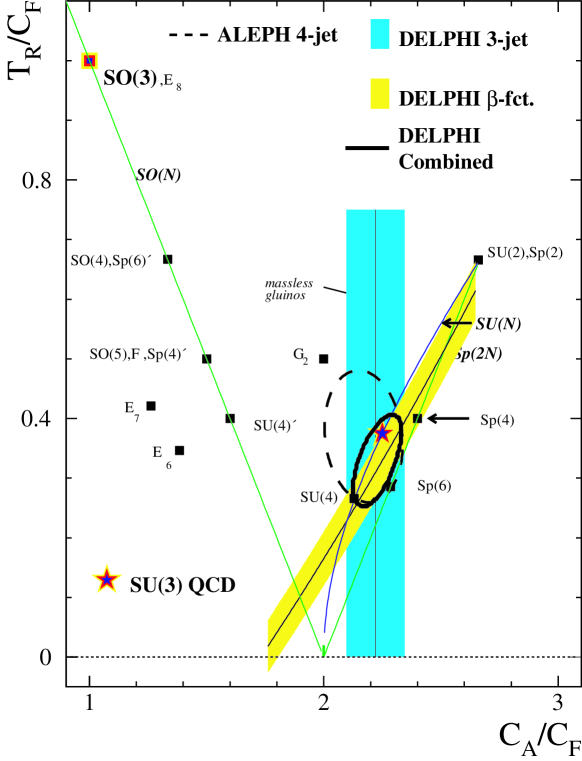
Further constraints may be obtained from the analysis of the evolution of the means of event shape variables with energy. This has been done using a renormalisation group invariant analysis by DELPHI [5]. The results are plotted in figure 3. JADE data has been used in a power correction fit to event shape variables yielding and [6]. Overall, the data is consistent with the QCD prediction and verify that is the gauge group underlying QCD.
Exploiting the exquisite sensitivity of the four-jet rate to , ALEPH has set the colour factors to the values predicted by QCD and used the four-jet rate to make a precise determination of [1]. The four-jet rate as a function of a jet separation parameter is used together with an calculation that includes a resummation of the large logarithms at next-to-leading order accuracy. The value of obtained is:
where the first error is the statistical uncertainty and the second error contains both the experimental systematic and the theoretical uncertainties. This is a determination of with a precision , a remarkable achievement.
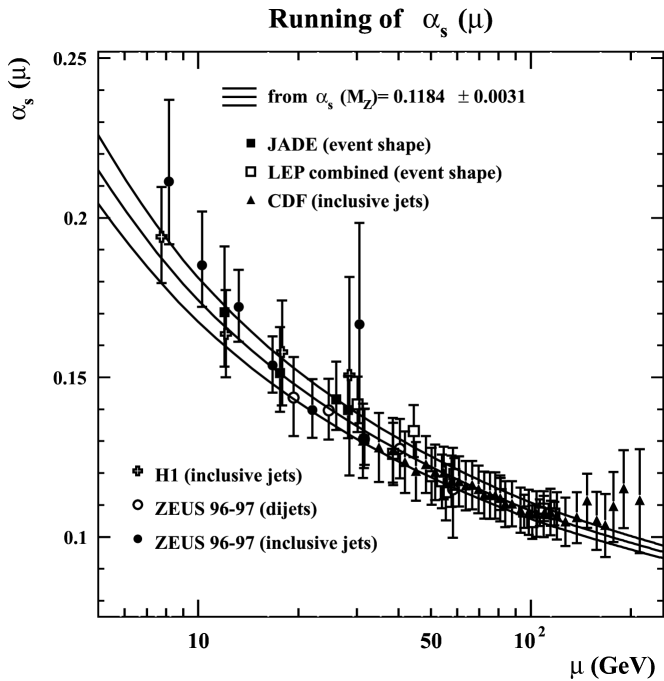
The distribution of event-shape variables, such as thrust, have long been used in the study of to determine . QCD calculations at matched to resummations of the leading logarithms at NLL accuracy have been used to fit event shape distributions by each of the LEP collaborations at each centre-of-mass (cms) energy [7]. For ICHEP2002, the LEP collaborations have updated these results to ensure a uniform treatment of the data. The measurements of the individual experiments at each cms energy have been combined by the LEP QCD working group, the results are shown in figure 4. The data clearly exhibit the expected running of the strong coupling. The value of obtained by combining all the data at each cms energy is . This result represents the last major update on the value of from event shapes at LEP. A similar analysis has been performed using JADE data for cms energies in the range 14 GeV to 44 GeV [8]. These results are also plotted in figure 4. The value of obtained by combining all the JADE data is .
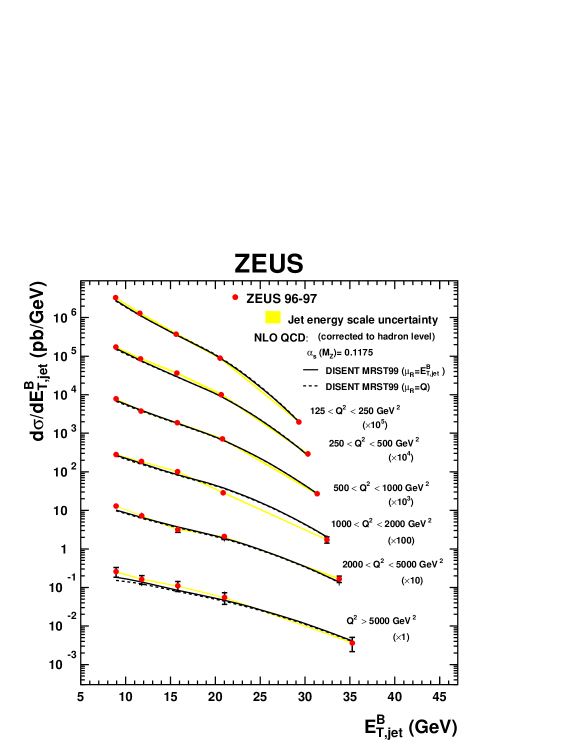
The ZEUS collaboration has measured the inclusive jet cross section and used it to verify the running of and to determine [9]. Jets were reconstructed in the Breit frame. The Breit frame is defined such that the current (virtual photon or boson) is collinear with the initial state quark, the momentum of the quark being reversed by the collision (see figure 5).
The advantage of this choice is that the transverse energy of the jets in the current region of the Breit frame, , arises from gluon radiation. The measured differential cross section is shown in figure 6 in bins of the virtuality of the exchanged boson, . The excellent description of the data afforded by NLO QCD allows a fit for to be made. The result, using as the scale, is shown in figure 4. The data exhibit the expected running and are well described by the NLO QCD calculation. Combining the results for yields . This result is in good agreement with the world average and other determinations of presented at this conference (see figure 7).
CDF has measured the cross section for inclusive jet production in collisions, , with measured in the laboratory frame [10]. For GeV NLO QCD may be used with standard parton density functions (PDFs) to give a good description of the data. With the PDFs available when the data was published the data for GeV was in excess of the NLO QCD expectation [11]. The data for GeV have been fitted to extract using . The results are shown in figure 4. A value of is obtained by combining all these results. The level of agreement between the inclusive jet data and NLO QCD is discussed in more detail in section 3.5.
The measurements of reported at this conference are shown in figure 7.
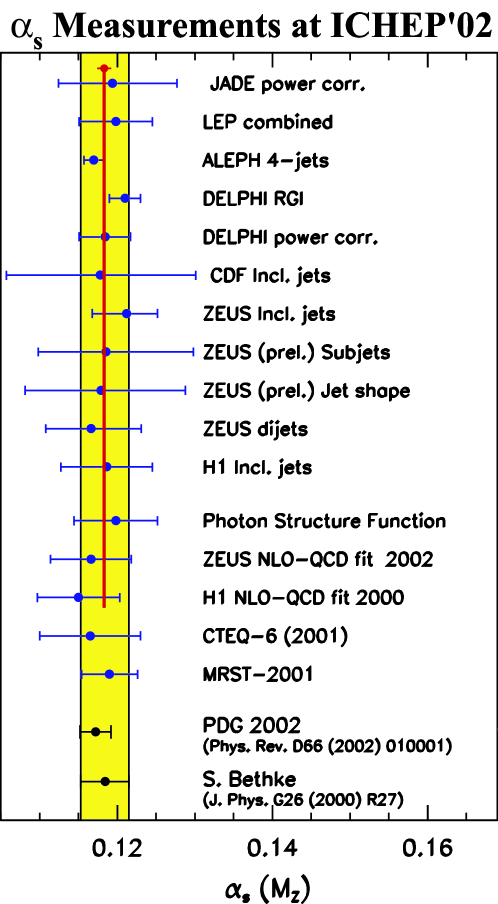
The new measurements, which have been obtained using a wide variety of independent processes and techniques, are consistent both with one-another and with the world average [12]. The most precise of the new measurements is that obtained from the 4-jet rate in annihilation by the ALEPH collaboration. Taking the weighted mean of all the new measurements, on the assumption that the errors are uncorrelated, yields the result . The precision of this result is striking and motivates a more careful analysis to update the world average.
3 Proton and photon structure
3.1 Deep inelastic scattering
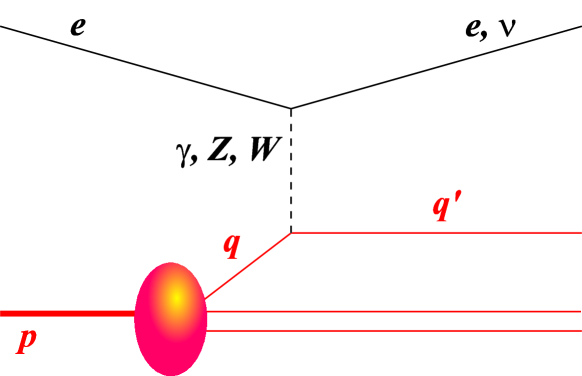
The generic Feynman diagram for lepton-proton deep inelastic scattering (DIS) is shown in figure 8. At HERA the incoming lepton is either an electron or a positron. is the virtuality of the exchanged boson squared and the fraction of the four-momentum of the proton carried by the struck quark is . The double differential cross section for the neutral current (NC) process may be written
| (1) | |||||
where denotes the fine structure constant, and . , the longitudinal structure function, is zero at LO in QCD, whereas the structure functions and can be expressed as products of electroweak couplings and PDFs as follows:
where are the quark and the anti-quark PDFs, the functions and contain the electroweak couplings and runs over the five quark flavours . may be corrected for the -exchange contribution to yield - the purely electromagnetic contribution to .
The double differential cross section for the charged current (CC) process may be written
| (2) | |||||
where is the Fermi constant and the mass of the boson. At LO, and and can be written in terms of the quark PDFs, for example:
The expressions for CC DIS may be obtained by replacing quark densities with anti-quark densities and vice versa. The following paragraphs review recent progress in the measurement and interpretation of neutral and charged current deep inelastic scattering.
3.2 Determination of PDFs and
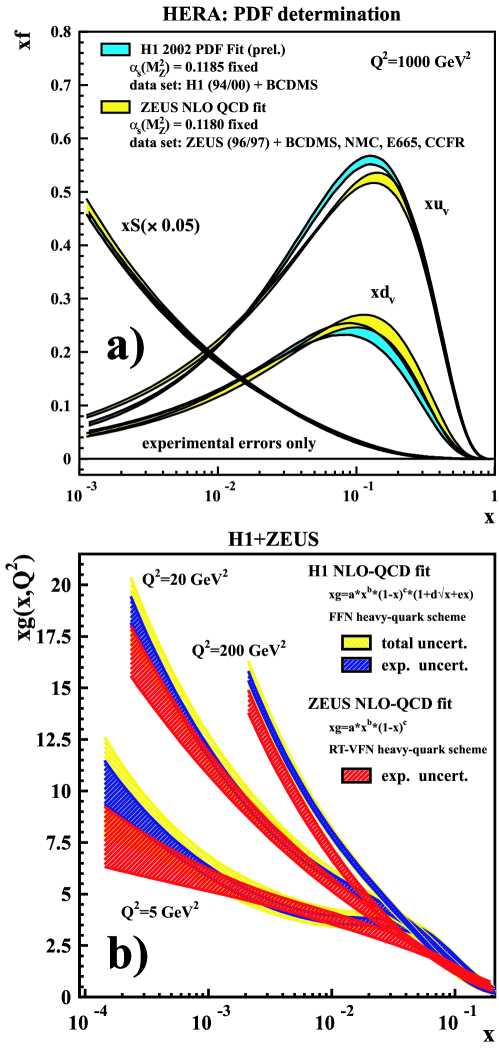
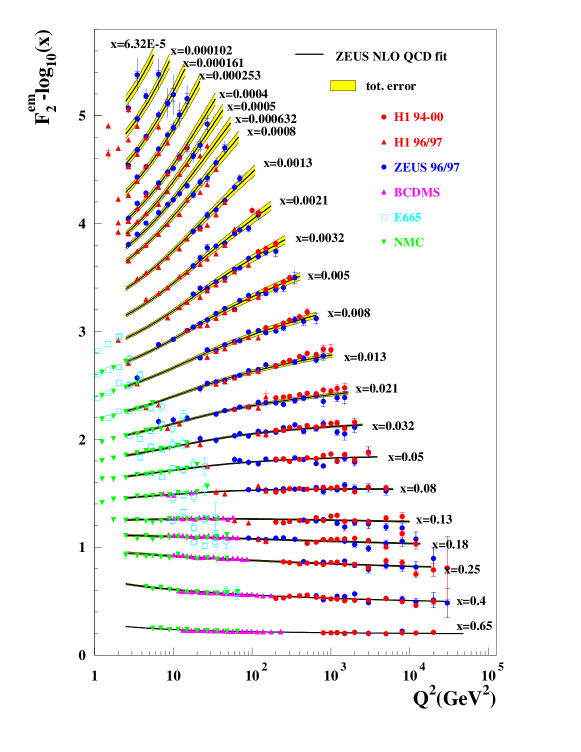
Figure 9 shows as a function of for several values of [13, 14, 15, 16]. For the data show little dependence on the scale . At lower values the data show a clear rise with . For sufficiently large, the DGLAP formalism may be used to calculate the evolution of with by solving the evolution equation [17]:
| (3) |
where is the gluon PDF, and are the quark and gluon splitting functions and the symbol represents a convolution integral. Equation 3 may be used to fit the data for both the PDFs and . NLO DGLAP fits are now routinely performed by experimental and theoretical groups [18, 19, 20, 21]. Over the past year or so particular emphasis has been placed on a full treatment of the correlated experimental systematic uncertainties. Both the ZEUS and the H1 collaborations have performed such fits. As an example, figure 9 shows the ZEUS NLO QCD fit together with the full error band which includes the contributions of the statistical, the correlated and the uncorrelated systematic uncertainties. The fit describes the data well. The error band has the tendency to grow as falls (for example at GeV2 the fractional error at is while at it is ).
Figure 10a shows the quark PDFs that result from the ZEUS and H1 fits evaluated at GeV2 as a function of . The sea quark PDF, (), extracted in the two analyses agree well within errors. The valence quark PDFs show reasonable agreement, but differ by between 5% and 10%. The ZEUS and H1 analyses differ in the choice of data used as input to the fit, the parameterisation chosen for the PDFs at the starting scale and the treatment of charm and beauty quarks close to threshold. When the differences between the analyses are taken into account the level of agreement between the PDFs seems reasonable. It is interesting to note that, within a particular analysis, the -valence PDF is known with a precision of , the -valence PDF is known to while the sea-quark PDF is known to . The gluon PDF contributes to DIS only at NLO. Therefore, the fits exhibit a strong correlation between and the parameters of . Figure 10b shows the gluon PDF obtained by the ZEUS and H1 collaborations at several values of as a function of . The agreement between the analyses is reasonable, taking into account the different choices made in setting up the fits. The gluon density exhibits a strong rise towards low . The values of extracted by the collaborations from these fits are: (H1) [20];. (ZEUS) [21]. The errors quoted include statistical, uncorrelated and correlated contributions to the systematic uncertainty as well as theoretical and model errors. Space does not permit a full description of the error analysis. The CTEQ and MRST groups have also performed such analyses and have obtained the following values: (CTEQ) [18]; (MRST) [19]. The error quoted by the MRST group takes account of experimental and theoretical uncertainties. The experimental contribution is determined by allowing a change in the fit of 20, while the theoretical error is estimated by varying the theoretical treatment to include an approximate treatment of next-to-NLO terms, resummation of or terms. The CTEQ group quotes only the experimental uncertainty on , arguing that the strong correlation between and the functional form of makes this method of determining uncompetitive. The experimental uncertainty is determined by allowing a change of 100. This, comparatively large, value is determined by a careful study of the variation of fit parameters allowed by the data. Overall, the values of obtained from NLO QCD fits are in good agreement. The precision of the data and of the theoretical analysis has now reached a stage where details of model and theoretical assumptions can be verified.
3.3 Search for low , low limit of validity of DGLAP evolution
The analysis of the data presented above depends on the assumption that ‘is large enough’ for the DGLAP formalism to be applied. A large is required so that the partons may be treated as independent non-interacting particles and so that is sufficiently small to allow QCD at NLO to be applied. The values to which the fit is sensitive should be sufficiently large that terms proportional to powers of are not important. It is therefore of interest to investigate the extent to which the DGLAP formalism describes the data at low and low .

One approach to this is to parameterise at a particular as a power of as follows:
where and are positive parameters. Neighbouring data points at a particular may be combined to estimate the slope parameter . This has been done by the H1 collaboration and the results are shown in figure 11 [22]. For the contribution of the valence quarks to is large and the ansatz does not hold. However, for the data is well described by a single value of , independent of over the range of to which the experiment is sensitive. Hence, at each value of , may be characterised by a particular value of . The dependence of on is shown in figure 12 [22, 23]. For GeV2, where the DGLAP formalism gives a good description of the data, the dependence of on is, to a good approximation, linear. However, for GeV2 the data lie above the extrapolation of this linear dependence.
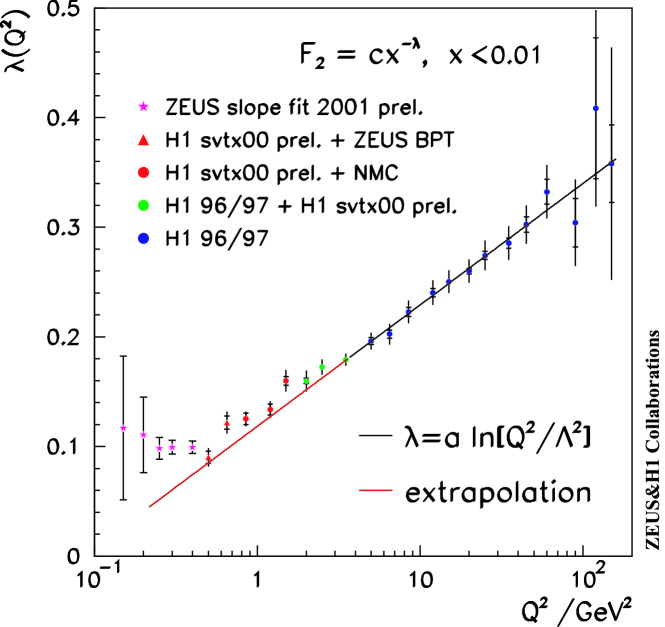
It is intriguing to note that while no significant dependence of on for has been observed, there is a change in the dependence of on at GeV2. The explanation for this change of behaviour is the subject of intense theoretical speculation.
3.4 Deep inelastic scattering at high
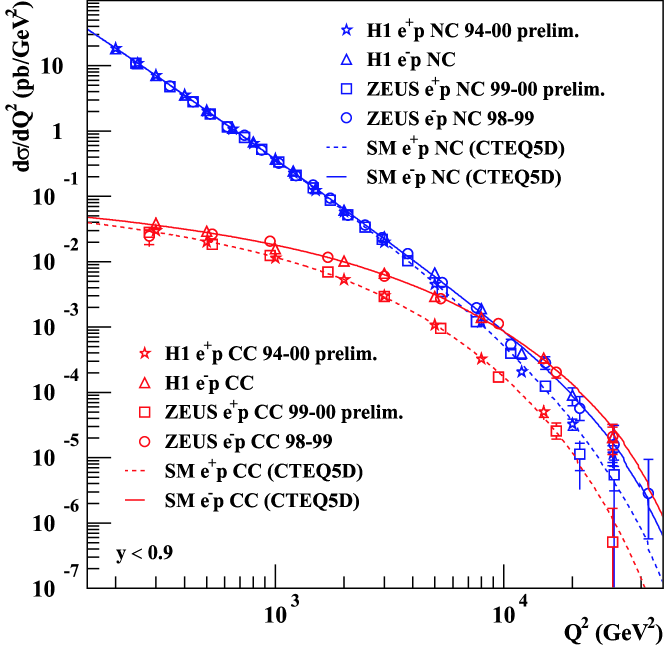
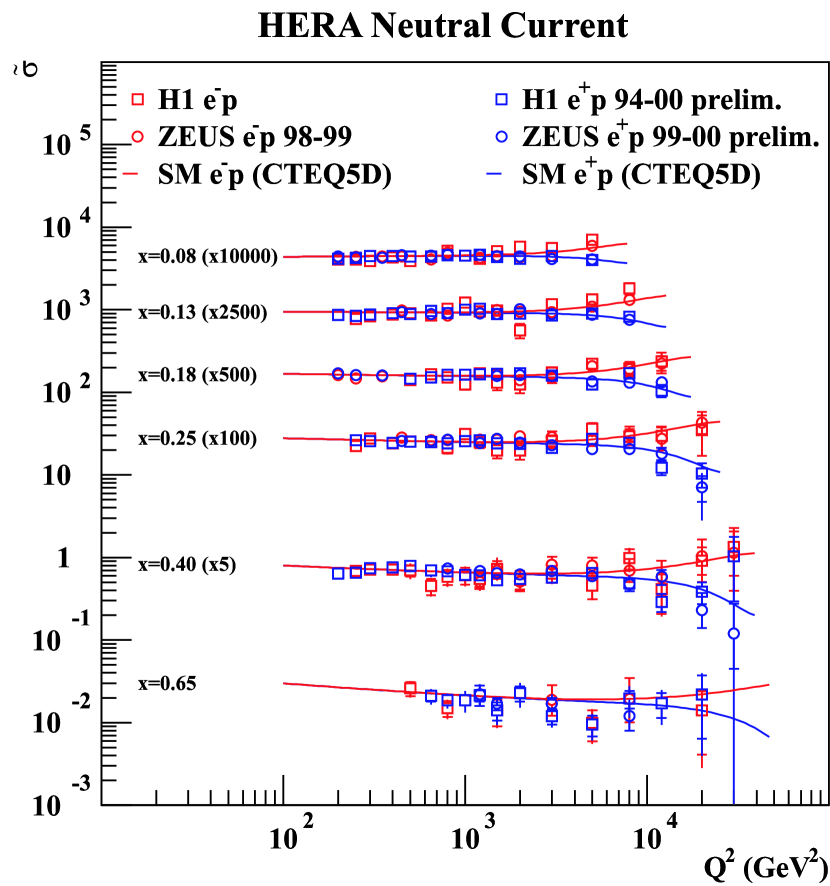
Figure 13 shows the differential cross section for NC and CC scattering at high [13, 14, 24, 25, 26, 27, 28, 29]. The NC cross section falls by 3–4 orders of magnitude between GeV2 and GeV2, exhibiting the dependence of the dominant single-photon exchange contribution. For GeV2 the NC DIS cross section lies above that for NC DIS reflecting the fact that the interference contribution is constructive in the case of scattering and destructive for . The CC DIS cross section is always larger than that for CC DIS because the -quark density, which gives the dominant contribution, is larger than that of the -quark and, in the case of CC DIS, the -quark contribution is suppressed by (see equation 4). The SM, evaluated using standard PDFs evolved in the DGLAP formalism, gives a good description of the data. This motivates the use of NC and CC data at high to study proton structure at high and high .
In order to exhibit the dependence of the DIS cross sections upon the structure functions it is convenient to divide out the dependence on the electroweak couplings and the boson propagator. The scaled cross sections, referred to as reduced cross sections, for NC and CC DIS are defined as follows:
Figure 14 shows as a function of for several values of . The photon propagator dependence having been removed, depends only weakly on . As described above, the effect of -boson exchange is to cause to lie above for GeV2.
The difference between and can be used to determine (see equation 1). This has been done by the H1 and ZEUS collaborations and the final results for pre-upgrade HERA running are shown in figure 15 [24, 27]. Since , gives a measure of the valence quark PDF. The data are well described by the SM expression evaluated with standard PDFs. The large data sets that will be provided in the near future at HERA will allow a precise determination of to be made yielding an important constraint on the valence quark PDFs.
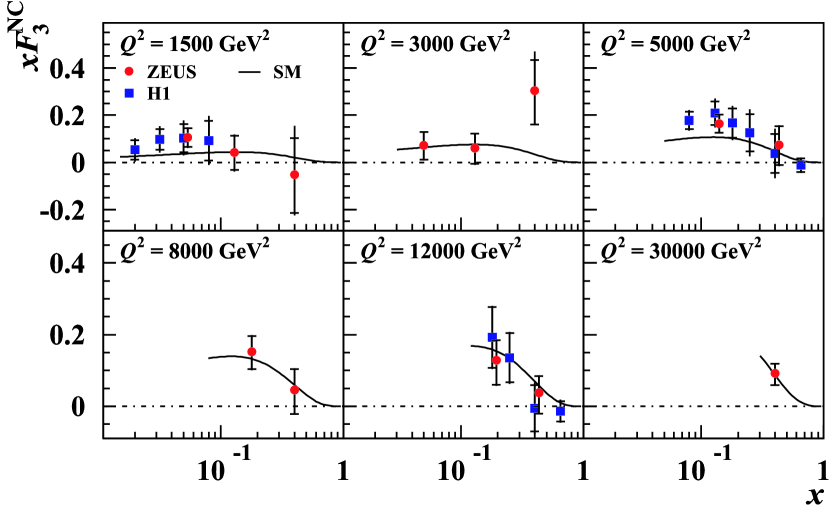
At LO in , can be written
| (4) |
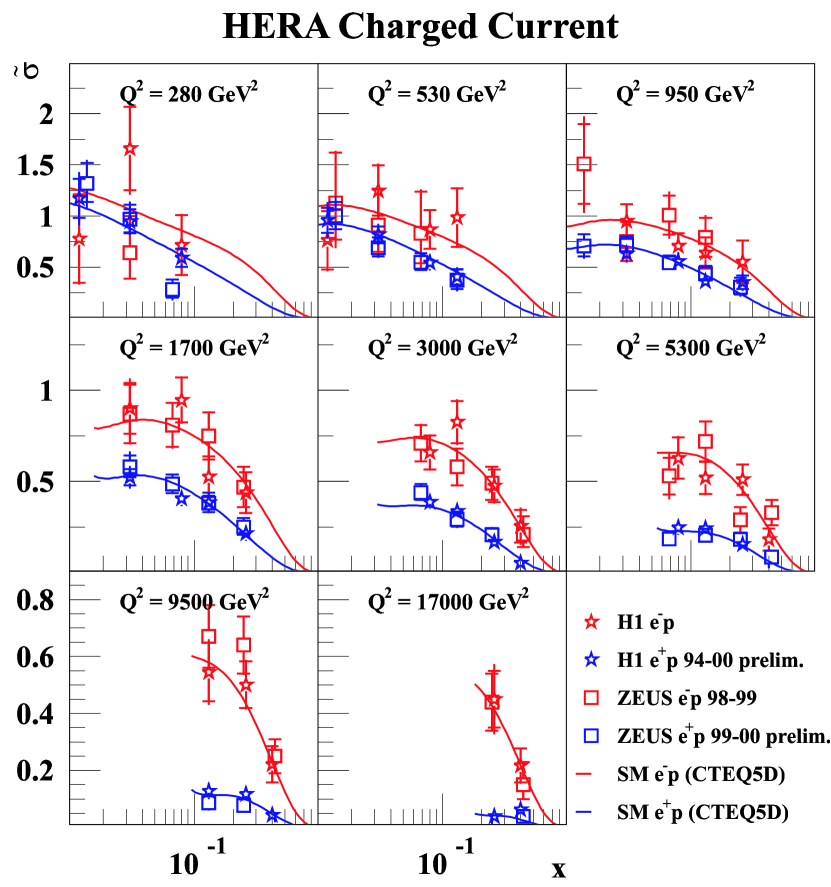
The expression for CC DIS may be obtained by replacing -type quark densities with -type quark densities and vice versa. A measurement of the CC cross section at high can therefore be used to constrain the valence - () and valence -quark () PDFs. Figure 16 shows as a function of at several values of . The data are well described by the SM. Also shown, are the contributions of the -type quarks in CC DIS and the -type quarks in . The statistical precision of the data is not yet sufficient to allow a precise determination of the - and -quark PDFs. The large data sets expected to be obtained at HERA II will allow precise measurements of the CC DIS cross sections to be made. This will yield important constraints on the - and -quark PDFs.
3.5 Impact of D0 inclusive jet data
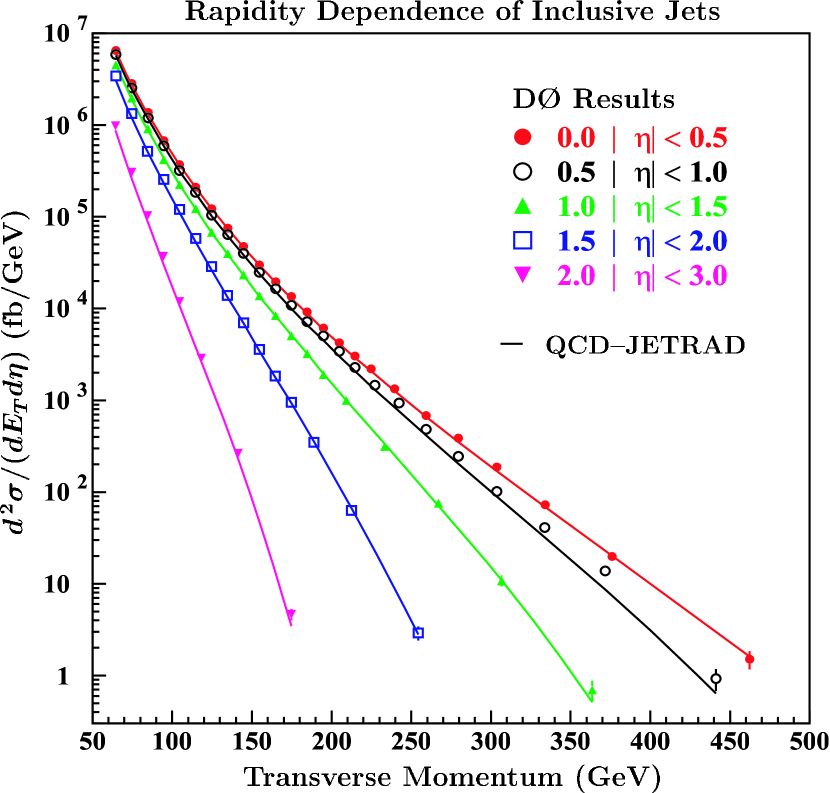
Last year the D0 collaboration published their measurement of the inclusive jet double differential cross section as a function of jet transverse energy, , in bins of jet pseudorapidity, , where is the polar angle of the jet in the D0 laboratory frame [30]. The data, shown in figure 17, are well described by QCD at NLO over the full range of and .
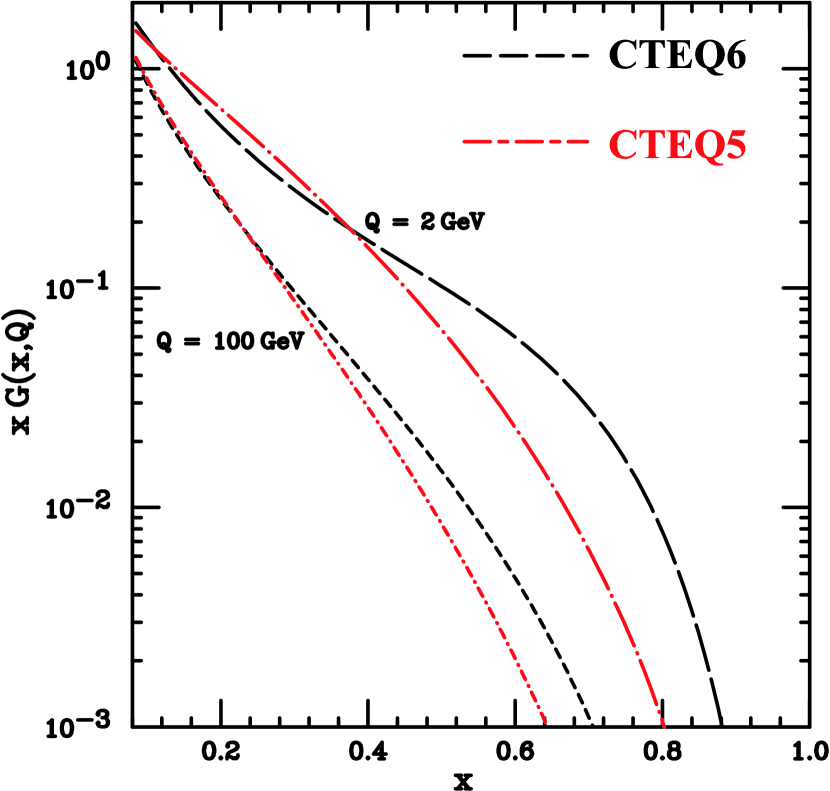
The CTEQ and MRST groups have used the data in fits to determine the proton PDFs [18, 19]. The importance of this data in constraining the gluon PDF can be judged from figure 18 where is plotted as a function of for two values of the scale . The new result (labelled CTEQ6) is compared to the result of a fit that did not include this data (CTEQ5) [31]. The gluon density obtained in the new fits is much harder than that obtained previously. It is important to note that the new PDFs, containing the enhanced gluon density at high , give a good description of both the CDF and the D0 jet data, including the data at high transverse energy ( GeV) in the central region () which were in excess of QCD at NLO evaluated with older PDFs.
3.6 Remark on the precision of PDFs
NLO QCD fits to data are able to determine the quark PDFs with a precision of 5–10% and the gluon PDF with a precision of 10–15%. Progress is being made towards calculations of many of the cross sections used in the fits at next-to-NLO (NNLO). PDFs extracted from a fit using a partial NNLO calculation have recently become available [32]. A consistent analysis at NNLO combined with the large data sets soon to become available from HERA and the Tevatron will allow a significant reduction in the PDF uncertainties to be obtained before the LHC era begins.
3.7 Photon structure
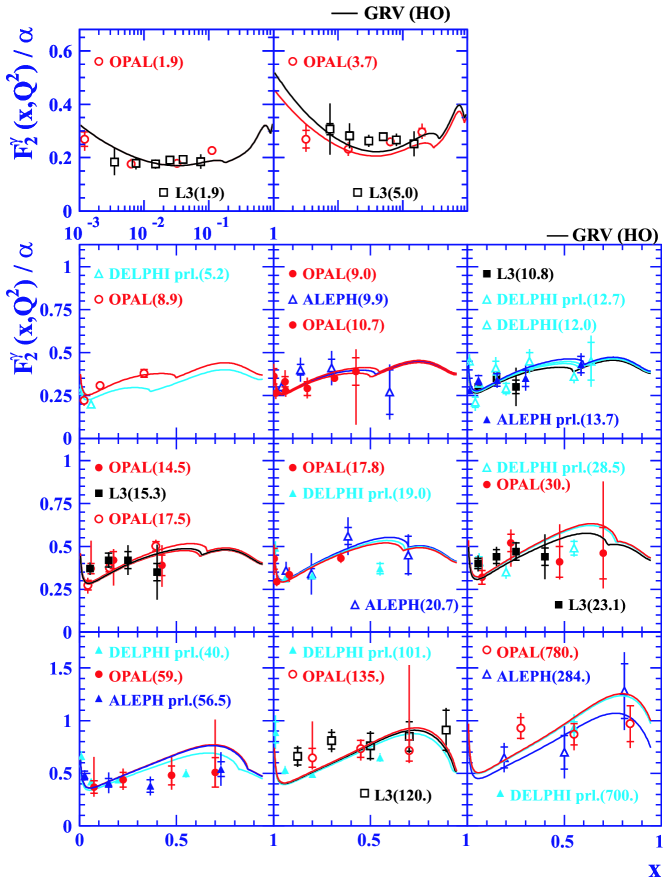
The LEP collaborations have updated their measurements of the photon structure functions and contributed new measurements at the highest LEP energies [33]. Figure 19 shows a compilation of all measurements of the photon structure function . The data are reproduced to within by the NLO QCD calculation using various parameterisations of . Motivated by this level of agreement, the value of has been extracted from a fit to the data with the result [34]. The result is in good agreement with the world average and other recent results (see figure 7). It will be important to establish the insensitivity of the result to the form of the parameterisation of the gluon density if the result is to be included in a future world average .
4 Deep inelastic diffraction
The sample of NC DIS events observed by the H1 and ZEUS collaborations contains an intriguing diffractive subsample. Events in this subsample are characterised by the presence of a proton in the final state at small where is the four-momentum transfer between the incoming and outgoing proton. The subsample is large, acounting for of all NC DIS events. Figure 20 shows a schematic Feynman diagram for deep inelastic diffraction.
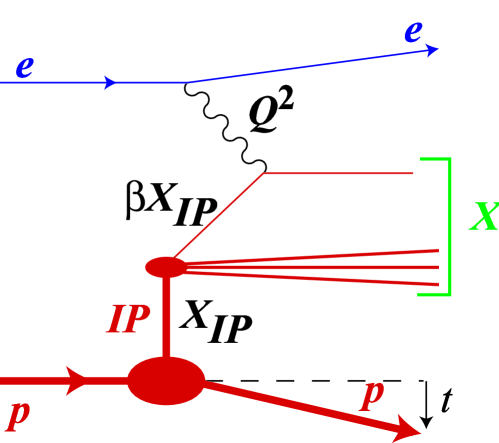
The incoming proton scatters through a small angle, emerging from the collision with an energy (where is the proton beam energy) and a transverse momentum kick of . The four-momentum lost by the proton is carried into the deep inelastic scatter by a colourless partonic state often referred to as the Pomeron. The electroweak current then picks out a parton, generating a hadronic system , of mass , which may be observed in the detector. Note that the hadronic excitation produced in the deep-inelastic scatter is not colour connected to the scattered proton. As a result, diffractive deep inelastic scattering events are characterised by an absense of hadronic energy flow between the proton and the hadronic system .
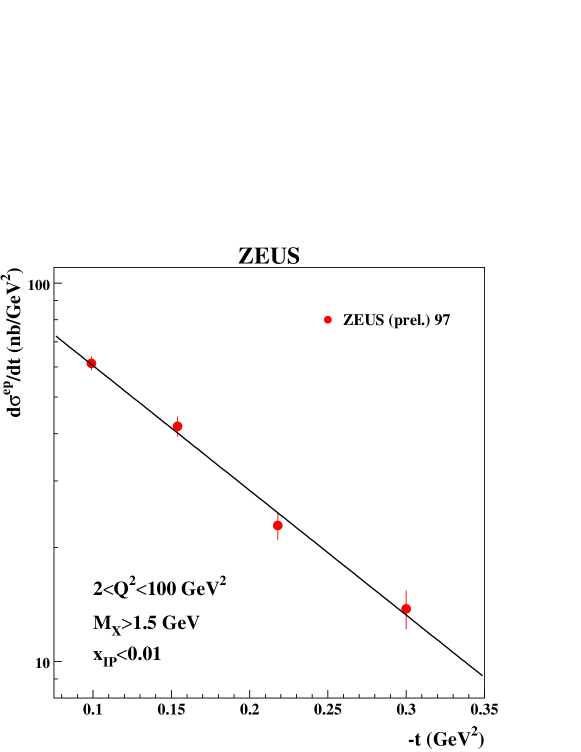
Two methods have been used to select such events. The most direct method is to tag the scattered proton. In this case the cross section can be measured as a function of . The most recent measurement from the ZEUS collaboration is shown in figure 21 [35]. The cross section exhibits the exponentially falling behaviour typical of diffractive processes. A fit to the data of the form yields GeV2.
The second method used to select diffractive events exploits the lack of hadronic activity in the forward (proton) direction. This selection is referred to as the large rapidity-gap selection. It is not possible with the large rapidity-gap selection to distinguish between events in which the proton scatters elastically from those in which a low mass excitation is produced at the proton vertex making it necessary to estimate the size of such a dissociative contribution and make an appropriate correction to the data.
Substantial experimental and theoretical progress has been made in recent years. An important theoretical development was the proof that at a particular and , the cross section for the inclusive diffractive process may be written in the form [36]:
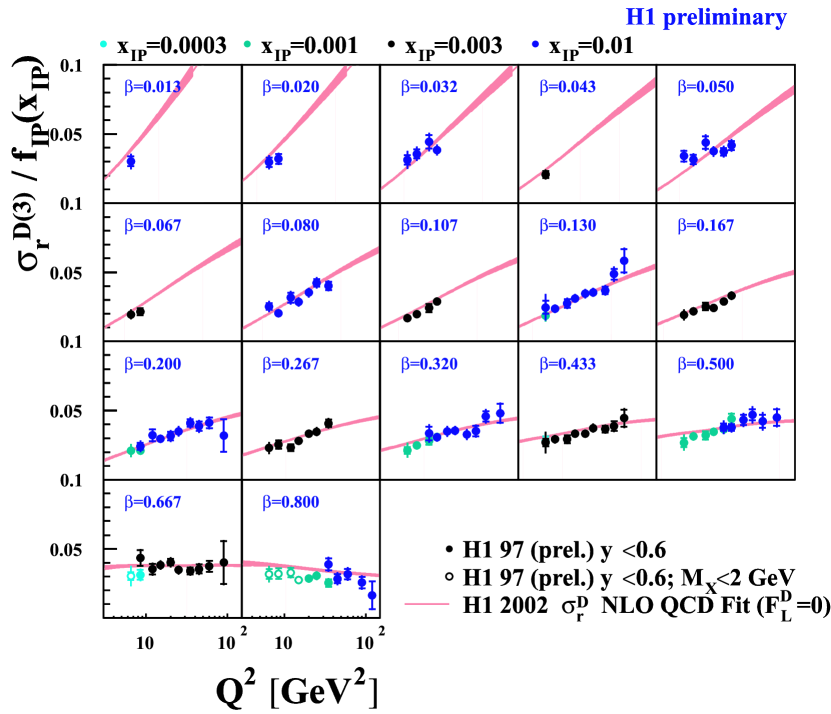
where are diffractive parton densities, is the hard deep inelastic scattering cross section and the sum runs over all active flavours . A consequence of this is that a determination of the diffractive cross section at fixed and as a function of and may be used in a NLO DGLAP analysis to determine the diffractive PDFs. The H1 collaboration has exploited the fact that the data are consistent with the hypothesis of Regge factorisation to carry out such an analysis [37]. A reduced diffractive cross section was defined in analogy to as follows:
Regge factorisation implies that the diffractive parton densities do not vary in shape with so that factorises into a convolution of the “Pomeron flux” and a hard scattering cross section as follows:
Integration of over yields:
Figure 22 shows the H1 measurement of plotted as a function of for several values of . For the data rise with indicating that the diffractive PDFs are dominated by gluons. The H1 collaboration has performed a NLO DGLAP fit the result of which is also shown in figure 22 and gives a good description of the data.
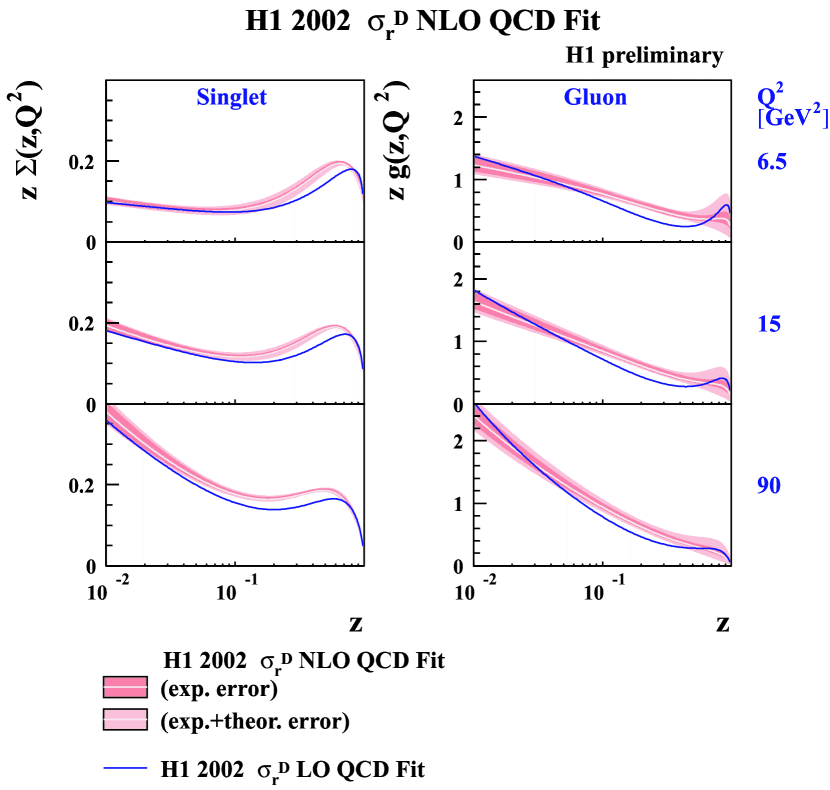
The diffractive PDFs extracted from the fit are shown in figure 23. Noting that the sum of the quark PDFs () is plotted on an expanded scale, it is clear that the diffractive gluon PDF is much larger than that of the quarks.
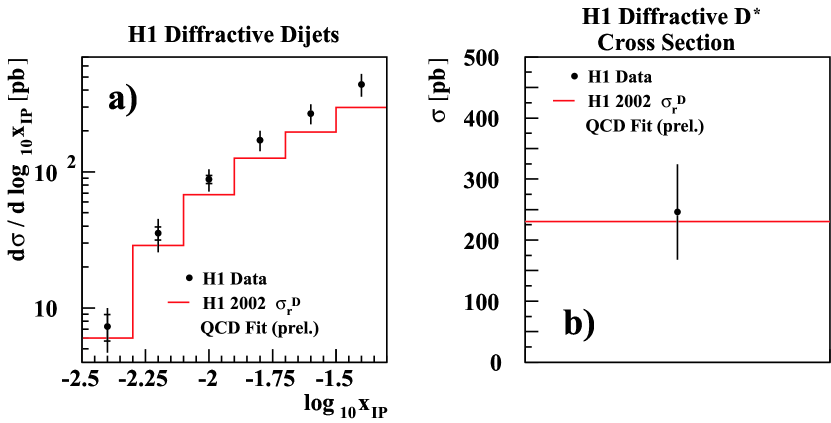
An important property of the PDFs of the proton is that they are universal. In order to investigate to what extent the diffractive PDFs are universal the H1 collaboration has calculated the diffractive dijet rate and the cross section for diffractive production. The results of these calculations are compared to the H1 measurements in figure 24. With the current precision of the data, and of the diffractive PDFs, the calculation gives a reasonable description of the data and therefore lends support to the notion that the diffractive PDFs are universal.
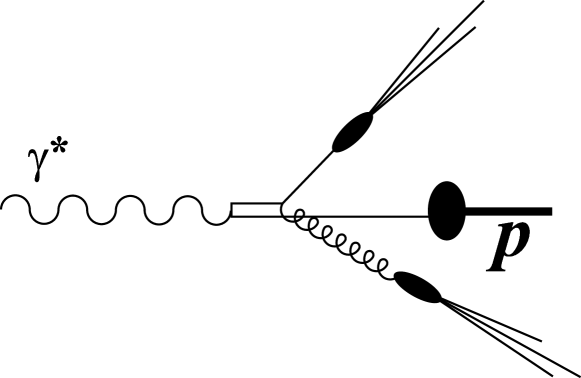
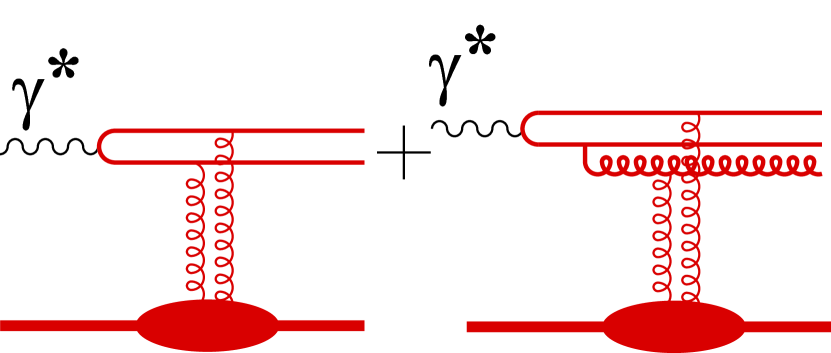
An alternative approach to the interpretation of diffractive DIS is to build a model of the interaction. This is usually done in the framework of a dipole model in which the interaction between the virtual photon and the proton is assumed to arise from the exchange of a Pomeron between the proton and a colour dipole parton system (see figure 25) [38]. The colour dipole system arises as a vacuum fluctuation in the wave function of the virtual photon, at lowest order a pair, at NLO a colour dipole state. The exchanged Pomeron is modelled as a collection of gluons in a colour singlet state. The simplest (lowest order) configuration is a pair of gluons. Parameters governing the functional form of the parameterisation of the cross section were determined in fits to data on inclusive diffraction in DIS.
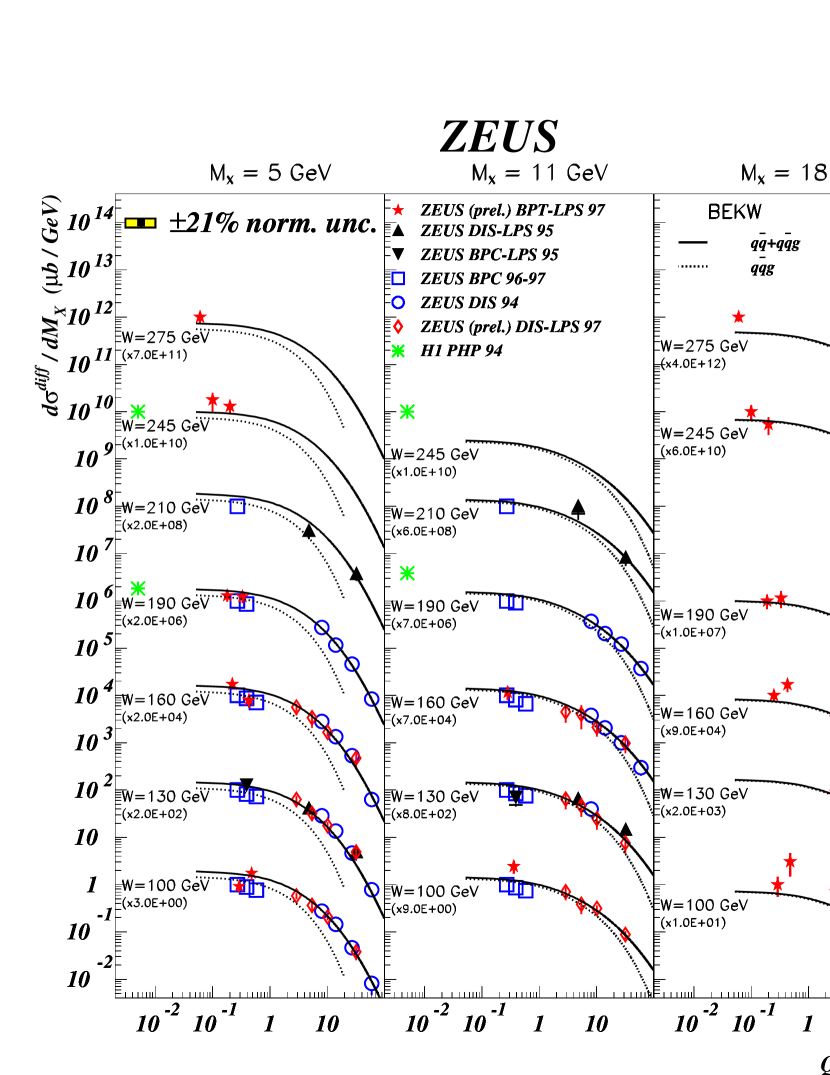
The ZEUS collaboration has measured the differential cross section [39]. The data is shown at fixed photon-proton cms energy () as a function of for several values of together with the predictions of the colour dipole model in figure 26. The data rise as falls, reaching a plateau for GeV2. The colour dipole model gives a good description of the data. The contribution dominates, particularly at low .
5 Jet production: an example
Substantial progress has been made in the measurement of a variety of inclusive jet topologies both at HERA and at the Tevatron. At the same time, theoretical progress in the development of codes to calculate at fixed order has also been made. It is not possible to make a complete survey of all the important contributions in the space available. QCD at NLO is often able to describe the qualititative features of the data. However, it is often not possible to obtain quantitative information, such as measurements of or parton densities. The reason for this is either that the data or the theory (or both) is too imprecise. The complementarity of the precision achieved in jet measurements and in the theoretical predictions at LEP is striking and has led to precise determinations of such quantities as . I have chosen to discuss the photoproduction of dijets below as an example of the need to strive for a similar complementarity in experimental and theoretical precision in hadron induced processes. Dijet photoproduction is particularly exciting because it offers sensitivity to photon and proton PDFs, especially at high , and sensitivity to .
The LO Feynman diagrams contributing to dijet photoproduction are shown in figure 27. At leading order, the direct process occurs through photon-gluon fusion. Two diagrams contribute, at LO, to the resolved process (figures 27b and c). The scattering diagram, in which a gluon is exchanged, gives the dominant contribution to the resolved process. Both ZEUS and H1 have presented measurements of the cross sections for dijet photoproduction and have shown that these measurements are well described by NLO QCD [40, 41].
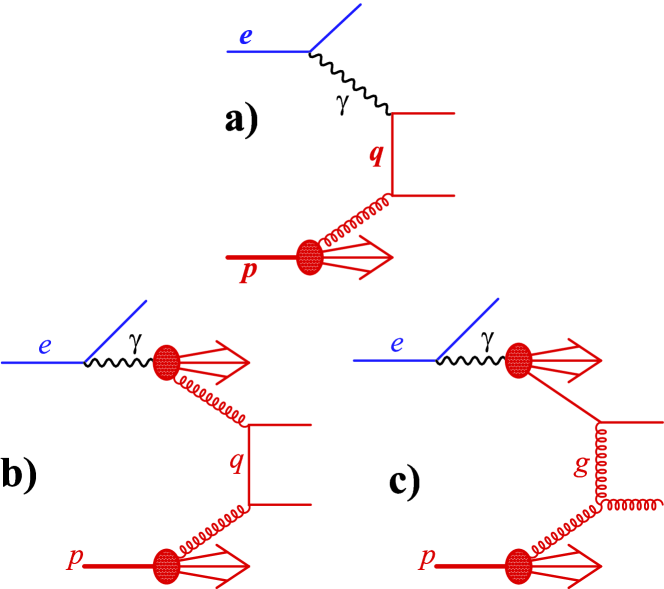
If the two jet transverse energies ( and ) and the jet pseudo-rapidities ( and ) are measured, the fraction of the momentum of the photon () and the fraction of the proton momentum () entering the collision can be estimated from the following formulæ:
A cut on can be used to obtain a sample enriched in resolved or direct events. A measurement of the dijet photoproduction cross section as a function of () is sensitive to the photon (proton) PDFs.
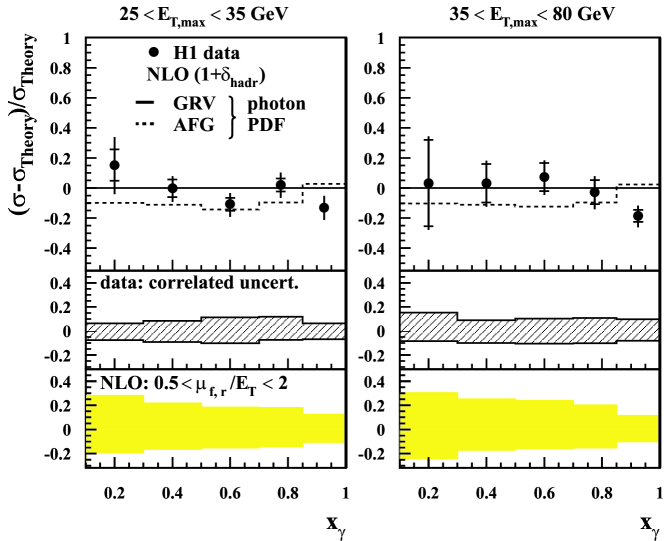
H1 has measured the dijet photoproduction cross section for GeV and . The measurement is compared to the predictions of QCD at NLO in figure 28 for two ranges of (). For the data are well described by the calculation. The theoretical and experimental uncertainties are presented in the figure. It is interesting to note that the experimental statistical and systematic errors are of comparable size and are somewhat smaller than the QCD scale uncertainty.
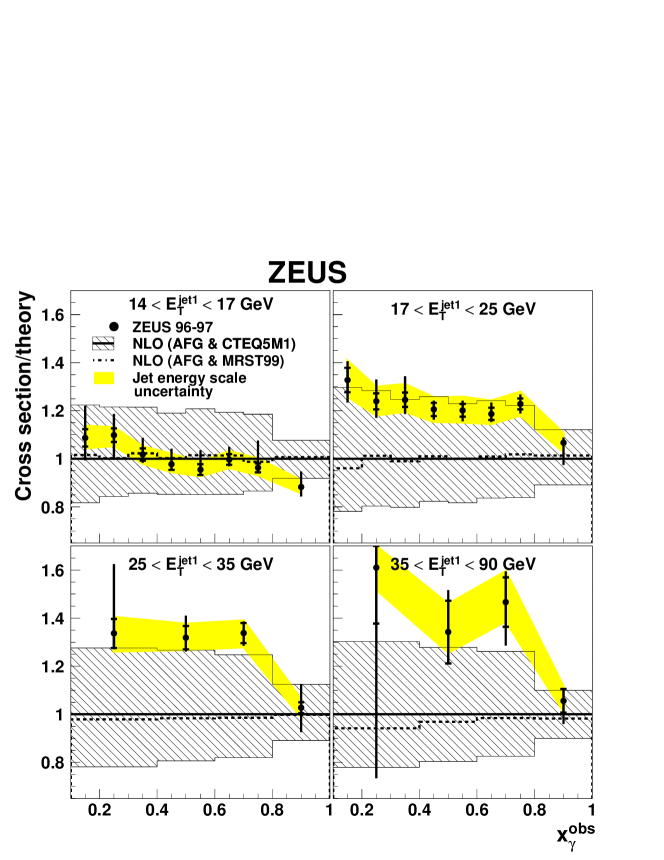
ZEUS has also measured the dijet photoproduction cross section using the following selection: GeV and . The measurement is compared to the NLO QCD prediction in figure 29 as a function of in bins of . The figure indicates that the data falls less steeply with than the NLO QCD calculation. Again, the experimental statistical and systematic errors are of comparable size and, in the lower bins, are smaller than the theoretical uncertainty.
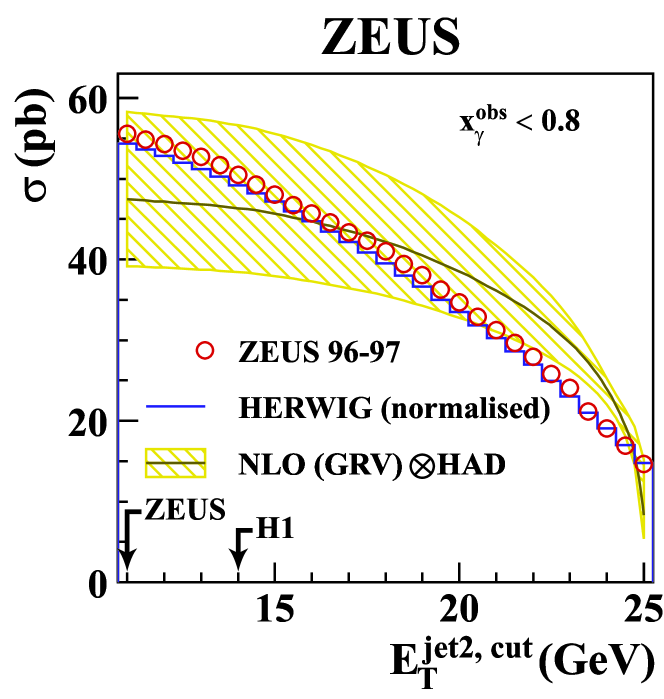
The apparent discrepancy in the extent to which NLO QCD describes the data is resolved by considering the dependence of the cross section on the cut on . Consider the H1 measurement in the bin GeV and the ZEUS measurement in the bin GeV. The cross section for GeV is plotted as a function of the cut on () in figure 30. Also shown are the results obtained using the leading-log shower Monte Carlo HERWIG and a NLO QCD calculation [42, 43]. The HERWIG Monte Carlo, which has been normalised to the data, gives a good description of the shape of the cross section. The NLO QCD calculation, on the other hand, gives a good description of the size of the cross section but is unable to describe the shape. Note that the theoretical uncertainty is large and increases as falls. The difference in the level of agreement of the ZEUS and H1 data with the calculation can now be explained by noting the position of the cut applied on . As shown in the figure, the H1 collaboration have chosen a value of in a region in which NLO QCD is close to the data, while the ZEUS collaboration cuts in a region where the NLO QCD prediction lies significantly above the data.
The large data sets soon to be collected at HERA II will make a substantial reduction in the experimental error possible if the experimental collaborations can reduce the systematic uncertainty. To extract quantitative information from this beautiful data will require progress in reducing the theoretical uncertainty, perhaps through going to a next-to-NLO calculation.
6 Conclusions
The papers submitted to the QCD sessions at this conference amply demonstrate the breadth and depth of activity in the field. At the end of the LEP era we have a detailed understanding of the process . This understanding has been exploited to yield measurements of the fundamental parameters of QCD, and the colour factors at a precision of and respectively. Lepton-nucleon deep inelastic scattering has provided measurements of the partonic structure of the proton with a precision of for quarks and for the gluons. Yet much remains to be accomplished if we are to achieve a complete, quantitative, understanding of QCD. The detailed measurements of diffraction in deep inelastic scattering present a clear challenge and highlight the need to continue the experimental and theoretical investigation of the transition from the perturbative to the non-perturbative regime.
The coming years will see HERA and the Tevatron deliver large data sets. The experimental challenge will be to ensure that the systematic uncertainties are reduced to match the statistical precision of the data. The LEP measurements of demonstrate the precision which can be achieved if theoretical uncertainties can be made at least as small as those of the experiment. At present the theoretical uncertainty on the majority of hadron-induced cross sections is large compared to the anticipated statistical precision. The ambition to develop a full, quantitative, understanding of QCD now requires a broad and sustained programme of measurement and interpretation. By energetically developing the already strong partnership between theorists, phenomenologists and experimentalists we can work confidently to achieve this ambition.
Acknowledgements
I would like to thank the organisers for giving me the opportunity to present this review. I gratefully acknowledge the help, advice and support of my many colleagues, both experimentalists and theorists, who have freely discussed their results with me. Finally, I would like to thank O. Gonzalez, K. Nagano and A. Tapper for help in the preparation of the figures and E. Laenen for technical support at the conference and patience through-out.
References
- [1] ALEPH Collaboration, A. Heister et al., CERN-EP/2002-029. Submitted to Eur. Phys. J. C.
- [2] OPAL Collaboration, G. Abbiendi et al., Eur. Phys. J. C 20 (2001) 601.
- [3] DELPHI Collaboration, P. Abreu et al., Phys. Lett. B414 (1997) 401.
- [4] DELPHI Collaboration, P. Abreu et al., Phys. Lett. B 449 (1999) 383.
-
[5]
DELPHI Collaboration, O. Pason et al., Abstract 228, paper
contributed to this conference.
K. Hamacher these proceedings. - [6] JADE Collaboration, Eur. Phys. J. C (2001) 199.
- [7] G. Dissertori, these proceedings and references therein.
- [8] P.A. Movilla Fernandez, these proceedings.
-
[9]
ZEUS Collaboration, Abstract 855, paper contributed to this
conference.
M. Sutton, these proceedings. - [10] CDF Collaboration, T. Affolder et al., Phys. Rev. Lett. 88 (2002) 042001.
- [11] CDF Collaboration, T. Affolder et al., Phys. Rev. D 64 (2001) 032001.
-
[12]
PDG, Phys. Rev. D 66 (2002) 010001;
S. Bethke, J. Phys. G 26 (2000) R27. - [13] H1 Collaboration, C. Adloff et al., Eur. Phys. J. C 21 (2001) 33.
-
[14]
H1 Collaboration, Abstract 978, paper contributed to this
conference.
Z. Zhang, these proceedings. - [15] ZEUS Collaboration, S. Chekanov et al., Eur. Phys. C 21 (2001) 443.
-
[16]
NMC Collaboration, M. Arneodo et al., Nucl. Phys. B 483 (1997) 3;
BCDMS Collaboration, A.C. Benvenuti et al., Phys. Lett. B 223 (1989) 485;
E665 Collaboration, M.R. Adams et al., Phys. Rev. D 54 (1996) 3006. -
[17]
Y.L. Dokshitzer, Sov. Phys. JETP 46 (1977) 641;
V.N. Gribov and L.N. Lipatov, Sov. J. Nucl. Phys. 15 (1972) 438 and 675;
G. Alterelli and G. Parisi, Nucl. Phys. B 126 (1977) 298. - [18] J. Pumplin et al., JHEP 07 (2002) 012.
- [19] A.D. Martin et al., Eur. Phys. J. C 23 (2002) 73.
-
[20]
H1 Collaboration, C. Adloff et al., Eur. Phys. J. C 21 (2001) 33;
H1 Collaboration, Abstract 978, paper contributed to this conference.
Z. Zhang, these proceedings. - [21] ZEUS Collaboration, C. Chekanov et al., DESY-02-105, submitted to Phys. Rev. D.
- [22] H1 Collaboration, C. Adloff et al., Phys. Lett. B 520 (2001) 183.
- [23] J. Breitweg et al., Eur. Phys. J. C 7 (1999) 609.
- [24] H1 Collaboration, C. Adloff et al., Eur. Phys. J. C 19 (2001) 269.
- [25] ZEUS Collaboration, J. Breitweg et al., Eur. Phys. J. C 11 (1999) 427.
- [26] ZEUS Collaboration, J. Breitweg et al., Eur. Phys. J. C 12 (2000) 411.
- [27] ZEUS Collaboration, S. Chekanov et al., DESY-02-113, submitted to Eur. Phys. J. C.
- [28] ZEUS Collaboration, S. Chekanov et al., Phys. Lett. B 539 (2002) 197.
- [29] E. Rizvi in Proceedings of the EPS International Conference on High Energy Physics, Budapest 2001 (D. Howvarth, P. Levai, A. Patkos, eds.), JHEP (http://jhep.sissa.it/) Proceedings Section, PrHEP-hep2001/011 and references therein.
- [30] D0 Collaboration, B. Abbott et al., Phys. Rev. Lett. 86 (2001) 1707, Phys. Rev. D 64 (2001) 032003.
- [31] CTEQ Collaboration, H.L Lai et al., Eur. Phys. J. C 12 (2000) 375.
- [32] A.D. Martin et al., Phys. Lett. B 531 (2002) 216.
- [33] R. Nisius, these proceedings and references therein.
- [34] S. Albino, M. Klasen, Phys. Rev. Lett. 89 (2002) 122004.
- [35] ZEUS Collaboration, Abstract 566, paper contributed to this conference.
- [36] J.C. Collins, Phys. Rev. D 57 (1998) 3051 and erratum-ibid. D 61 (2000) 019902.
-
[37]
H1 Collaboration, Abstract 980, paper contributed to this
conference.
F.P. Schilling, these proceedings. - [38] J. Bartels et al., Eur. Phys. J. C 7 (1999) 443.
-
[39]
ZEUS Collaboration, S. Chekanov et al., Eur. Phys. J. C
DOI 10.1140/s10052-002-1003-1.
ZEUS Collaboration, Abstract 822, paper contributed to this conference. - [40] H1 Collaboration, C. Adloff et al., Eur. Phys. J. C 25 (2002) 1.
- [41] ZEUS Collaboration, S. Chekanov et al., Eur. Phys. J. C 23 (2002) 4.
- [42] G. Marchesini et al., Comp. Phys. Comm. 67 (1992) 465.
-
[43]
S. Frixione, Z. Kunszt and A. Signer, Nucl. Phys. B 467 (1996) 399;
S. Frixione, Nucl. Phys. B 507 (1997) 295;
S. Frixione, G. Ridolfi, Nucl. Phys. B 507 (1997) 315.