The K2K Collaboration
Indications of Neutrino Oscillation in a 250 km Long-baseline Experiment
Abstract
The K2K experiment observes indications of neutrino oscillation: a reduction of flux together with a distortion of the energy spectrum. Fifty-six beam neutrino events are observed in Super-Kamiokande (SK), 250 km from the neutrino production point, with an expectation of . Twenty-nine one ring -like events are used to reconstruct the neutrino energy spectrum, which is better matched to the expected spectrum with neutrino oscillation than without. The probability that the observed flux at SK is explained by statistical fluctuation without neutrino oscillation is less than 1%.
pacs:
PACS numbers: 14.60.Pq, 13.15.+g, 23.40.Bw, 95.55.VjRecent atmospheric and solar neutrino data indicate the existence of neutrino oscillation and therefore the existence of neutrino mass Fukuda et al. (1998a, 2002); Ahmad et al. (2002). The zenith angle distribution of atmospheric neutrinos observed by Super-Kamiokande (SK) shows a clear deficit of upward-going muon neutrinos, which is well explained by two-flavor - oscillations with around , and close to or equal to unity.
The KEK to Kamioka long-baseline neutrino oscillation experiment (K2K) Ahn et al. (2001) uses an accelerator-produced neutrino beam with a neutrino flight distance of 250 km to probe the same region as that explored with atmospheric neutrinos. The neutrino beam is produced by a 12 GeV proton beam from the KEK proton synchrotron. After the protons hitting an aluminum target, the produced positively charged particles, mainly pions, are focused by a pair of pulsed magnetic horns Ieiri et al. (1997). The neutrinos produced from the decays of these particles are 98% pure muon neutrinos with a mean energy of 1.3 GeV.
This analysis is based on data taken from June 1999 to July 2001, corresponding to protons on target (POT). The pion momentum and angular distributions downstream of the second horn are occasionally measured with a gas-Cherenkov detector (PIMON) Maruyama (2000) in order to verify the beam Monte Carlo (MC) simulation and to estimate the errors on the flux prediction at SK. The direction of the beam is monitored on a spill-by-spill basis by observing the profile of the muons from the pion decays with a set of ionization chambers and silicon pad detectors located just after the beam dump. The neutrino beam itself is measured in a set of near neutrino detectors (ND) located 300 m from the proton target. The measurements made at the ND are used to verify the stability and the direction of the beam, and to determine the flux normalization and the energy spectrum before the neutrinos travel the 250 km to SK. The flux at SK is estimated from the flux of the ND by multiplying the Far/Near (F/N) ratio, the ratio of fluxes between the far detector (SK) and ND, to that of the ND.
Since both a suppression in the number of events and a distortion of the spectrum are expected for neutrinos which travel a fixed path length in the presence of oscillations, both the number of observed events and the spectral shape information at SK are compared with expectation. All of the beam-induced neutrino events observed within the fiducial volume of SK are used to measure the overall suppression of flux. In order to study the spectral distortion, 1 ring -like events () are selected to enhance the fraction of charged-current (CC) quasi-elastic (QE) interactions (). Only the muon is visible in these reactions since the proton momentum is typically below Cherenkov threshold. The energy of the parent neutrino can be calculated by using the observed momentum of the muon, assuming QE interactions, and neglecting Fermi momentum:
| (1) |
where , , , and are the nucleon mass, muon energy, the muon mass, the muon momentum and the scattering angle relative to the neutrino beam direction, respectively.
The ND is comprised of two detector systems: a 1 kiloton water Cherenkov detector (1KT) and a fine-grained detector (FGD) system. The flux normalization is measured by the 1KT to estimate the expected number of events at SK. Since the 1KT has the same detector technology as SK, most of systematic uncertainties on the measurement are canceled. The energy spectrum is measured by analyzing the muon momentum and angular distributions in both detector systems. The 1KT has a high efficiency for reconstructing the momentum of muons below 1 , and full 4 coverage in solid angle. However, the 1KT has little efficiency for reconstructing muons with momentum above 1.5 since they exit the detector. The FGD, on the other hand, has high efficiency for measuring muons above 1 , and the two complementary detectors are thus able to completely cover the relevant energy range.
In the 1KT analysis, a cylindrical fiducial volume of 25 tons oriented along the beam direction is used. Event selection criteria for the flux normalization are the same as those in reference Ahn et al. (2001). Events which deposit more than MeV of energy are used for the measurement of the integrated flux. The measurement has a 5% systematic uncertainty, of which the largest contribution comes from the vertex reconstruction Ahn et al. (2001). For the spectrum measurement, further cuts are imposed in order to select events which stop in the detector. Among the events selected for the flux normalization measurement, 53% of the events have 1 ring. The events with a muon exiting from the detector are effectively eliminated by requiring the maximum charge of any PMT to be less than 200 photo-electrons; 68% of the 1 ring events remain after this requirement. The largest systematic uncertainty for the spectrum measurement is an uncertainty on the energy scale. The energy scale is understood to within %, which is confirmed with both cosmic-ray muons and beam-induced s.
The FGD is comprised of a scintillating fiber and water detector (SciFi) Suzuki et al. (2000), a lead-glass calorimeter (LG), and a muon range detector (MRD) Ishii et al. (2002). In the FGD analysis, events containing one or two tracks with vertex within the 5.9 ton fiducial volume of the SciFi are used. The track finding efficiency is 70% for a track passing through three layers of scintillating fiber and close to 100% for more than 5 layers Kim et al. (2002). Three layers is the minimum track length required in this analysis. Events which have at least one track passing into the MRD are chosen in order to select -induced CC interactions. The momentum of the track is measured by its range through the SciFi, LG, and MRD, with accuracy of 3%.


If the proton produced in the QE interaction has a momentum greater than 600 MeV/, its track may also be reconstructed. In the case where a second track is visible, the kinematic information is used to enhance the fraction of QE events in the sample. Assuming QE interaction, the direction of the proton can be predicted from the muon momentum. The QE enhanced sample is selected by requiring that the direction of the second track agrees with the prediction to within 25 degrees. Events where the direction of the second track differs from the prediction by more than 30 degrees are put into a non-QE enhanced sample. In the QE enhanced sample, 62% of the events are estimated to be QE events from the MC simulation. In the non-QE enhanced sample, % of events are estimated to come from interactions other than QE. The SciFi events are divided into three event categories: 1-track, 2-track QE enhanced, and 2-track non-QE enhanced samples.
The 2-dimensional distributions of the muon momentum versus angle with respect to the beam direction of four event categories (the 1KT event sample and the three SciFi event samples) are used to measure the neutrino spectrum. A -fitting method is used to compare these data against the MC expectation. The neutrino spectrum is divided into 8 energy bins as defined in Table 1. During the fit, the flux in each energy bin is re-weighted relative to the values in the beam MC. These weights are normalized relative to 1.00 for the 1.5 GeV bin. An overall normalization is included as a free parameter in the fit. The parameter is used to re-weight the ratio between the QE and non-QE cross-section relative to the MC simulation. The systematic uncertainties of the ND are incorporated into the fitting parameters. They are the energy scales, the track finding efficiencies, and the detector thresholds. In addition, the spectrum measurement by PIMON is used as a constraint on the re-weighting factors.
The value of is 227.2/197 d.o.f. at the best fit point. All the parameters including the detector systematics are found to lie within their expected errors. The best fit values of the flux re-weighting factors are shown in Table 1. The muon momentum and angular distributions of events in the 1KT, and the muon momentum distributions of the 2-track QE enhanced and non-QE enhanced events in SciFi are overlaid with the re-weighted MC in Figure 1. The fit result agrees well with the data. The errors of the measurement are provided in the form of an error matrix. Correlations between the parameters of the fit are taken into account in the oscillation analysis using this matrix. The diagonal elements in the error matrix are shown in Table 1.
| (GeV) | (F/N) | |||
|---|---|---|---|---|
| 00.5 | 1.31 | 49 | 2.6 | 8.7 |
| 0.50.75 | 1.02 | 12 | 4.3 | 4.3 |
| 0.751.0 | 1.01 | 9.1 | 4.3 | 4.3 |
| 1.01.5 | — | 6.5 | 8.9 | |
| 1.52.0 | 0.95 | 7.1 | 10 | 10 |
| 2.02.5 | 0.96 | 8.4 | 11 | 9.8 |
| 2.53.0 | 1.18 | 19 | 12 | 9.9 |
| 3.0 | 1.07 | 20 | 12 | 9.9 |
The uncertainty due to neutrino interaction models is separately studied. In QE scattering, the axial vector mass in the dipole formula is set to a central value of 1.1 and is varied by 10%. The axial mass for single pion production is set to a central value of 1.2 and is varied by 20% Bernard et al. (2002). This affects both the dependence of the cross-section and the total cross-section. For coherent pion production, two different models are compared: one is the Rein and Sehgal model Rein and Sehgal (1983), and the other is a model by Marteau Marteau et al. (2000). For deep inelastic scattering, GRV94 Gluck et al. (1995) and the corrected structure function by Bodek and Yang Bodek and Yang (2002) are studied. For the oscillation analysis the Marteau model and Bodek and Yang structure functions are employed. Varying the choice of models causes the fitted value of () to change by . In order to account for this, an additional systematic error of on is added to the error matrix. The choice of models and axial mass does not affect the spectrum measurement itself beyond the size of the fitted errors.
The F/N ratio from the beam simulation is used to extrapolate the measurements at the ND to those at SK. The errors including correlations above 1 GeV, where the PIMON is sensitive, are estimated based on the PIMON measurements. The errors on the ratio for below 1 GeV are estimated based on the uncertainties in the hadron production models used in the K2K beam MC Ahn et al. (2001). The diagonal elements in the error matrix for the F/N ratio are summarized in Table 1.
The events in SK are selected using the timing information provided by the global positioning system. Events detected in SK must occur within an expected beam arrival time window of . In addition, the detected events must have no activity in outer detector, and have an energy deposit greater than 30 MeV with a vertex reconstructed within the 22.5 kiloton fiducial volume Ahn et al. (2001). This sample of events is referred to as the fully contained (FC) sample. The efficiency of this selection is 93% for CC interactions. Fifty-six events satisfy the criteria. With the timing cut, the expected number of atmospheric neutrino background is approximately events.
The expected number of FC events at SK without oscillation is estimated to be . The correlations between energy bins from the spectrum measurement at the ND and the F/N ratio are taken into account in the estimation of the systematic errors. The major contributions to the errors come from the uncertainties in the F/N ratio ( ) and the normalization (5.0%), dominated by uncertainties of the fiducial volumes due to vertex reconstruction both at the 1KT and SK.
A two flavor neutrino oscillation analysis, with disappearance, is performed by the maximum-likelihood method. In the analysis, both the number of FC events and the energy spectrum shape for events are used. The likelihood is defined as . The normalization term is the Poisson probability to observe events when the expected number of events is . The symbol represents a set of parameters constrained by the systematic errors. These parameters are described in detail later. The shape term, is the product of the probability for each event to be observed at , where is the normalized distribution estimated by MC simulation and is the number of events.
In the oscillation analysis, the whole data sample is used for , i.e. . The spectrum shape in June 1999 was different from that for the rest of the running period because the target radius and horn current were different. The estimation of energy correlations in the spectrum at the ND and in the far/near ratio has not been completed for this period. Thus, data taken in June 1999 are discarded for . The discarded data correspond to 6.5% of total POT. The number of events observed excluding the data of June 1999 is 29, and the corresponding number of events expected from MC simulation in the case of no oscillation is 44.
The parameters consist of the re-weighted neutrino spectrum measured at the ND (), the F/N ratio, the reconstruction efficiency () of SK for events, the re-weighting factor for the QE/non-QE ratio , the SK energy scale and the overall normalization. The errors on the first 3 items depend on the energy and have correlations between each energy bin. The diagonal parts of their error matrices are summarized in Table 1 as described earlier. The error on the SK energy scale is 3% Fukuda et al. (1998b). Two different approaches are taken for the treatment of systematic errors in the likelihood. The first is to treat the parameters as fitting parameters with an additional constraint term in the likelihood (method 1) Fukuda et al. (1998a). The other approach is to average the sampled over many random trials weighted according to the probability density distribution of the systematic parameters (method 2) Swain and Taylor (1998).
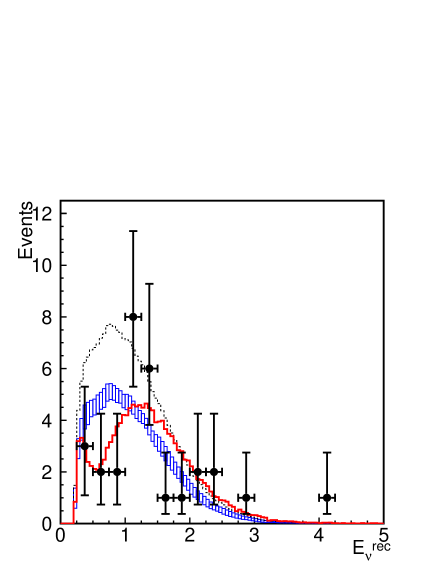
The likelihood is calculated at each point in the and space to search for the point where the likelihood is maximized. The best fit point in the physical region of oscillation parameter space is found to be at (, )= in method 1 and at in method 2. If the whole space including the unphysical region is considered the values are in method 1 and in method 2. The results from two methods are consistent with each other. At the best fit point in the physical region the total number of predicted events is 54.2, which agrees with the observation of 56 within statistical error. The observed distribution of the sample is shown in Figure 2 together with the expected distributions for the best fit oscillation parameters, and the expectation without oscillations. Consistency between the observed and best-fit spectrum is checked by using Kolgomorov-Smirnov(KS) test. A KS probability of 79% is obtained. The best fit spectrum shape agrees with the observations.
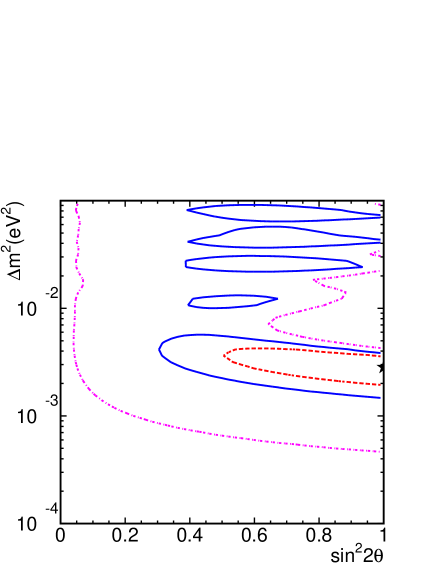
The probability that the observations are due to a statistical fluctuation instead of neutrino oscillation is estimated by computing the likelihood ratio of the no-oscillation case to the best fit point. The no-oscillation probabilities are calculated to be 0.7% and 0.4% for method 1 and 2 respectively. When only normalization (shape) information is used, the probabilities are 1.3% (16%) and 0.7% (14.3%) for the two methods. Allowed regions of oscillation parameters are evaluated by calculating the likelihood ratio of each point to the best fit point, and are drawn in Figure 3. Both methods give essentially the same results. In order to be conservative, the result from method 1 is shown in the figure as it gives a slightly larger allowed region at the 99% C.L. The 90% C.L. contour crosses the axis at and eV2 for . The oscillation parameters preferred by the total flux suppression and the energy distortions alone also agree well. Finally, the uncertainties of neutrino interactions are studied using the same procedure as the spectrum measurement at the ND. It is found that the effects of the interaction model difference on all the results are negligible due to the cancellation caused by using the same models in both the ND and SK.
In conclusion, both the number of observed neutrino events and the observed energy spectrum at SK are consistent with neutrino oscillation. The probability that the measurements at SK are explained by statistical fluctuation is less than 1%. The measured oscillation parameters are consistent with the ones suggested by atmospheric neutrinos. At the time of this letter the K2K experiment has collected approximately one-half of its planned protons on target.
Acknowledgements.
We thank the KEK and ICRR Directorates for their strong support and encouragement. K2K is made possible by the inventiveness and the diligent efforts of the KEK-PS machine and beam channel groups. We gratefully acknowledge the cooperation of the Kamioka Mining and Smelting Company. This work has been supported by the Ministry of Education, Culture, Sports, Science and Technology, Government of Japan and its grants for Scientific Research, the Japan Society for Promotion of Science, the U.S. Department of Energy, the Korea Research Foundation, and the Korea Science and Engineering Foundation.References
- Fukuda et al. (1998a) Y. Fukuda et al. (Super-Kamiokande), Phys. Rev. Lett. 81, 1562 (1998a), eprint [http://arXiv.org/abs]hep-ex/9807003.
- Fukuda et al. (2002) S. Fukuda et al. (Super-Kamiokande), Phys. Lett. B539, 179 (2002), eprint [http://arXiv.org/abs]hep-ex/0205075.
- Ahmad et al. (2002) Q. Ahmad et al. (SNO), Phys. Rev. Lett. 89, 011301 (2002), eprint [http://arXiv.org/abs]hep-ex/0204008.
- Ahn et al. (2001) S. H. Ahn et al. (K2K), Phys. Lett. B511, 178 (2001), eprint [http://arXiv.org/abs]hep-ex/0103001.
- Ieiri et al. (1997) M. Ieiri et al. (1997), prepared for 11th Symposium on Accelerator Technology and Science, Hyogo, Japan, 21-23 Oct 1997.
- Maruyama (2000) T. Maruyama, Ph.D. thesis (Tohoku Unversity) (2000).
- Suzuki et al. (2000) A. Suzuki et al. (K2K), Nucl. Instrum. Meth. A453, 165 (2000), eprint [http://arXiv.org/abs]hep-ex/0004024.
- Ishii et al. (2002) T. Ishii et al. (K2K MRD Group), Nucl. Instrum. Meth. A482, 244 (2002), eprint [http://arXiv.org/abs]hep-ex/0107041.
- Kim et al. (2002) B. J. Kim et al. (2002), eprint [http://arXiv.org/abs]hep-ex/0206041.
- Bernard et al. (2002) V. Bernard, L. Elouadrhiri, and U. G. Meissner, J. Phys. G28, R1 (2002), eprint [http://arXiv.org/abs]hep-ph/0107088.
- Rein and Sehgal (1983) D. Rein and L. M. Sehgal, Nucl. Phys. B223, 29 (1983).
- Marteau et al. (2000) J. Marteau et al., Nucl.Instrum.Meth. A451, 76 (2000).
- Gluck et al. (1995) M. Gluck, E. Reya, and A. Vogt, Z. Phys. C67, 433 (1995).
- Bodek and Yang (2002) A. Bodek and U.-K. Yang, submitted to Nucl. Phys. Proc. Suppl. (2002), eprint [http://arXiv.org/abs]hep-ex/0203009.
- Fukuda et al. (1998b) Y. Fukuda et al. (Super-Kamiokande), Phys. Lett. B433, 9 (1998b), eprint [http://arXiv.org/abs]hep-ex/9803006.
- Swain and Taylor (1998) J. Swain and L. Taylor, Nucl. Instrum. Meth. A411, 153 (1998), eprint [http://arXiv.org/abs]hep-ex/9712015.