Atmospheric neutrino oscillations with MACRO
Abstract
DFUB 12/2002
Bologna, 04/11/02
Contribution to the XII ISVHECRI, CERN, Geneva, 15-20 July 2002
We present the latest results on the study of atmospheric neutrino oscillations with the MACRO detector at Gran Sasso. Two sub-samples of events have been analysed, both in terms of absolute flux and zenith angle distribution: high energy events (with 50 GeV) and low energy events (with 4 GeV). The high energy sample has been used also to check the oscillation hypothesis and to estimate neutrino energies using Multiple Coulomb Scattering (MCS) informations. All these analyses are mutually consistent and strongly favour the oscillation hypothesis with maximal mixing and eV2.
1 INTRODUCTION
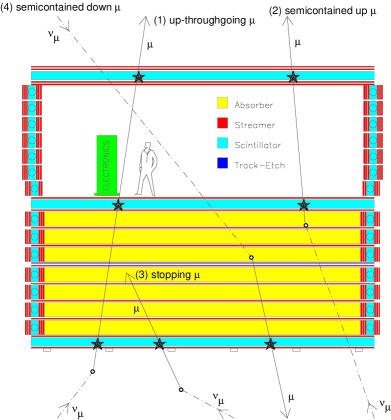
The MACRO detector [1] was located in the Gran Sasso Laboratory (Italy) and allowed the study of atmospheric neutrinos detecting upgoing muons produced in CC interactions inside or around the detector. It used scintillation counters for tagging events by time-of-flight (TOF) measurements, and limited streamer tubes for tracking. Three categories of -induced muon events were studied (see Fig. 1): 1) upthroughgoing muons, produced in the rock below the detector and crossing the whole apparatus, with an average energy 50 GeV; 2) internal upgoing (IU) muons, produced inside and leaving the detector from above; 3) upgoing stopping muons (UGS), produced below and stopping inside the detector plus internal downgoing (ID) muons, produced inside and leaving the detector from below. Since at least two scintillation counters are needed to perform a TOF measurement, the events of samples UGS and ID are studied on a topological basis and are indistinguishable. Therefore, they are studied together. The average neutrino energy for samples 2 and 3 is about 4 GeV, and we collectively refer to these events as to the Low Energy (LE) sample [3], while events from sample 1 belong to the High Energy (HE) sample [2].
2 HIGH ENERGY SAMPLE
Events in the HE sample have been selected by measuring the TOF between two layers of scintillators. For events crossing three layers of scintillators, a linear fit of the times as a function of the path lengths has been performed, in order to reduce possible fake events. A detailed tuning of the TOF measurements provided a reduction factor of of the downgoing atmospheric muons. Other sources of background have been reduced by applying a cut on the matching positions between scintillators and streamer tubes. Soft upgoing hadrons coming from photonuclear interactions of muons outside the detector could mimic an upgoing muon: to reduce this background we require that each upgoing muon crosses at least 200 g/cm2 of absorber in the lower part of the detector [4]. Muons coming from particular azimuthal regions, where the rock amount is not sufficient to reduce the number of downgoing muons, have been discarded. 863 events survived these cuts (809 after background subtraction), corresponding to a livetime of 6.16 yrs.
Monte Carlo (MC) simulation of upgoing muon events has been performed using the flux computed by the Bartol group [5], neutrino cross sections from Ref. [6] and muon energy loss in the rock from calculations of Ref. [7]. The overall theoretical uncertainty on the absolute upgoing muon flux is 17%, while the systematic error on the shape of the angular distribution is 5%.
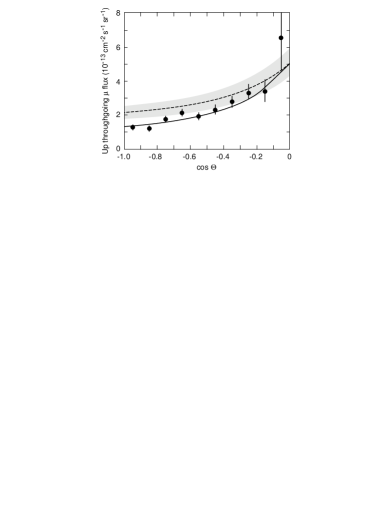
Compared to MC predictions the number of measured events is small and the shape of the angular distribution is different, Fig. 2. The ratio between the observed number of events and the MC prediction is . The shapes of the experimental distribution and MC predictions assuming no oscillations, analysed in terms of , give an agreement probability of 0.2%. Assuming oscillations, the angular distribution and the absolute number of events give a best fit for maximal mixing and eV2, with a probability of 66%. The result of the fit is shown as a solid line in Fig. 2.
2.1 oscillations
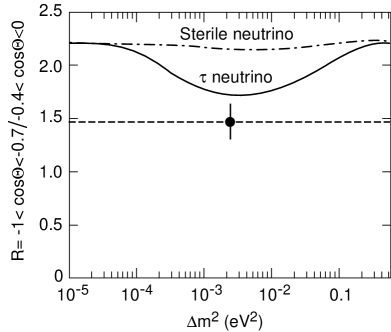
The weak potential of and with matter is different from the and potentials. On the other hand, and potentials are equal: this difference translates in a distortion of the oscillation pattern (and hence of the angular distribution) in the oscillation with respect to the case. Matter effects become important when GeV/eV2, i.e. for HE events. A detailed analysis [8] has shown that the best estimator to disentangle the two hypotheses is the ratio between the number of events with -1 -0.7 and the number of events with -0.4 0, where is the zenith angle. In this ratio, most of the theoretical uncertainties cancel and the overall uncertainty, combined with the experimental systematic error, is 7%. The measured ratio is . This result is shown in Fig. 3 together with the MC prediction, as a function of the . In the best fit point, the expected values for and are and respectively. The ratio of the probabilities to obtain values as low as the observed one is , therefore can be excluded with respect at 99% CL.
2.2 Energy estimate by means MCS
The limited streamer tube system of the MACRO detector has been used in order to estimate muon energies (and hence neutrino energies) using MCS informations. A first analysis, which used streamer tubes in digital mode (with a spatial resolution of cm), successfully showed the feasibility of the method [9]. In order to improve the sensitivity of the analysis to higher neutrino energies, we used the streamer tubes in drift mode, improving the resolution by a factor 3.5 [10]. Two dedicated test beams at CERN PS/SPS checked electronics, detector performances and analysis tools. Starting from MCS sensitive variables, a MC trained neural network was used for muon (and neutrino) energy reconstruction. These results allowed to increase the sensitivity of the analysis up to neutrino energies of 100 GeV. We separated the HE sample in four different energy regions: the results show that the agreement between data and MC predictions follows the energy dependence expected in the oscillation hypothesis with the parameters given in the previous section [11].
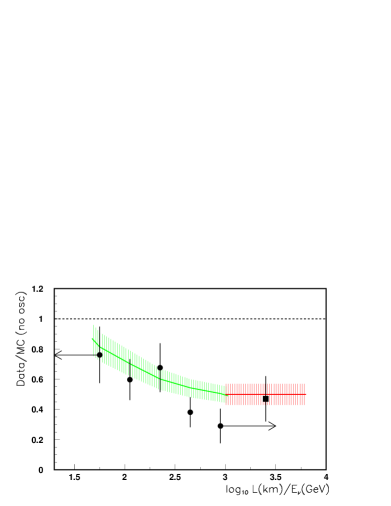
The distance travelled by neutrinos inside the Earth (reconstructed with a precision of 3%) was used to estimate the on a event-by-event basis. This is shown in Fig. 4, where the ratio as a function of the estimated log is plotted. Errors include uncertainties both on the flux and on the shape. MC prediction is also reported, with the same parameters of the standard analysis, showing that the trend of the data is the one we expect in the oscillation hypothesis.
3 LOW ENERGY SAMPLE
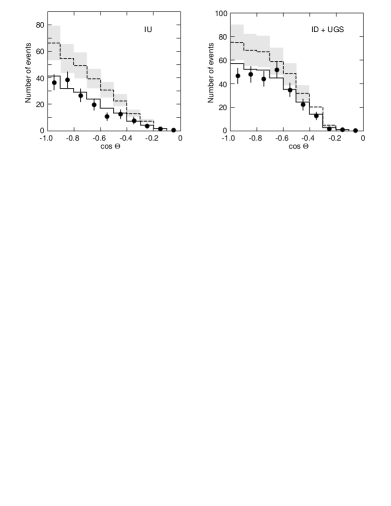
IU and ID+UGS events are produced in CC interactions inside the detector, with a small contamination of NC and events ( 13% and 10% respectively). IU events have been selected by TOF measurement and by topological criteria, e.g. the requirement of the interaction vertex in the fiducial volume of the detector. The ID+UGS sample has been selected only with topological criteria. Since no timing informations were available for these events, particular attention has been devoted in order to reject events not perfectly confined in the detector. These goals have been reached also by means of visual scanning with the Event Display. After these selections, we remained with 154 and 262 events for the IU and ID+UGS, corresponding to 5.8 yrs and 5.6 yrs of livetime respectively. In Fig. 5 we show the angular distributions of these two samples and the MC predictions with and without the oscillation hypotheses. A conservative value (25%) of the theoretical uncertainty on the absolute scale is reported. There is a good agreement between data and MC prediction with the oscillation parameters given by the HE sample analysis.
4 CONCLUSIONS
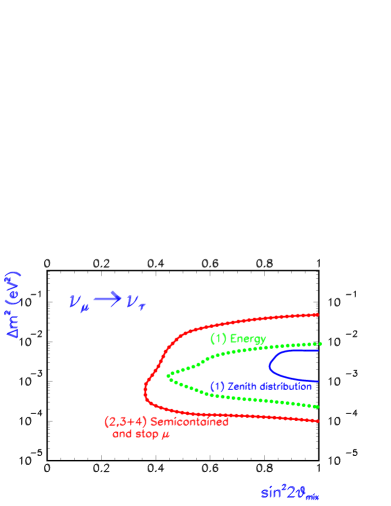
We presented different and independent analyses performed on muon events induced by atmospheric neutrinos. All the analyses are mutually consistent and strongly favour the oscillation hypothesis with maximal mixing and eV2. Absolute flux measurements, shape distributions and energy estimate by MCS were used in order to compute allowed regions in the space of oscillation parameters. This is shown in Fig. 6, where the corresponding contours are computed according to a analysis using the prescriptions of Ref. [12]. A global analysis of all the samples is in progress.
References
- [1] M. Ambrosio et al. (MACRO Coll.), Nucl. Instr. Meth. A486 (2002) 663.
- [2] S. Ahlen et al. (MACRO Coll.), Phys. Lett. B357 (1995) 481; M. Ambrosio et al. (MACRO Coll.), Phys. Lett. B434 (1998) 451.
- [3] M. Ambrosio et al. (MACRO Coll.), Phys. Lett. B478 (2000) 5.
- [4] M. Ambrosio et al. (MACRO Coll.), Astrop. Phys. 9 (1998) 105.
- [5] V. Agrawal et al., Phys. Rev. D53 (1996) 1314.
- [6] M. Gluck et al., Z. Phys. C65 (1995) 433.
- [7] W. Lohmann et al., CERN-EP/85-03 (1985).
- [8] M. Ambrosio et al. (MACRO Coll.), Phys. Lett. B517 (2001) 59.
- [9] D. Bakari et al., Proc. of the NATO Advanced Research Workshop, Oujda, Morocco, 2001.
- [10] M. Ambrosio et al. (MACRO Coll.), physics/0203018.
- [11] E. Scapparone, Proc. of the NATO Advanced Research Workshop, Oujda, Morocco, 2001; M. Sioli (for the MACRO Coll.), Proc. of the 27th ICRC, Hamburg, Germany, 2001.
- [12] G. J. Feldman and R. D. Cousin, Phys. Rev. D57 (1998) 3873.