Direct neutrino mass search
Abstract
With the compelling evidence for massive neutrinos from recent -oscillation experiments, one of the most fundamental tasks of particle physics over the next years will be the determination of the absolute mass scale of neutrinos, which has crucial implications for cosmology, astrophysics and particle physics. Neutrino oscillation experiments can measure squared mass differences but not masses. The latter have to be determined in a different way. The direct mass experiments investigate – besides time-of-flight measurements – the kinematics of weak decays obtaining information on the neutrino mass without further requirements. Here the tritium decay experiments give the most stringent results. The current tritium decay experiments at Mainz and Troitsk are reaching their sensitivity limit. The different options for a next generation direct neutrino mass experiment with sub-eV sensitivity are discussed. The KATRIN experiment, which will investigate the tritium spectrum with a MAC-E-Filter of 1 eV resolution, is being prepared to reach a sub-eV sensitivity.
1 Introduction
Recent experimental results from atmospheric and solar neutrinos give strong evidence that neutrinos oscillate from one flavor state into another. A neutrino of one specific flavor eigenstate is a non-trivial superposition of different neutrino mass states 111Assuming CPT-invariance, here we do not distinguish between masses of neutrinos and the corresponding antineutrinos .. This fact is described by an unitarity mixing matrix
| (1) |
Future oscillation experiments will determine the elements with great precision.
However, –oscillations experiments do not yield the values of the neutrino masses, they are only sensitive to differences between squared neutrino masses 222Neutrino oscillation effects involving matter effects are in principle able to determine the sign of -.. The values from oscillation experiments only give lower limits on neutrino masses
| (2) |
On the other hand, if the absolute value of one mass eigenstate is known, all other neutrino masses can be reconstructed with the help of the differences of the squared neutrino masses, if the signs of the different values are known.
The information on the neutrino mass scale is of crucial importance for particle physics as well as for astrophysics and cosmology. The neutrino mass states can be arranged in a hierarchical way like the charged fermions. This would mean that the different neutrino masses are essentially governed by the square root of . On the other hand the neutrino masses could be quasi-degenerate with about the same value – e.g. a few tenth of an eV – and small mass differences between the different states to explain the oscillation signal. Which neutrino mass scenario 333Of course any neutrino mass scenario in between the hierarchical and the quasi-degenerate pattern would be possible. is right is a very important information in order to find the right theory beyond the Standard Model. Big bang theories predict, that a huge abundance of relic neutrinos of all flavors similar to the photons of the cosmic microwave background radiation (CMBR) exists in the universe. An average neutrino mass of 1 eV would contribute to the energy and matter distribution of the universe by 8 % in units of the critical density Therefore any neutrino mass of this order would contribute significantly to the missing dark matter and would influence the evolution of the universe and its structure formation.
Therefore, information on the neutrino masses can also be deduced from cosmology. Independent information on neutrino masses comes from the measurement of the arrival time distribution of neutrinos emitted in a supernova explosion, the present limit from SN1987a is [1] (see section 2 for the remarks on ).
Direct information on neutrino masses can be obtained by laboratory experiments using two different approaches: the investigation of the decay kinematics of weak decays and the search for neutrinoless double decay. Both methods give complementary information on the neutrino masses .
This paper is organized as follows: Section 2 describes the direct neutrino mass measurements, section 3 concentrates on tritium decay experiments. In section 4 the options for future neutrino mass searches is discussed. The planned next generation tritium decay experiment KATRIN is presented in section 5. Section 6 gives a short summary.
2 Decay Kinematics of Weak Decays
The investigations of the kinematics of weak decays is based on measurements of the charged decay products. Using energy and momentum conservation the missing neutrino mass can be reconstructed from the kinematics of the charged particles. The part of the phase space which is most sensitive to the neutrino mass is the one which corresponds to the emission of a non-relativistic massive neutrino. Therefore decays releasing charged particles with a small free kinetic energy are preferred.
In principle, a kinematical neutrino mass measurement yields information on the different mass eigenstates , since it performs a projection on energy and mass. But usually the different neutrino mass eigenstates cannot be resolved by the experiment. Therefore an average over neutrino mass eigenstates is obtained which is specific for the flavor of the weak decay and hence termed , or , respectively444This average value is not a unique quantity but depends also on how the experiment is analyzed, in particular if it is done under the assumption of a single neutrino mass state. Considering however the small differences of squared masses obtained by neutrino oscillation experiments and comparing them to the experimental resolutions of the present kinematic measurements, this question appears to be of a more academic nature.. This fact will be discussed in more detail for the case of the muon neutrino .
2.1
The muon neutrino mass has been investigated in the two-body decay of a pion at rest:
| (3) |
Energy and momentum conservation result in a sharp muon momentum from which the mass of the muon neutrino would follow as:
| (4) |
Eq. (4) only holds, if the muon neutrino is a well-defined mass eigenstate, which does not apply in the case of neutrino mixing. Hence, if the muon momentum for pion decay at rest could be measured with sufficient precision one would detect three different values with relative fraction corresponding to the measurements of the corresponding squared mass values contributing to the muon neutrino . Up to now no direct neutrino mass measurements has discriminated different neutrino masses or has established a signal for any non-zero neutrino mass.
Therefore on the left part of eq. (4) a mean squared average of mass eigenstates of the muon neutrino is defined as
| (5) |
To deduce from (5) three quantities have to be measured with very high precision: the muon mass MeV [1], the pion mass bMeV [1], MeV, and the muon momentum from pion decay at rest MeV, which has been derived in a dedicated experiment at Paul Scherrer Institute (Zürich) [2]. Putting these values into equation (4) one obtains [2]:
| (6) |
from which an upper limit on the muon neutrino mass can be derived [1]
| (7) |
2.2
The most sensitive information on comes from the investigation of pairs produced at electron-positron colliders decaying into multi pions. Due to the large mass of the , decays into 5 and 6 pions give the highest sensitivity because they restrict the available phase space of the . However, the corresponding branching ratios are rather small.
The quantity looked at is the invariant mass of the multiple pions . Although does not have a direct physical meaning, the mass of the tau neutrino restricts due to energy and momentum conservation. In the rest frame of the decaying lepton, is expressed by:
| (8) | |||||
| (9) |
The most sensitive investigation comes from the ALEPH experiment at LEP. Its two-dimensional analysis in the – plane restricts [3]:
| (10) |
A further improvement based on data from B-factories can be expected with an estimated sensitivity limit of 3 MeV.
Using the most recent results on atmospheric and solar neutrino oscillation (see chapter 5) the neutrino mixing matrix and the squared mass differences suggest that the averages and (compare eq. (5)) are rather close due to the strong - mixing and the very small difference . Therefore is already constrained by the limit on the muon neutrino mass (7).
2.3
The mass of the electron neutrino is determined by the investigation of the electron energy spectrum ( spectrum) of a nuclear decay [4, 5, 6]. In a decay
| (11) |
the available energy is shared between the –electron and the electron antineutrino, because the recoiling nucleus practically receives no kinetic energy due to its much heavier mass. The phase space region of non-relativistic neutrinos, where the highest sensitivity to the neutrino mass is achieved, corresponds to the very upper end of the spectrum. To maximize this part, a emitter with a very low endpoint energy is required. This requirement is fulfilled by 187Re and tritium (T or 3H), which have the two lowest endpoint energies of keV and keV, respectively.
Although tritium has a higher endpoint energy as compared to 187Re its use has several advantages:
-
•
Tritium decays by a super-allowed transition into its mirror nucleus 3He resulting in a half life of 12.3 years, compared to the primordial half life of the forbidden transition of 187Re of a. The short half life yields a high specific activity and minimizes the inelastic processes of electrons within the tritium source.
-
•
Due to the super-allowed decay the transition matrix element does not depend on the electron energy: the spectrum is determined entirely by the available phase space.
-
•
Tritium has the simplest atomic shell minimizing the necessary corrections due to the electronic final states or inelastic scattering in the source.
These arguments clearly favor tritium for standard setup, which consists of a source connected to a spectrometer (sometimes called “passive source” setup). The advantage of the lower 187Re endpoint energy can only be exploited if the source and the spectrometer are identical (sometimes called “active source” setup), which is realized in the case of cryogenic bolometers for instance.
For an allowed or super-allowed transition the electron energy spectrum is given by Fermi’s Golden Rule
| (12) | |||||
with the Fermi coupling constant , the Cabbibo angle , the nuclear transition matrix element (tritium: [4]), the Fermi function describing the final electromagnetic interaction of the emitted electron with the daughter nucleus , the electron mass, momentum and kinetic energy , and , and the energy difference . The Fermi function is approximately given by [5]
| (13) |
with the Sommerfeld parameter . Equation (12) only holds for the decay of a bare nucleus. For the more realistic case of an atom or a molecule the possible excitation of the electron shell due to the sudden change of the nuclear charge by one unit has to be taken into account. The atom or molecule will end in a specific state of excitation energy Vj with a probability Wj. The corresponding excitation probabilities can be calculated in the sudden approximation from the overlap of the primary electron wave function with the wave functions of the daughter ion
| (14) |
Equation (12) is thus modified into a sum of spectra of amplitude Wj with different endpoint energies
| (15) | |||||
The energy differences are then defined as .
In case of neutrino mixing the spectrum is a sum of the components of decays into mass eigenstates
| (16) | |||||
When this spectrum is convoluted with an experimental resolution function which is much wider than the mass difference (which has always been the case so far), the resulting spectrum can be analyzed in terms of a single mean squared electron neutrino mass
| (17) |
and eq. (15) applies again.
The square root term of equation (12) shows that the neutrino mass influences the spectrum only at the upper end below and its relative influence is vanishing as function of (see figure 1) leading far below the endpoint to a small constant offset proportional to .
Figure 1 defines the requirements of a direct neutrino mass experiments which investigates a spectrum : The task is to resolve the tiny change of the spectral shape due to the neutrino mass in the region just below the endpoint , where the count rate is going to vanish. Therefore, high energy resolution is required combined with large source strength and acceptance as well as low background rate.

3 Tritium Decay Experiments

3.1 Overview
The majority of the published direct laboratory results on originates from the investigation of tritium decay, while one single result from 187Re has been reported at conferences 555There are also results from investigations of electron capture [19] and bound state decay [20], which are about 2 orders of magnitude less stringent on the neutrino mass.. In the early nineties tritium decay experiments yielded controversially discussed results: Figure 2 shows the final results of the experiments at Los Alamos National Laboratory and Zürich together with the results from other more recent measurements with magnetic spectrometers at University of Tokio, Lawrence Livermore National Laboratory and at Bejing. The sensitivity on the neutrino mass have improved a lot compared to previous experiments but the values for the observable populated the unphysical negative region. In the case of two experiments significantly negative mass results were obtained. In 1991 and 1994 two new experiments started data taking at Mainz and at Troitsk, which used a new type of electrostatic spectrometer, so-called MAC-E-Filters, which were again superior in energy resolution and luminosity with respect to the previous magnetic spectrometers. However, even their early data were confirming the large negative values of the Los Alamos and Livermore experiments when being analyzed over the last 500 eV of the spectrum below the endpoint . Also a new feature was observed. The large negative values of disappeared when analyzing only small intervals below the endpoint (see also figure 6). This effect, which could only be investigated by the high-resolution MAC-E filters, pointed towards an underestimated or missing energy loss process, seemingly to be present in all experiments. The only common feature of the various experiment seemed to be the calculations of the excitation energies of the daughter ions and their probabilities . Different theory groups checked these calculations in detail. The expansion was calculated to one order further and new interesting insight into this problem was obtained, but no significant changes were found (see [21] and references therein).
Then the Mainz group found the origin of the missing energy loss process for its experiment. The Mainz experiment uses as tritium source a film of molecular tritium quench-condensed onto aluminum or graphite substrates. Although the film was prepared as a homogenous thin film with flat surface, detailed studies showed that the film undergoes a temperature activated roughening transition into an inhomogeneous film by formation of microcrystals leading to unexpected large inelastic scattering probabilities.
The Troitsk experiment on the other hand uses a windowless gaseous molecular tritium source, similar to the Los Alamos apparatus. Here, the influence of large angle scattering of electrons magnetically trapped in the tritium source was not considered in the first analysis. The Troitsk group stated, that if this effect is taken into account it gives a correction large enough to make the negative values for disappear.
It is very likely that also for the experiments at Los Alamos and Livermore other experimental effects caused the negative values for . Any missed or underestimated experimental correction leads to a negative value for . This can be understood by the following consideration: for , eq. (12) can be expanded into
| (18) |
On the other hand the convolution of a spectrum (12) with a Gaussian of width leads to
| (19) |
Therefore, in the presence of a missed experimental broadening with Gaussian width one expects a shift of the result on of
| (20) |
which gives rise to a negative value of .
3.2 MAC-E-Filter
The significant improvement in the –mass sensitivity by the Troitsk and the Mainz experiments are due to MAC-E-Filters. This new type of spectrometer is based on early work by Kruit [22] and was later redeveloped for the application to the tritium decay at Mainz and Troitsk independently [23, 24]. The MAC-E-Filter combines high luminosity at low background and a high energy resolution. Both features are essential to measure the neutrino mass from the endpoint region of a decay spectrum. The acronym MAC-E-Filter stands for Magnetic Adiabatic Collimation followed by an Electrostatic Filter.

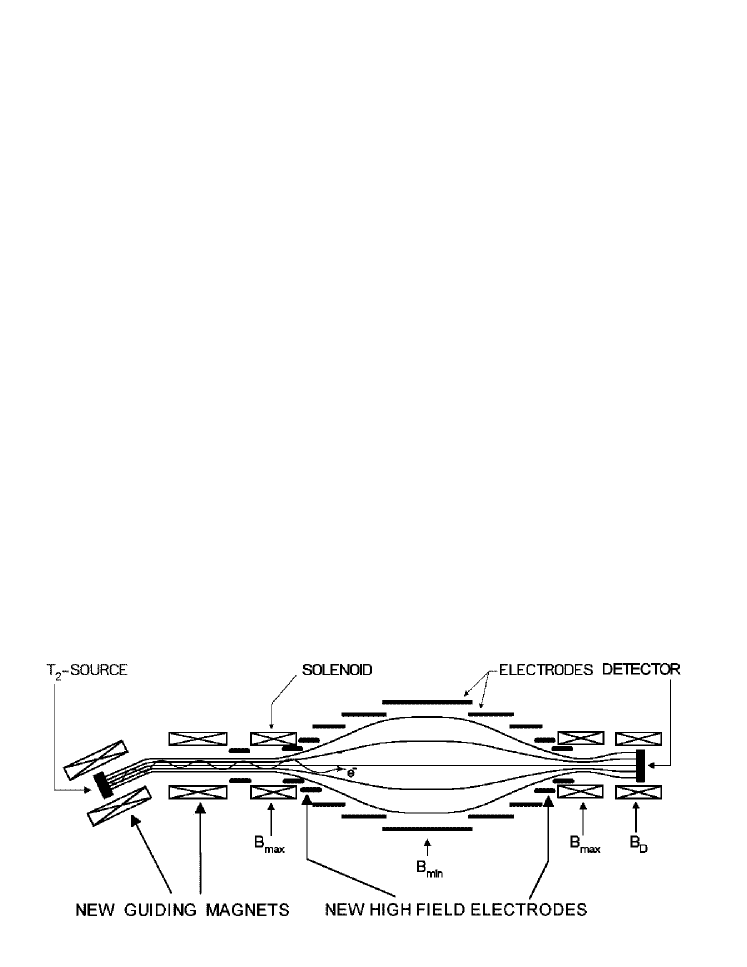
The main features of the MAC-E-Filter are illustrated in figure 3: two superconducting solenoids are producing a magnetic guiding field. The electrons, which are starting from the tritium source in the left solenoid into the forward hemisphere, are guided magnetically on a cyclotron motion along the magnetic field lines into the spectrometer, thus resulting in an accepted solid angle of nearly . On their way into the center of the spectrometer the magnetic field drops by several orders of magnitude. Therefore, the magnetic gradient force transforms most of the cyclotron energy into longitudinal motion. This is illustrated in figure 3 at the bottom by a momentum vector. Due to the slowly varying magnetic field the momentum transforms adiabatically keeping the magnetic moment constant (equation given in non-relativistic approximation):
| (21) |
This transformation can be summarized as follows: the electrons, isotropically emitted at the source, are transformed into a broad beam of electrons flying almost parallel to the magnetic field lines.
This parallel beam of electrons is energetically analyzed by applying an electrostatic potential made up by a system of cylindrical electrodes. All electrons, which have enough energy to pass the electrostatic barrier are reaccelerated and collimated onto a detector, all other electrons are reflected. Therefore the spectrometer acts as an integrating high-energy pass filter. The relative sharpness of this filter is only given by the ratio of the minimum magnetic field in the analyzing plane in the middle and the maximum magnetic field between electron source and spectrometer :
| (22) |
By scanning the electrostatic retarding potential the spectrum can be measured.
Both experiments at Mainz and Troitsk are using similar MAC-E-Filters, which differ slightly in size: The diameter and length of the Mainz(Troitsk) spectrometer are 1 m (1.5 m) and 4 m (7 m). The major differences between the two setups are the tritium sources.
3.3 The Troitsk Neutrino Mass Experiment
The windowless gaseous tritium source of the Troitsk experiment [17] is essentially a tube of 5 cm diameter filled with resulting in a column density of molecules. The source is connected to the ultrahigh vacuum of the spectrometer by a series a differential pumping stations.
From their first measurement in 1994 on the Troitsk group reported the observation of a small, but significant anomaly in their experimental spectrum starting a few eV below the endpoint . This anomaly appears as a sharp step of the count rate [16]. Since a MAC-E-Filter is integrating, this step should correspond to a narrow line in the primary spectrum with a relative intensity of about of the total decay rate. In 1998 the Troitsk group reported that the position of this line oscillates with a frequency of 0.5 years between 5 eV and 15 eV below [17]. In 2000 the anomaly did not follow the 0.5 year periodicity anymore but still existed [25]. In total the Troitsk experiment has taken 200 days of tritium data, in almost all of the runs this anomaly has been observed.
The reason for such an anomaly with these features is not clear. Detailed investigations at Troitsk are continuing. In addition synchronous measurements with the Mainz experiment were performed. In 2001 the Troitsk group improved the differential pumping between the gaseous tritium source and the spectrometer, lowered the electric field strength in a critical region and improved the vacuum. The first two runs of 2001 either gave no indication for an anomaly or only showed a small effect with 2.5 mHz amplitude if compared to the previous ones with amplitudes between 2.5 mHz and 13 mHz. These findings also support the assumption that the Troitsk anomaly is due to an still unknown experimental artefact [26].
Fitting a standard spectrum to the data the Troitsk group obtained
significantly negative values of of -10 to -20 (see filled circle in fig. 2). Describing the
anomaly phenomenologically by adding a monoenergetic line, free in
amplitude and position, to a standard spectrum results in values of
compatible to zero [17] (see also open
circles in fig. 2). After this correction the
average over all runs until 2001 amounts to
[26]:
| (23) |
which corresponds - under the assumption that the run-by-run correction by an additional line is correct - to an upper limit [26] of
| (24) |
3.4 The Mainz Neutrino Mass Experiment
Mainz uses a film of molecular tritium quench-condensed onto a graphite substrate (HOPG). The film has a diameter of 17 mm and a typical thickness of 40 nm, which is measured by laser ellipsometry. The problem of the roughening transitions mentioned above have been investigated by the Mainz group in cooperation with the condensed matter group of P. Leiderer at Konstanz/Germany using conversion electron spectroscopy and scattered light techniques on different hydrogen isotopes [27, 28]. The following results were obtained: The roughening transition follows an Arrhenius-type law. Thus it cannot be avoided but its speed can drastically be slowed down by using lower temperatures. A film at 2 K has a time constant of order 10 y [28], i.e. much longer than a typical duration of a measurement.
In the years 1995-1997 the Mainz setup was upgraded by a new cryostat providing temperatures of the tritium film below 2 K to avoid the roughening transition. Also a new tilted pair of superconducting solenoids was installed (see figure 4). Consequently particles from the source are still guided magnetically into the spectrometer, whereas tritium molecules evaporating from the source are trapped on the bend of the LHe cold tube covered with graphite. This measure eliminated source correlated background and allowed to increase the source strength significantly. The upgrade of the Mainz setup was completed by the application of HF pulses on one of the electrodes in between measurements every 20 s, and a full automation of the apparatus and remote control. The former improvement lowers and stabilizes the background, the latter one allows long–term measurements.

Figure 5 shows the endpoint region of the Mainz 1998 and 1999 data [15] in comparison with the former Mainz 1994 data [13]. An improvement of the signal-to-background ratio by a factor 10 as well as a significant enhancement of the statistical quality of the data is clearly visible. A fit with fixed to zero perfectly fits the latter data set over these last 15 eV of the spectrum. This limits any persistent spectral anomaly in this range to an amplitude below /s (as against a total flux of /s entering the spectrometer). A spectral anomaly, like the fluctuating anomaly reported by the Troitsk group [16, 17], on the other hand, reaches amplitudes up to /s.
The main systematic uncertainties of the Mainz experiment are originating from the physics and the properties of the quench-condensed tritium film: the inelastic scattering of electrons within the tritium film, the excitation of neighbor molecules due to the decay, and the self-charging of the tritium film by radioactivity.
These systematic uncertainties were studied in detail by various investigations [29, 30, 31] and the knowledge of the corresponding corrections could be significantly improved.

Figure 6 shows the fit results of the combined Mainz 1998 and 1999 data on as function of the lower limit of the fit interval. The monotonous trend towards negative values of for larger fit intervals, as observed for the Mainz 1991 and 1994 data [12, 13], has vanished. This shows that the dewetting of the film from the graphite substrate [27, 28] indeed was the reason for this behavior. Now this effect is safely suppressed at the much lower temperature of the film. The data do not show any indication for other residual distortions. The energy interval below the endpoint, yielding the smallest combined statistical and systematical uncertainty on the neutrino mass is obtained, corresponds to the last 70 eV below the endpoint and gives [15]
| (25) |
which is compatible with a zero neutrino mass. Considering its uncertainties, this value corresponds to an upper limit on the electron neutrino mass of [15]:
| (26) |
Further data have been taken at Mainz in 2000, but suffering from background problems At the end of 2001 the Mainz group started another 3 month measurement campaign. A very careful maintenance and preparation of the whole setup was done. Especially all parts which needs refreshment from time to time were replaced. These were components related to the tritium source, the vacuum and the high voltage system (e.g. the graphite substrate, out-baking of all vacuum systems and re-activation of the non-evaporable getter pumps, the oil of the high voltage divider, and others). To check the various scanning hysteresis effects, different scanning methods were tested, including a 50 times slower scanning procedure. The summary of all these investigations is: the Mainz experiment has achieved its most stable operation ever in these two runs of 2001 – no scanning direction effect was observed anymore. The background rate was about 13 mHz, lower than before and much more stable without the need of repeating high voltage conditioning during a run (see fig. 5).

The neutrino squared masses obtained from the fit are very stable and compatible with zero within their uncertainties and the previous Mainz results (see figure 7). No indication of a Troitsk-like anomaly or any residual problem in the Mainz data were found. The result for the 2001 data of the last 70 eV of the spectrum below the endpoint (Elow=18.5 keV, see fig. 7) on is [32]:
| (27) |
Combining this value with the one obtained from the data sets Q5–Q8 from 1998 and 1999 over the last 70 eV (25) [15] gives
| (28) |
which corresponds again to an upper limit [32, 26] of
| (29) |
The inclusion of the high-quality data from 2001 improves the Mainz sensitivity only marginally, showing that the Mainz experiment has reached its sensitivity limit.
In spring 2002 the Mainz group has installed a new electrode system to check new ideas which were deloped for the KATRIN experiment to avoid background and to remove trapped particles [33]. First measurements showed that the new ideas indeed are reducing the background rate by a factor 3.
Indications for a “Troitsk-like” anomaly at Mainz were observed only once in summer 1998. This single coincidence did not appear in previous and later runs [14]. Of special interest are the Mainz 2000 runs, although they were done under less favored conditions. In particular, part of the data have been taken in parallel with Troitsk. Whereas Troitsk again has indications for the anomaly [25] at Mainz no indication for a Troitsk-like anomaly was found [34]. In summary, the Mainz data clearly state that the anomaly observed at Troitsk is caused by some experimental artefact [26].
4 Future direct neutrino mass searches
As briefly discussed in section 1 the compelling evidence for non-zero neutrino masses from atmospheric and solar neutrino experiments provides squared neutrino mass differences but no absolute neutrino masses. These findings clearly demand for the determination of the absolute neutrino mass scale as one of the most important next steps in neutrino physics since the absolute neutrino mass has strong consequences for astrophysics and cosmology as well as for nuclear and particle physics as discussed in section 1.
There exist different ideas and approaches to determine the absolute neutrino mass with sub-eV sensitivity, which will be briefly discussed in the following:
-
•
Time-of-flight of supernova neutrinos
The spread of the arrival time of supernova neutrinos on earth depends on neutrino energy and mass, thus allowing to extract the neutrino mass by measuring arrival time and energy. A supernova, exploding within our galaxy, would give hundreds to thousand of neutrino events in the current underground neutrino detectors. Although this would exceed the statistics of the only supernova SN1987a observed so far by two orders of magnitude, the systematic uncertainty connected with the not precisely known neutrino emission time spectrum does not allow a sub-eV sensitivity on the neutrino mass. -
•
Large scale structure
The observation of the structure in the universe at different scales and the angular distribution of the fluctuations of the cosmic microwave background radiation allows to set constraints on the hot dark matter content of the early universe [35]. The relic neutrino density connects this hot dark matter density to the neutrino mass. Although the expected sensitivity on the neutrino mass for the near future is in the sub-eV range, the results derived this way are never model independent. Reversing the arguements, there are strong degeneracies between the different parameters and its therefore very helpful to use information from laboratory neutrino mass experiments to determine the other astrophysics parameters more precisely. -
•
Neutrinoless double decay
The neutrinoless double decay is sensitive to the so-called “effective” neutrino mass(30) which is a coherent sum over all mass eigenstates contributing to the electron neutrino with fraction . The determination of from the measurement of the neutrinoless double decay rate is complementary to the direct determination of the mass of the electron neutrino since and can differ by the following reasons:
-
1.
Double decay requires the neutrino to be a Majorana particle.
- 2.
-
3.
The uncertainty of the nuclear matrix elements of neutrinoless double decay still contributes to the uncertainty of by about a factor of 2 .
-
4.
Non Standard Model processes, others than the exchange of a Majorana neutrino, could enhance the observed neutrinoless double decay rate without changing .
The lowest limit of eV is coming from the Heidelberg-Moscow experiment using an array of semiconductor detectors of enriched 76Ge [42]. Very recently part of the collaboration interpreted the data as a signal for neutrinoless double decay [43], a claim which raised discussions within the community. Not only to check this, but also for the reasons given above double decay experiments with much enhanced sensitivity are clearly needed. The proposed double decay experiments of the next generation aim for a sensitivity on in the range of 0.1 eV and below [44].
-
1.
-
•
Rhenium cryogenic bolometer experiments
Due to the complicated electronic structure of 187Re and its decay (compare to section 2.3) the advantage of the 7 times lower endpoint energy of 187Re with respect to tritium can only be exploited if the spectrometer measures the entire released energy, except that of the neutrino. This situation can be realized by using a cryogenic bolometer as the spectrometer, which at the same time contains the emitter 187Re (see figure 8).One disadvantage connected to this method is the fact that one measures always the entire spectrum. Even for the case of the very low endpoint energy of 187Re, the relative fraction of events in the last eV below is of order only (compare to figure 1). Considering the long time constant of signal of a cryogenic bolometer (typically several hundred s) only large arrays of cryogenic bolometers can deliver the signal rate needed.
Up to now two groups are working on 187Re decay experiments at Milano [37] and Genoa [38]. Although cryogenic bolometers with an energy resolution of 5 eV have been produced with other absorbers, this has yet not been reached for rhenium. The two groups are using different ways to produce the crystals. The MANU2 experiment at Genoa succeeded in preparing crystals from metallic rhenium. The group has reported a limit on of 26 [39]. The Genoa group understands their measured spectra well and has seen for the first time the oscillation pattern of the environmental fine structure [40], which describes the interference between the coherent scattered outgoing electron wave function with the crystal similar to the X-ray environmental fine structure (XEFS) known for X-ray absorption edges. The Genoa group expects in the near future a sensitivity on of 10 . A significant further improvement could be obtained by improving the energy resolution of the crystals by using new super-conducting transition thermometers. The MiBeta experiment of Milano uses AgReO4 crystals with a typical energy resolution of 35 eV. There is no result on yet, the expected sensitivity is similar to the one for the Genoa experiment.

Figure 8: Principle scheme of a cryogenic bolometer for direct neutrino mass measurements consisting of a emitting crystal, which serves at the same time the particle and energy absorber: The energy release gives rise to a temperature increase via the heat capacity C, which is measured by a thermometer. The electric read-out wires of the thermometer link the whole bolometer to a thermal bath. To further improve the statistical accuracy the operation of large arrays of micro-calorimeters with better resolution is required. New techniques are explored to enable these improvements. The expected sensitivity on the neutrino mass in the future is in the eV region [39].
-
•
Next generation tritium decay experiment
Summarizing the discussion above clearly means that one or more next generation double decay experiments have to be performed due to their very low sensitivity. But considering the complementariness of neutrinoless double decay and the direct neutrino mass determination it is also clear that a next generation direct mass search has to be done. None of the alternative direct methods discussed above is able to provide a sub-eV sensitivity in the next decade. Therefore, it is straightforward to explore which sensitivity could be achieved by investigating the tritium decay spectrum near its endpoint with the very successful MAC-E-Filter as spectrometer.Discussions between groups from Mainz, Karlsruhe and Troitsk led to the proposal for a next generation tritium decay experiment to be built at Forschungszentrum Karlsruhe/Germany. This idea was strongly supported by the community at the international workshop on “Neutrino masses in the sub-eV range” at Bad Liebenzell/Germany in early 2001 [41]. A strong collaboration including nearly the complete worldwide expertise on tritium decay neutrino mass experiments has come together and a letter of intent for the KATRIN experiment (KArlsruhe TRItium Neutrino experiment) has been published [45]. First funding for KATRIN has been obtained. This experiment will be described in the next section in more detail.
5 The KATRIN experiment
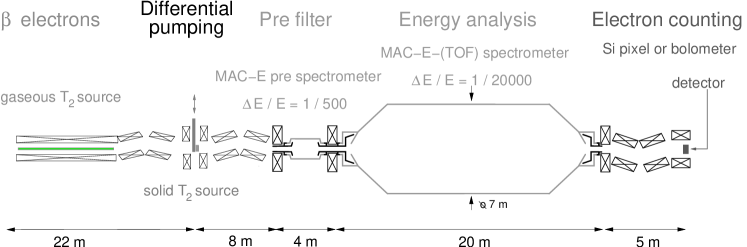
Figure 9) shows a schematic view of the proposed experimental configuration.
The windowless gaseous tritium source (WGTS) allows the measurement of the endpoint region of the tritium decay and consequently the determination of the neutrino mass with a minimum of systematic uncertainties from the tritium source. The WGTS will consist of a 10 m long cylindrical tube of 70 mm diameter, filled with molecular tritium gas of high isotopic purity ( %). The tritium gas will be injected by a capillary at the middle of the tube and then diffuses over a length of 5 m to both end faces of the tube, resulting in a source column density of about molecules/cm2. This gives a near to maximum count rate at the endpoint666One has to keep in mind, that increasing the source column density further almost does not increase the count rate near the endpoint, since inelastic scattering of electrons on tritium molecules has a threshold of about 12 eV [29]. Any inelastically scattered electron cannot contribute to the count rate in the interesting region of the last 12 eV below the endpoint .. With these values the count rate is increased by factor 40 with respect to the Troitsk experiment.
A quench condensed tritium source (QCTS) following the source concept of the Mainz experiment is considered as a second alternative source, which has complementary systematics.
The electron transport system adiabatically guides decay electrons from the tritium sources to the spectrometer while at the same time eliminating any tritium flow towards the spectrometer, which has to be kept practically free of tritium for background reasons. The first part of the transport system consists of a differential pumping section with a tritium reduction of a factor , the second part of a liquid helium cold cryo-trapping section.
Between the tritium sources and the main spectrometer a pre-spectrometer of MAC-E-Filter type will be inserted, acting as an energy pre-filter to reject all electrons except the ones in the region of interest close to the endpoint . This minimizes the chances of causing background by ionization of residual gas in the main spectrometer. As the designs of the pre- and main spectrometer will be similar, the former will act as a test facility for the larger main spectrometer [46]. The design and construction of the pre-spectrometer has already started. Especially important will be the following tests of : a) the technique to achieve an XUHV of below mbar, b) the concept of using the vacuum vessel itself as main electrode at high potential, and c) the new electromagnetic design concepts to reduce background.
A key component of the new experiment will be the large electrostatic main spectrometer with a diameter of 7 m and an overall length of about 20 m. This high resolution MAC-E-Filter will allow to scan the tritium decay endpoint with increased luminosity at a resolution of 1 eV, which is a factor of 4 better than present MAC-E-Filters at Mainz and Troitsk. The 100 times larger analyzing plane with respect to the Mainz experiment allows the remaining factor 25 to be utilized to increase the source cross section and, correspondingly, the signal rate.
The detector requires high efficiency for electrons at keV and low background. A high energy resolution of eV for 18.6 keV electrons should suppress background events at different energies. The present concept of the detector is based on a large array of about 1000 silicon drift detectors surrounded by low-level passive shielding and an active veto counter to reduce background. For a later stage of the experiment a segmented bolometer is considered as a possible detector.
The difficulty in measuring a sub eV neutrino mass concerning the statistics, namely the smallness of the interesting region below the endpoint, turns into an advantage with respect to the systematic uncertainties due to energy thresholds for inelastic processes. First simulations with conservative assumptions result in a total 1 uncertainty of eV2 for a measurement time of three years. If no finite neutrino mass is observed, the three year measurement leads to an upper limit of the mass of 0.35 eV at 90% confidence. This sensitivity improves the existing limits by almost one order of magnitude and also demonstrates the discovery potential of KATRIN for an electron neutrino mass in the sub-eV range.
6 Summary
Although neutrino oscillation experiments show that neutrinos have non-zero masses, the direct neutrino mass experiments have obtained only upper limits yet. The current tritium decay experiments at Mainz and Troitsk are reaching their sensitivity limits. The Mainz upper limit on is 2.2 eV at 95 % C.L. The Troitsk group gives the same limit under the assumption that an anomalous excess count rate near the endpoint is described correctly. The synchronous measurements at Mainz and Troitsk show that this “Troitsk anomaly” is an experimental artefact.
A mass determination with sub-eV sensitivity is clearly needed to distinguish between hierarchical and degenerate neutrino mass models and to clarify the role of neutrinos in the early universe. The search for the neutrinoless double decay is one very important approach. Complementary and equally important is a next generation direct neutrino mass experiment. Discussing the different options shows that this experiment has to be a large tritium decay experiment using a MAC-E-Filter. Such an experiment is being prepared by the KATRIN collaboration.
Acknowledgments
The author would like to thank the various collaborations for providing him kindly the presented informations and results. Especially acknowledged are the valuable remarks by J. Bonn, G. Drexlin, Ch. Kraus and E. Otten. The work of the Mainz and the KATRIN experiments connected to the author is supported by the German Bundesministerium für Bildung und Forschung under contracts 06MZ866I/5 and 05CK2PD1/5.
References
- [1] K. Hagiwara et al. (Particle Data Group), Phys. Rev. D66 (2002) 010001
- [2] K. Assamagan et al., Phys. Rev. D53 (1996) 6065
- [3] R. Barate et al. Eur. Phys. J. C2 (1998) 3
- [4] R.G.H. Robertson, D.A. Knapp, Ann. Rev. Nucl. Sci. 38 (1988) 185
- [5] E. Holzschuh, Rep. Prog. Phys. 55 (1992) 1035-1091
- [6] J.F. Wilerson and R.G.H. Robertson in “Current Aspects Of Neutrino Physics,”, edited by D. O. Caldwell, Berlin, Germany: Springer (2001)
- [7] R.G.H. Robertson et al., Phys. Rev. Lett. 67 (1991) 957
- [8] E. Holzschuh et al., Phys. Lett. B287 (1992) 381
- [9] H. Kawakami et al., Phys. Lett. B256 (1991) 105
- [10] H.C. Sun et al., CJNP 15 (1993) 261
- [11] W. Stoeffl, D.J. Decman, Phys. Rev. Lett. 75 (1995) 3237
- [12] Ch. Weinheimer et al., Phys. Lett. B300 (1993) 210
- [13] H. Backe et al., Proc. of Neutrino 96, Helsinki/Finland, June 1996, World Scientific/Singapure
- [14] C. Weinheimer et al., Phys. Lett. B460 (1999) 219
- [15] J. Bonn et al.,Nucl. Phys. B (Proc. Suppl.) 91 (2001), 273
- [16] A.I. Belesev et al., Phys. Lett. B350 (1995) 263
- [17] V.M. Lobashev et al., Phys. Lett. B460 (1999) 227
- [18] V.M. Lobashev et al., Nucl. Phys. B (Proc. Suppl.) 91 (2000) 280
- [19] S. Yasumi et al., Phys. Lett. B 334 (1994) 229
- [20] M. Jung et al., Phys. Rev. Lett. 69 (1992) 2164.
- [21] A. Saenz et al., Phys. Rev. Lett. 84 (2000) 242
- [22] P. Kruit and F.H. Read, J. Phys. E16 (1983) 313
- [23] A. Picard et al., Nucl. Inst. Meth. B63 (1992) 345
- [24] V.M. Lobashev, Nucl. Inst. and Meth. A240 (1985) 305
- [25] V.M. Lobashev, Prog. Part. Nucl. Phys. 48 (2002) 123
- [26] Ch. Weinheimer, talk at Int. Conf. on Neutrino Physics and Astrophysics, Munich/Germany, June 2002, proc. in print
- [27] L. Fleischmann et al., J. Low Temp. Phys. 119 (2000) 615
- [28] L. Fleischmann et al., Eur. Phys. J. B16 (2000) 521
- [29] V.N. Aseev et al., Eur. Phys. J. D10 (2000) 39
- [30] H. Barth et al., Prog. Part. Nucl. Phys. 40 (1998) 353
- [31] B. Bornschein, PhD thesis, Mainz University, 2000, submitted to J. Low. Temp. Phys.
- [32] Ch. Kraus et al., poster at Int. Conf. on Neutrino Physics and Astrophysics, Munich/Germany, June 2002, proc. in print
- [33] B. Müller, Th. Thümmler et al., poster at Int. Conf. on Neutrino Physics and Astrophysics, Munich/Germany, June 2002, proc. in print
- [34] J. Bonn et al., Prog. Part. Nucl. Phys. 48 (2002) 113
- [35] S. Hannestad, talk at Int. Conf. on Neutrino Physics and Astrophysics, Munich/Germany, June 2002, proc. in print
- [36] Y. Farzan, O.L.G. Peres, A. Yu. Smirnov, Nucl. Phys. B 612 (2001) 59
- [37] A. Nucciotti et al., Nucl. Instr. Meth. A 444 (2000) 77
- [38] M. Galeazzi et al., Phys. Rev. C 63 (2001) 014302
- [39] F. Gatti, Physics B (Proc. Suppl.) 91 (2001) 293
- [40] F. Gatti et al., Nature 397 (1999) 137
-
[41]
Int. Workshop,
Bad Liebenzell/Germany,
January 2001,
http://www-ik1.fzk.de/tritium/liebenzell - [42] H. V. Klapdor-Kleingrothaus et al., Eur. Phys. J. A 12 (2001) 147.
- [43] H. V. Klapdor-Kleingrothaus, A. Dietz, H. L. Harney and I. V. Krivosheina [Heidelberg-Moscow Collaborations], Mod. Phys. Lett. A 16 (2001) 2409 [arXiv:hep-ph/0201231].
- [44] S.R. Elliott and P. Vogel, Annu. Rev. Nucl. Part. Sci. 52 (2002), hep-ph/0202264
- [45] A. Osipowicz et al., hep-ex/0109033
- [46] B. Flatt and J. Wolf, poster at Int. Conf. on Neutrino Physics and Astrophysics, Munich/Germany, June 2002, proc. in print