Edward I. Shibata
representing the CLEO Collaboration.
Department of Physics, Purdue
University,
West Lafayette, Indiana 47907-2036, United States of America
Abstract
A model-dependent analysis of the hadronic substructure in decay is reported. The decay is
dominated by the process
in which in an -wave
decay. Amplitudes involving decays into isoscalars,
especially are large. decays
via the pseudoscalar are small. These results
support the resonant substructure reported in the previously reported
analysis of decay mode from the
same CLEO II data sample.
1 INTRODUCTION
The decay has been the subject of much interest
over the years. Because of the transformation properties of the weak current under
parity and -parity, -lepton decay to an odd number of pions is expected to occur
exclusively through the axial vector current, ignoring isospin-violating effects.
Since and are good quantum numbers of the hadronic current from weak decays,
the weak axial current produces systems of pions with or
odd -parity and odd numbers of pions.
The system in is expected to
be produced dominantly through the poorly understood where
in an -wave decay. Although it is possible that
the system can be produced through the
this is expected to be suppressed by the PCAC (partially conserved axial current) hypothesis.
It has been known for some time that simple models do not provide a
satisfactory description. For example, ARGUS [1] found that the model of
Kühn and Santamaria [2] and that of Isgur, Morningstar, and Reader [3]
did not describe their data satisfactorily.
Here we report the preliminary results of a model-dependent fit of the substructure in decays. The work is based on the analysis of
events [4].
In addition to fitting the substructure with various decay modes, fits
for the production of the system via the
are included.
These results are compared to the substructure
in previously reported [5].
Throughout this paper the charge conjugate versions of decays
are implied for brevity and clarity.
2 EVENT SELECTION
This analysis is based on 4.67 fb-1 of colliding beam data collected at
center-of-mass energy energies GeV with the CLEO II detector at the
Cornell Electron Storage Ring (CESR). This corresponds to
events.
events are selected from a topology in which the
decays into a single charged particle plus a and the decays into
three charged particles plus a (1 versus 3 charged-particle topology). Selected events are
required to have four well-constructed charged tracks coming from the interaction region, and the net
charge of the tracks is required to be zero.
No more than one track is allowed to be identified as an or
The most isolated track is identified, and the remaining three tracks are required
to be
away from it.
Events with photons (isolated electromagnetic showers not associated with a track) are rejected.
Events that satisfy the hypothesis GeV are rejected in order
to eliminate events containing decays.
Finally, the 2-dimensional cut shown in Figure 1 is used to reject events with missing tracks
and/or energy along the beam pipe. Application of these cuts yields
145,000 events.
Figure 1: vs. for experimental data (left) and Monte Carlo
-events (right), where is the missing energy and is
the missing transverse momentum in an event. This
2-dimensional cut is used to reject events with missing tracks and/or energy along the beam axis.
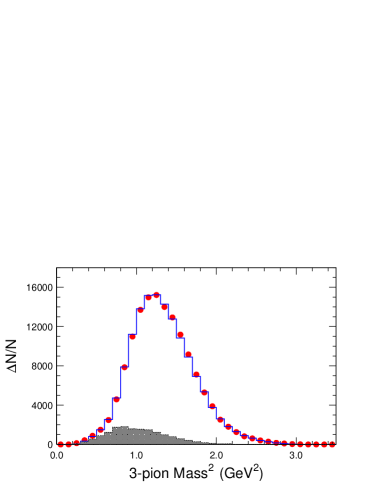
The effective mass spectrum resulting from these cuts is shown in
Figure 2. The background, indicated by the shaded histogram,
which amounts to about 11% of the events
in the spectrum. Monte Carlo studies show that this background is from other
-decays: comes from -events with missing (’s) and
is from -events with charged Monte Carlo studies
indicate that backgrounds from multihadronic events, events,
and QED events are
negligible.
Figure 2: effective mass spectrum. The circles
are the experimental data and
the histogram is the spectrum resulting from fitting the
data sample as described in the text. The shaded histogram is the background from other
decays.
3 FIT
Table 1: Masses and widths of the resonances used in the fits to and decays.
For comparison the current Particle Data Group [6] masses and widths are listed.
Particle
M (GeV)
(GeV)
(GeV)
(GeV)
1.230
0.400
0.25–0.60
1.300
0.300
0.2–0.6
0.774
0.149
1.370
0.386
1.275
0.185
0.860
0.880
0.4–1.2
0.6–1.0
1.186
0.350
1.2–1.5
0.2–0.5
Although it is desirable to characterize the structure of the system
without model-dependent assumptions, this is very difficult in practice. In a model-independent
approach one would assume a general form of the hadronic current that allows the separation
and analysis of the complex magnitudes of the axial vector and pseudoscalar components
in bins of and where is the invariant mass-squared of the
system, is the invariant mass-squared of the combination that yields the larger value
of mass-squared,
and is the invariant mass-squared of the other combination. There would be
no assumptions regarding resonances in the decay. However, in certain chiral limits,
scalar effects can be induced in the current from the and non-resonant
contributions in the current and thus fake pseudoscalar effects [8]. Secondly,
simply binning in three dimensions is problematical: relatively small bins are
required to study the decay structure and this leads to some bins with
low statistics that may be crucial in resolving complicated resonance structure.
By using a model-dependent fit, one can make reasonable assumptions about
the resonant structure and study the likely existence of each resonance modeled while using the entire
dataset in the fitting and without the need for binning.
Using an unbinned maximum likelihood fit, the substructure in decays has been fit with the set of resonances given in Table 1.
For comparison purposes, the current Particle Data Group [6] masses and widths are
listed. For the
and resonance parameters given by
the Törnqvist unitarized quark model [7] have been used.
The same resonances and parameters have been used in the analysis of events
[5] selected from the same CLEO II set of events.
4 RESULTS
The results of the
fit are given in Table 3, where
the are complex coupling constants.
The invariant mass spectrum resulting from
the fit is shown as the histogram in Figure 2.
As expected, the
-wave decay dominates. There is a significant amount of -wave
decay into isoscalars [ ] plus a pion. -decay
via the pseudoscalar is small, although its inclusion improves
the fit. Dalitz plots for sequential invariant mass regions
are shown in Figure 3 for data and the fit.
Table 2: Preliminary results based on
events. The uncertainties are statistical only. The branching fractions do not sum to 100% due to
interferences among the amplitudes. The phases are relative to the dominant
-wave decay.
Branching fraction (%)
e()
m()
-wave
69.77
1.00
0.0
-wave
-wave
-wave
-wave
-wave
-wave
-wave
-wave
-wave
Table 3: Results for the substructure fit to lepton-tagged events from the same CLEO II dataset.
The branching fractions do not sum to 100% due to
interferences among the amplitudes.
Significance
Branching fraction (%)
phase
-wave
–
-wave
-wave
-wave
-wave
-wave
-wave
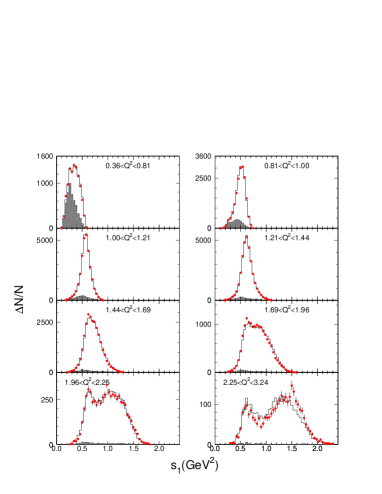
The isoscalar sub-resonances in the decay of the [
and ] play a large role in the fits. To demonstrate the need for these isoscalars,
the data were fitted without them. Projections of the Dalitz plat without the presence of these
isoscalars are shown in Figures 6 and 7.
For the projection onto the axis
(Figure 6), the lack of all three isoscalars
results in a poor fit for GeV
For the projection onto the axis (Figure 7), the presence of is needed
for all regions of
especially those of lower values.
These results support the resonance substructure previously reported for the
CLEO II [5] data, which are
based on
lepton-tagged events. The fit results on these events are
given in Table 3 for the reader’s convenience. Both analyses find that
axial vector amplitudes with isoscalars, especially
are large.
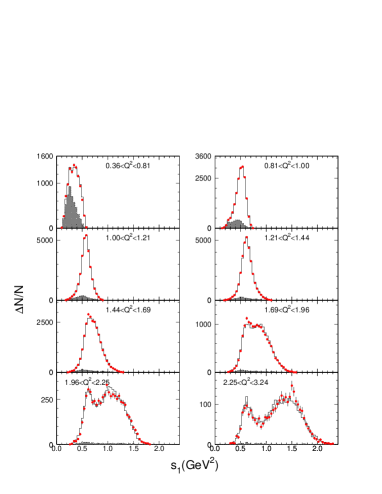
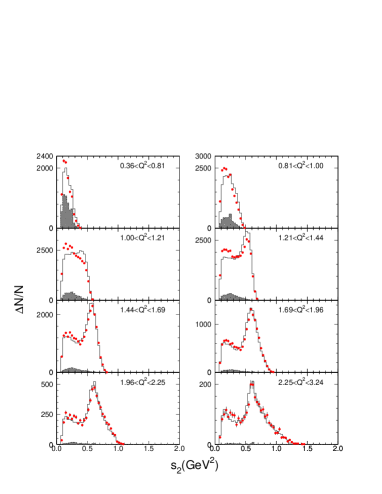
Figure 3: Dalitz plots for sequential bins in is in units
of (GeV) and
are the two possible invariant masses squared; is
the larger of the two possible invariant mass-squared values. Figure 4: Projection of the Dalitz plot onto the axis for various bins in
The points are the experimental data and the histogram
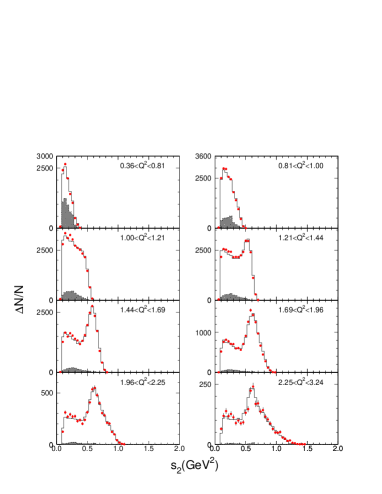
is the result of the fit. The shaded regions represent the background.Figure 5: Projection of the Dalitz plot onto the axis for various bins in
The points are the experimental data and the histogram
is the result of the fit. The shaded regions represent the background.Figure 6: Projection of the Dalitz plot onto the axis for various bins in
for a fit without
isoscalars. The points are the experimental data and the histogram
is the result of the fit. The shaded regions represent the background.Figure 7: Projection of the Dalitz plot onto the axis for various bins in
for a fit without
isoscalars. The points are the experimental data and the histogram
is the result of the fit. The shaded regions represent the background.
5 SUMMARY
This work is a new measurement of substructure in A model-dependent unbinned maximum likelihood
fit on 145,000 events was performed using an axial vector component [ primary resonance and
several subresonances, including isoscalars] and a pseudoscalar component [
plus several subresonances]. As expected, this
decay is dominated by
with subsequent
-wave decay. However, it is also apparent that other decay
modes are present. In particular, decay into isoscalars [ and
] is significant. The is especially prominent. These
results are consistent with the earlier CLEO II results for
[5]. Both analyses find that axial-vector amplitudes with isoscalars,
especially are large.
Regarding non-axial-vector contributions, inclusion of the
improves the fit to the data in the expected regions, but the need for it is not compelling.
It is hoped that the future CLEO-c dataset will clarify some of these issues.
6 ACKNOWLEDGEMENTS
This work represents the work of many CLEO collaborators, especially Jason W. Hinson, Jon Urheim,
and Alan J. Weinstein. The CESR staff provided us with
excellent luminosity and running conditions. This work is supported by the National
Science Foundation, the U. S. Department of Energy, and the Natural Sciences and
Engineering Research Council of Canada.
References
[1] H. Albrecht et al., Phys. Lett. B349 (1995) 576.
[2] J. H. Kühn and A. Santamaria, Z. Phys. C 48 (1990) 445.
[3] N. Isgur, C.
Morningside, and C. Reader, Phys. Rev. D39 (1989) 1357.
[4] J. W. Hinson, Ph.D. thesis, Purdue University (2001), PU-99-713.
[5] D. M. Asner et al., Phys. Rev. D61 (1999), 012002,
hep-ex/9902022.
[6] K. Hagiwara et al., Phys. Rev. D66 (2002), 010001.
[7] N. A. Törnqvist, Z. Phys. C 68 (1995), 647–660.
[8] R. Decker, M. Finkemeier, and E. Mirkes, Phys. Rev. D50 (1994) 6863,
hep-ph/9310270.