Present Status of the K2K Experiment
Abstract
New results from the K2K (KEK to Kamioka) long-baseline neutrino-oscillation experiment is presented
1 Introduction
The K2K experiment[1, 2, 3, 4, 5] is the first long-baseline neutrino-oscillation experiment with a distance of hundreds of km and using an accelerator-based neutrino beam. The nominal sensitive region in the neutrino-oscillation parameters is eV2. This covers the parameter region suggested by the atmospheric neutrino anomaly observed by several underground experiments,[6, 7, 8] and confirmed by Super-Kamiokande (SK)[9].
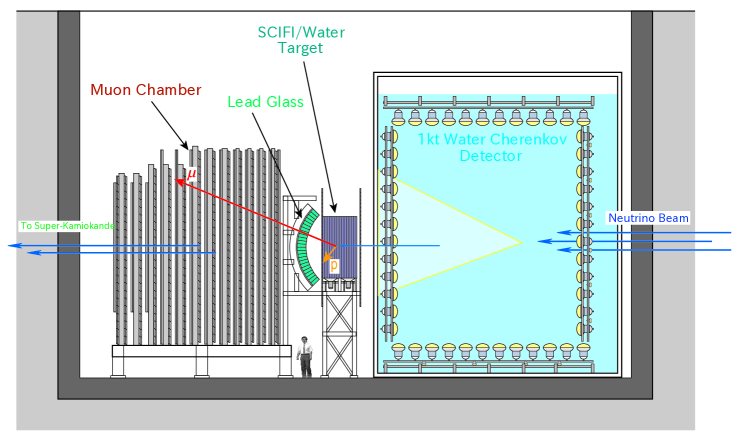
An overview of the K2K experiment is as follows. An almost pure wide-band beam generated in the KEK 12-GeV Proton Synchrotron (PS) is detected in the SK detector at a distance of 250 km. Two beam monitors are located along the beam line. One is a pion monitor (PIMON), which is a gas Cherenkov detector installed downstream of the second magnetic Horn. The other is a muon monitor (MUMON), which is an ionization chamber and a silicon pad array behind the beam dump. In addition, two different types of front detectors (FDs) are located at the KEK site. One is a 1kt water Cherenkov detector (1KT), which is a miniature of the SK detector. The other is a so-called fine-grained detector (FGD), which is composed of a scintillating fiber tracker (SFT)[10], trigger counters (TRG), lead glass counters (LG) and a muon range detector (MRD)[11].
Since the neutrino beamline, the beam monitors and detectors are already described in previous articles[3, 4, 5], they are not described here. Instead, summaries of these detector components are given in tables. Table 1 gives the design features of the neutrino beamline. Table 2 gives the design and performance features of beam monitors. The design, purpose, and performance of the detectors are given in Table 3. A schematic view of the Front detectors is also shown in Fig.1.
| Proton kinetic energy | 12 GeV |
|---|---|
| Proton intensity | 5.6 |
| Extraction mode | Fast extraction |
| Beam duration | second for every 2.2 second |
| Target | Aluminum (3cm 65cm) |
| Decay tunnel | 200 m |
| Pion monitor (PIMON) | |
|---|---|
| Design | Gas Cherenkov detector with a spherical mirror and R-C318 gas. |
| Reflected light is collected by 20 Hamamatsu R5600-01Q PMTs. | |
| Position | Downstream of the second magnetic horn. |
| Purpose | Cherenkov photons from charged pions are measured |
| at several refraction indices controlled by the gas pressure. | |
| The momentum and angular distributions of the pion beam are obtained | |
| from the intensity and shape of the Cherenkov image in the focal plane. | |
| The neutrino energy spectrum for GeV can be calculated | |
| from the kinetics of the pion decay. | |
| Muon monitor (MUMON) | |
| Design | 2m 2m ionization chamber filled with He gas |
| and a silicon pad array. | |
| Position | Downstream of the beam dump. |
| Purpose | The position of the beam center is monitored with an accuracy of |
| less than 2 cm in spill on spill basis. | |
| Front detectors 300m downstream | |
|---|---|
| (A)1kt water Cherenkov Detector | |
| Design | A 1/50 (total volume) miniature of the Super-Kamiokande detector; 496 tons |
| of water are viewed by 680 20-inch PMTs. The fiducial mass is 25.1 ton. | |
| Purpose | Direct comparison with neutrino events in Super-Kamiokande |
| Performance | identification capability: 99%; : 3%/ |
| Event rate | 0.005 events/spill in fiducial volume; 1 events for p.o.t. |
| (B)Fine Grained Detector | |
| Design | Consists of a scintillating fiber tracker, trigger counters, |
| lead-glass counters and a muon range detector. | |
| Purpose | Precise measurement of the neutrino profile and energy distribution |
| (B-1)Scintillating fiber tracker (SFT) | |
| Design | 20-layer “sandwich” of scintillating fiber (0.7mm) sheets |
| and water in aluminum containers. | |
| Sensitive area: 2.4m 2.4m; Fiducial mass: 5.94 tons | |
| Function | Track reconstruction of charged particles and identification of the kinematics |
| of neutrino interactions. Water is used as the target material. | |
| Performance | Detection efficiency of each layer: 99% |
| Position resolution: mm | |
| Event rate | 0.001 events/spill, 2 events for p.o.t. |
| (B-2)Trigger counters (TRG) | |
| Design | 80 large plastic scintillators (466cm (L)10.7cm(W)4.2cm(T)) |
| covering upstream and downstream of the scintillating fiber tracker | |
| Function | Rejection of cosmic ray muons and neutrino events from 1kt water |
| Cherenkov detector, and measurement of the absolute event time. | |
| Performance | Timing resolution: 2nsec; Position resolution: 5cm. |
| Detection threshold@center of the scintillators: 1.7MeV. | |
| Detection efficiency for a penetrating charged particle: 99%. | |
| (B-3)Lead glass counters (LG) | |
| Design | 600 lead glass counters with an acceptance of 11.3cm 12.2 cm each |
| Function | Identification of electrons from the energy deposit in the counter |
| Performance | : . |
| (B-4)Muon range detector (MRD) | |
| Design | 12-layer “sandwich” of 900 drift chambers |
| and iron filters (10cm-20cm thickness). | |
| Function | Measurement of the muon energy from the range. |
| Performance | Position resolution: 2.2mm. |
| Detection efficiency of each layer: 99%; . | |
| Far detector (Super-Kamiokande) 250km downstream | |
| Design | 50kt huge water Cherenkov detector at about 1000m underground. |
| 22.5kt of the fiducial volume is viewed by 11164 20-inch PMTs. | |
| Performance | identification capability: 99 %; |
| : 3%/; : 3% | |
| Accuracy of the absolute event time adjustment: 0.2sec | |
| Event rate | 0.3 events/day, 160 events for p.o.t. |
The K2K experiment was successfully started in early 1999, and physics data were recorded from June 1999 to July 2001. The total data-taking period during three years was 234.8 days. The accumulated beam intensity was protons on the target (p.o.t.), which is about 50% of the goal of the experiment, p.o.t.
2 Study of the Neutrino beam properties at the KEK site
The characteristics of the neutrino beam at the KEK site were examined using FDs and beam monitors. In this section, the present status of analyses on (1)the neutrino beam direction, (2)the neutrino beam intensity and its stability, (3)the ratio, (4)the neutrino energy spectrum, and (5)extrapolation of the neutrino flux are presented.
2.1 Neutrino beam direction
The neutrino beam-line was constructed using a GPS position survey[12]; the alignment of the beam-line, FDs and SK is better than 0.1 mrad. The neutrino beam direction relative to the beam-line was measured with MUMON and MRD independently.
The position resolution of MUMON is about 2 cm, corresponding to an angular resolution of 0.1 mrad. Because and muons originate in the same pion decay in the decay volume, the beam direction can be examined from the profile center of the muon beam. The time variation of the profile center is plotted in Fig. 2. The direction of the muon beam agrees with the beam-line within 1 mrad.
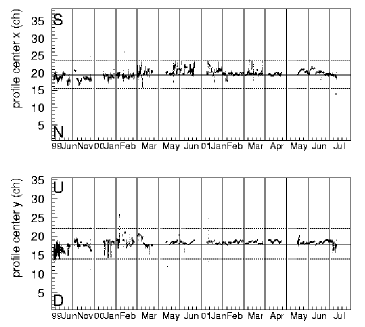
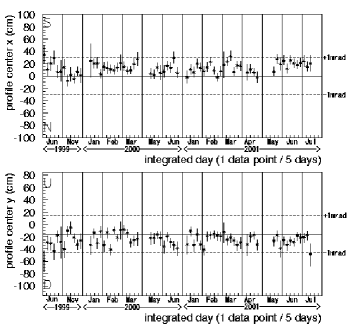
The neutrino beam direction is also measured using neutrino interactions in MRD[11]. From spatial constructions of the vertex positions, the center of the vertex positions is found to agree with the SK direction within 1 mrad. The time variation of the beam center, also plotted in Fig. 2, shows that the steering of the beam direction is stable, and is consistent with the results from the muon monitors.
Since the angular acceptance of the SK detector from the KEK site is about 0.2 mrad, and the energy spectrum of the neutrino beam is expected to be uniform within 3 mrad from the center of the beam axis, the adjustment of the neutrino beam direction ( 1 mrad) is sufficient.
2.2 Neutrino beam intensity and its stability
The absolute neutrino event rates in the FDs are used to calculate the expected number of events in SK. The neutrino events in 1KT are reconstructed from the Cherenkov ring pattern by the same method as that used in the SK atmospheric neutrino analysis. We selected events with the reconstructed vertex being inside 25.1 tons of the fiducial volume, which is defined by a 2 m radius, 2 m long cylinder along the beam axis. Since the average number of neutrino events in the whole 1KT detector is about 0.2 events/spill, multiple neutrino events in one spill must be taken into consideration. The total sum of PMT signals, which are recorded by FADC, is used for counting the number of neutrino interactions in a spill. By considering this correction, the number of neutrino interactions in the fiducial volume was obtained to be 0.02 events per spill. This measurement has a 4% systematic uncertainty, which is mainly due to vertex resolution of the reconstructions.
Although the absolute event numbers were also studied by SFT and MRD, the neutrino events in 1KT are preferable for an absolute event number analysis, because the possible systematic errors inherent to the detection method are the same as that of SK, and are canceled in the analysis. Therefore, details of the SFT and MRD analysis are not presented in this report.
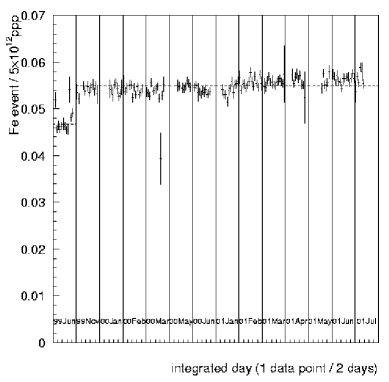
The stability of the beam intensity is contaneously measured from the neutrino event rate in MRD because of their large statistics. A detailed description of the event reconstruction can be found in [11]. The time variation of the neutrino interactions in MRD is shown in Fig. 3. The neutrino beam intensity is stable within a few %.
2.3 ratio
The ratio of the neutrino beam at the KEK site was measured by 1KT and FGD. The idea of the measurements is given in [4]. An analysis with 1KT is still under way, and no numerical result has been obtained yet. On the other hand, a very preliminary result with FGD is reported to be (1.80.6)%[13], where the expectation based on a Monte-Carlo simulation is 1.3%. The original neutrino beam has been proved to be almost a pure beam.
2.4 Neutrino energy spectrum
The neutrino energy spectrum was examined with 1KT and FGD. The 1KT has a high efficiency for low-energy neutrinos below 1 GeV and a full 4 coverage in the solid angle. However, the efficiency for muons above 1 GeV is poor because most of the muons escape from the detector. On the contrary, although FGD has a high efficiency for higher momentum muons, the efficiency for low-momentum muons is relatively poor, and the angular acceptance is limited to be within 50 degrees from the beam axis. By combining the 1KT and FGD results, the entire range of the neutrino energy spectrum can be covered.
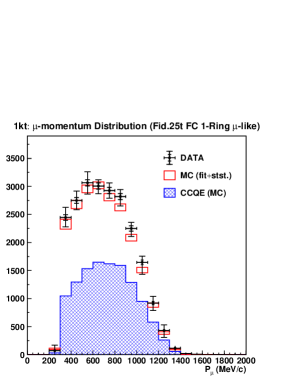
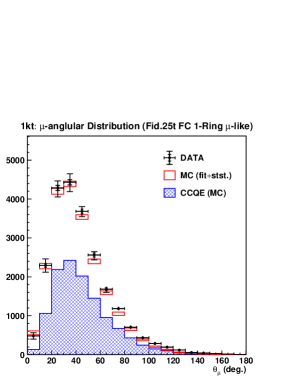
In the 1KT detector, events with only one -like Cherenkov ring are selected. It was also required that the vertex position is in the 25.1 tons of the fiducial volume described in the previous section, and the particles are fully-contained in the inner detector. To determine the neutrino energy, single -like ring events are assumed to be the charged-current quasi-elastic (CCQE) interaction of muon neutrinos, . Most of the neutrino energy is transfered to the muons in this interaction mode. The neutrino energy can be directly calculated from the momentum and angle of the outgoing muons as
| (1) |
where and are the masses of the nucleon and the muon, respectively, and . The muon momentum and angle from the beam axis are shown in Fig. 4 together with the Monte Carlo expectations described below.
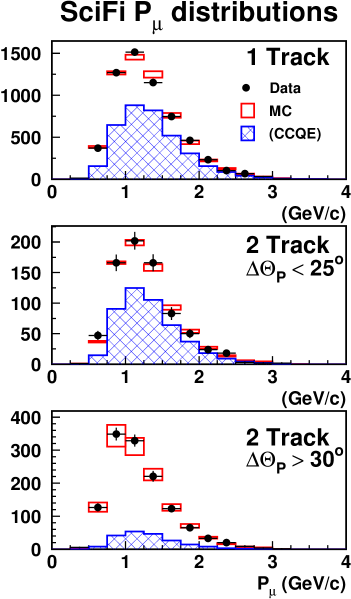
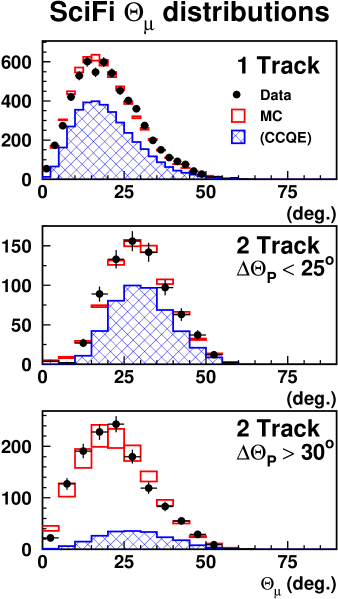
In FGD, neutrino events which satisfy the following criteria are selected: (1)the vertex position is inside of the 5.94 ton SFT fiducial volume; (2)one track passes through 3 layers of scintillating fibers, TRG, LG, and is stopped in MRD. CCQE events are recognized as 1-track or 2-track events because the recoiled proton track can be occasionally identified as another short track. If the CCQE interaction is assumed, the travel direction of the recoiled proton can be expected from the direction of the muon track by using momentum conservation. The angle between the expected direction and the real second track can be used to distinguish CCQE events from other interactions. Three categories of events are defined as: (1)1-track events, (2)2-track events with , and (3)2-track events with . The second and the third samples are CCQE and non-CCQE enriched event samples, respectively. The momentum and angle distributions for three events samples are shown in Fig. 5.
The expectations are based on GEANT[14] with a detailed description of the materials and magnetic fields in the target region and the decay volume. It uses measurements of the primary-beam intensity and profile at the target as input parameters. The primary proton interactions on aluminum are modeled with a parameterization of hadron production data[15]. Other hadronic interactions are treated by GEANT-CALOR[16].
The momentum distribution in 1KT and FGD can be used to determine the neutrino energy spectrum by the following procedure. The neutrino energy spectrum is divided into 8 energy regions, and the corresponding muon momentum distributions are prepared by a Monte-Carlo simulation for each detector. The weighting factor of each region as well as other systematic errors are assumed to be fitting parameters. By the comparing with the real data in 1KT and FGD, the neutrino energy distribution is determined. The most probable values and their possible ranges of the systematic errors are also obtained from the fitting, and are applied to the following SK analysis.
The best-fit results are also shown in Fig. 5 and Fig. 6. The agreement with the data is excellent.
2.5 Extrapolation of the neutrino flux

The production of neutrinos is calculated from the simple two-body decay of the charged pions. Therefore, once the kinematic distribution of charged pions after the second magnetic horn is known, it is possible to predict the muon neutrino spectrum at any distance.
The pion momentum and angular distribution are measured by PIMON, whose characteristics are given in Table 2. In PIMON, intensity and shape of the Cherenkov image in the focal plane are measured by the PMT array. The measurement is a superposition of slices of the Cherenkov ring from charged pions of various momentum and angles. The refraction indices are controlled by the gas pressure, and seven independent measurements at different Cherenkov thresholds are done. From these measurements, the relative pion beam intensities are obtained as a function of the momentum and angle. To avoid contamination of the Cherenkov light from the surviving 12-GeV primary protons, the refraction indices are adjusted to be below the Cherenkov threshold of the 12-GeV proton. Accordingly, an analysis for the pion momentum less than 2 GeV is not possible, and the measurable neutrino energy range is limited to be larger than 1 GeV. A more detailed description of the PIMON and the analysis method can be found in [17].
Fig. 6 shows the energy spectrum shape and the flux ratio in SK and FDs (so-called Far/Near flux ratio) obtained by the above-mentioned analysis together with the results from a Monte-Carlo simulation. The agreements between this analysis and the simulation are excellent. Fig. 6(bottom) can be used to calculate the expected event numbers in SK from the observations in the FDs.
3 Observation in Super-Kamiokande
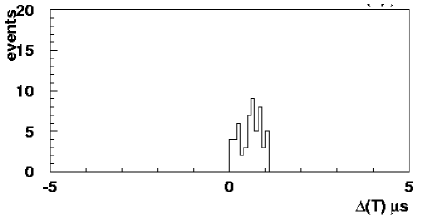
To obtain beam-correlated fully contained neutrino interactions, an event selection similar to an atmospheric neutrino analysis[9] was applied. For the selected events, the time correlation with the neutrino beam was then examined. Fig. 7 shows the time difference between the neutrino beam and the events obtained from atmospheric neutrino selection.
Considering the neutrino beam duration (1.1sec) and accuracy[18] of the absolute time determination (sec), events within a 1.5sec time window covering the neutrino beam period were selected. A total of 56 fully-contained events were found in 22.5kt of the fiducial volume. The number of the neutrino events and the results from the particle identification[19] are summarized in Table 4. Because the expected atmospheric neutrino background in the fiducial volume within the neutrino beam period was calculated to be events, the 56 events in the fiducial volume are a clear signal of neutrinos from KEK.
4 Oscillation analysis
Strategies of the oscillation study at K2K are summarized as follows. If oscillate to , the absolute event number of neutrino interactions in SK is reduced because interact only through neutral current interactions in the K2K neutrino energy range. In addition, the neutrino energy spectrum in SK should be distorted, because the oscillation probability is a function of the neutrino energy.
In the following two subsections, the status of the data analyses on the absolute event numbers and on the distortion of the neutrino energy spectrum are presented. In the final subsection, an analysis of the constraints on the neutrino oscillation parameters is discussed.
4.1 Absolute event numbers
The expected event numbers in SK are calculated from the neutrino event rate in FDs, and an extrapolation from the FDs to SK. The numbers obtained in 1KT, SFT, and MRD are used for the event rate in the FDs, as reported in . The Far/Near flux ratio has already been obtained from PIMON, as presented in . The expectations based on the data from the FDs are 80.1(1KT), 87.5(SFT), and 87.4(MRD). These results are consistent with each other. As mentioned in , we used the numbers from 1KT as official numbers because of its small systematic errors.
| Event Category | SK data | Expected | ||
|---|---|---|---|---|
| (1KT) | (SFT) | (MRD) | ||
| Single ring events | 32 | |||
| (-like) | 30(29) | |||
| (e-like) | 2 | |||
| Multi ring events | 24 | |||
| Total | 56 | 80.1 | 87.5 | 87.4 |
The statistical probability that the observation is equal to or smaller than 56, where the expectation is 80.1, is about 1%. The observation is significantly smaller than the expectation.
4.2 Shape of the neutrino energy spectrum
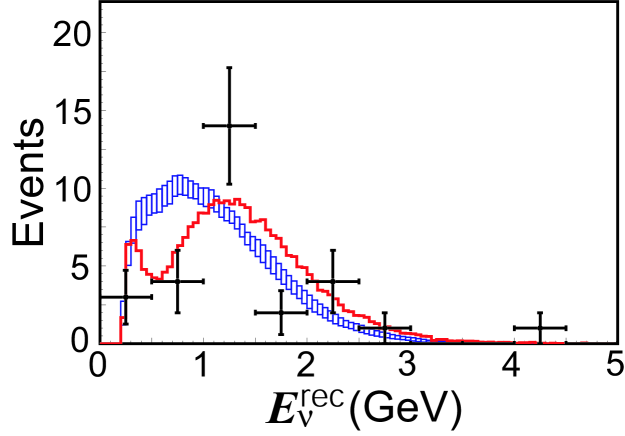
The neutrino energy spectrum is calculated from 29 single-ring -like events. (Among 30 single-ring -like events listed in Table 4, one event recorded in the early stage of the experiment is not used in the spectrum analysis because the condition of the neutrino beam line is different from that of the other data-taking period. See also Fig. 3.)
Fig. 8 shows the energy spectrum of the 29 events with expectations. These expectations were obtained from the neutrino energy spectrum discussed in , and the Far/Near flux ratio presented in . A reduction of the neutrino event in the 0.5-1.0 GeV bin is obvious. If the absolute normalization of the flux is assumed to be a free parameter without any constraints, the probability that the data is explained by statistical fluctuation of the null oscillation is calculated to be about 15%. A more quantitative analysis is done by combining with the absolute event numbers.
4.3 Constraints on the oscillation parameters
To evaluate the absolute number of events and the spectrum shape simultaneously, an un-binned maximum likelihood analysis is employed. The likelihood is defined as the product of the normalization term and the shape term:
| (2) |
The normalization term, , is a simple poisson probability of observing (=56) for the prediction . The shape term, , is the product of the probabilities for each single -like events:
| (3) |
where is the probability of -th event having energy at a given set of oscillation parameters. is the number of single -like events used in the analysis, and is 29.
When the likelihood, , is maximized, various systematic errors are taken into consideration. The source of the systematic errors include the spectrum shape, the Far/Near flux ratio, non-CCQE/CCQE ratio, the efficiency in SK, the absolute energy scale in SK and so on. Not only the individual systematic errors, but also the correlation between them are carefully taken into account. For the systematic error parameters which are common with FD, their probable range from the FD analysis are considered. More details about the systematic errors and their threatments are not discussed in this report, but is reported are [20].
The oscillation parameter set which maximize the likelihood, , was calculated to be
| (4) |
In this case, the expected total event number is 54.2. The expected energy spectrum is shown by the red line in Fig. 8. The agreements with the experimental results are excellent.
The probability that the K2K results can be explained by a statistical fluctuation of null oscillation is calculated from the likelihood ratio of the null oscillation to the best-fit point. The results were obtained to be 0.4% or 0.7%, depending on the two independent treatments of the systematic errors in the likelihood[20]. We conclude that the null oscillation probability is less than 1%.
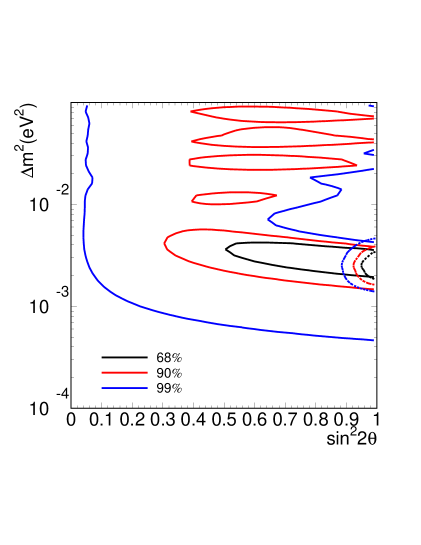
Finally, constraints on the oscillation parameters are studied from the likelihood ratio to the best fit. The allowed region in the oscillation parameter plane is shown in Fig. 9. The 90% C.L. allowd region on for the full mixing, , is
| (5) |
These results agree well with the most recent SK atmospheric neutrino analysis[21], as shown in Fig. 9.
5 Summary
The K2K long-baseline neutrino-oscillation experiment has been successfully operated since 1999. By the end of 2001, a total intensity of 47.9 protons on target was accumulated. A total of 56 fully-contained neutrino interactions in the 22.5kt of the fiducial volume of the SK detector were observed, where the expectation based on the data from the Front Detectors is 80.1. The neutrino energy spectrum obtaind from 29 single -like ring events shows a clear deficit in neutrino energy between 0.5 GeV and 1.0 GeV. The probability that the measurements at SK can be explained by a statistical fluctuation of the null oscillation is less than 1%. The 90% C.L. allowed region on the oscillation parameters is eV2 for . This result is consistent with the results from the SK atmospheric neutrino analysis.
References
- [1] K.Nishikawa et al., KEK-PS proposal, Nucl.Phys.B (Proc. Suppl.) 59,289 (1997).
- [2] S.H.Ahn et al. (K2K collaboration), Phys.Lett.B511,178 (2001).
- [3] Y.Oyama, hep-ex/9803014 (1998).
- [4] Y.Oyama, hep-ex/0004015 (2000).
- [5] Y.Oyama, hep-ex/0104014 (2001).
-
[6]
K.S.Hirata et al., Phys.Lett.B205, 416 (1988);
K.S.Hirata et al., Phys.Lett.B280, 146 (1992);
E.W.Beier et al., Phys.Lett.B283, 446 (1992);
Y.Fukuda et al., Phys.Lett.B335, 237 (1994);
S.Hatakeyama et al., Phys.Rev.Lett 81,2016(1998). -
[7]
D.Casper et al., Phys.Rev.Lett. 66, 2561 (1991);
R.Becker-Szendy et al., Phys.Rev. D46, 3720 (1992). - [8] W.W.M.Allison et al., Phys.Lett.B391, 491 (1997).
-
[9]
Y.Fukuda et al., Phys.Lett.B 433,9 (1998);
Y.Fukuda et al., Phys.Lett.B 436,33 (1998);
Y.Fukuda et al., Phys.Rev.Lett. 81,1562 (1998);
Y.Fukuda et al.,Phys.Rev.Lett. 82,2644 (1999). -
[10]
A.Suzuki et al., Nucl.Instrm.Meth. A453, 165 (2000);
B.J.Kim et al., hep-ex/0206041 (2002). - [11] T.Ishii et al., Nucl.Instrm.Meth. A482, 244 (2002).
- [12] H.Noumi et al., Nucl.Instrm.Meth. A398, 399 (1997).
- [13] M.Yoshida, Ph.D thesis, Osaka University (2001). Note that numbers in this article are very preliminary and are not official results of the collaboration.
- [14] R.Brun et al., CERN DD/EE/84-1 (1987).
-
[15]
J.R.Sanford and C.L.Wang,
BNL AGS internal reports No.BNL11299 and No.BNL11479 (1967);
C.L.Wang, Phys.Rev.Lett. 25, 1068 (1970);
Y.Cho et al., Phys.Rev. D4, 1967 (1971);
J.G.Asbury et al., Phys.Rev. 178, 2086 (1969);
G.J.Marmer et al., Phys.Rev. 179, 1294 (1969);
G.J.Marmer and D.E.Lundquist, Phys.Rev. D3, 1089 (1971);
J.V.Allaby et al., CERN-TH-70-12 (1970). -
[16]
T.A.Gabriel et al., ORNL/TM-11185;
C.Zeitnitz and T.A.Gabriel, Nucl.Instrm.Meth. A349, 106 (1994). - [17] T.Maruyama, Ph.D thesis, Tohoku University (2000).
- [18] H.G.Berns and R.J.Wilkes, IEEE Nucl.Sci. 47, 340 (2000).
- [19] S.Kasuga et al., Phys.Lett. B374, 238 (1996).
- [20] S.H.Ahn et al. (K2K collaboration), in preperation.
- [21] T.Kajita (for Super-Kamiokande collaboration), in these proceedings.