Atmospheric neutrino oscillations with the MACRO detector
M. Giorgini, for the MACRO Collaboration111For the full list of the Coll., see ref. [10]
University of Bologna and INFN,
Viale C. Berti Pichat 6/2
I-40127 Bologna, Italy
E-mail: miriam.giorgini@bo.infn.it
Talk given at Beyond the Desert 02, Conference on Physics beyond
the Standard Model,
Oulu, Finland, 2-7 June 2002
Abstract
After a short overview of the MACRO detector, located at the Gran Sasso Laboratory, I shall present and discuss the results on atmospheric muon neutrino oscillations, concerning low ( GeV) and high ( GeV) energy data. Using the Multiple Coulomb Scattering of muons inside the lower part of the detector, estimates of the neutrino energy were made event by event for the high energy sample. The data on angular distributions, absolute flux and distribution favor oscillations with maximal mixing and eV2.
1 Introduction
The phenomenon of neutrino oscillations [1] implies that the flavour states are linear combinations of the mass eigenstates through the elements of the unitary mixing matrix :
| (1) |
In the simple case of two-flavour oscillations , the oscillation probability of a into a can be expressed by:
| (2) |
where (eV2), is the mixing angle, (km) is the traveled neutrino distance and (GeV) is the neutrino energy.
Atmospheric neutrinos are the result of a decay chain starting with the interactions of high energy primary cosmic rays in the upper atmosphere. Each interaction produces a large number of pions and kaons, which decay yielding muons and muon neutrinos; also the muons decay yielding muon and electron neutrinos. These neutrinos are produced at about 20 km above ground and they proceed towards the Earth. An underground detector is “crossed” by a neutrino flux from all directions. Fig. 1a shows how an underground detector can detect and study atmospheric muon neutrinos and Fig. 1b is a simple illustration of the described decay chain.
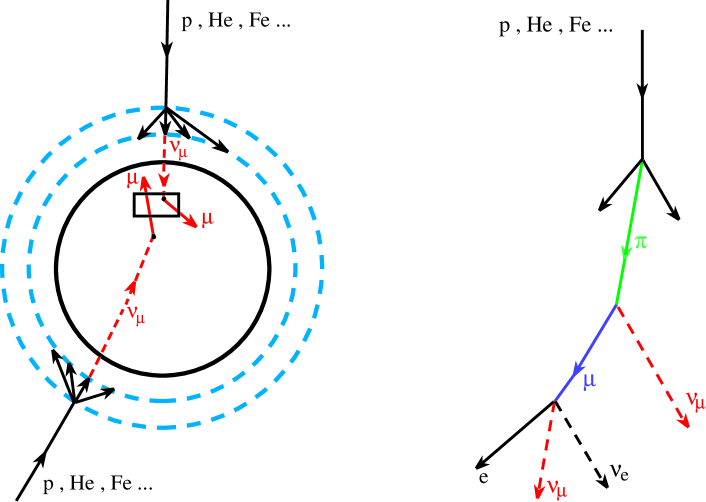
(a) (b)
Atmospheric neutrinos are well suited to study neutrino oscillations, since they have energies from a fraction of a GeV up to more than 100 GeV and they may travel distances from few tens of km up to 13000 km; thus the values range from km/GeV to more than km/GeV.
In the following, I shall briefly describe the main features of the MACRO detector, then I shall discuss the main results of MACRO about muon neutrino oscillations.
2 The MACRO experiment
MACRO [2] was a large multipurpose detector which was operational at the Gran Sasso Laboratory from 1989 till the end of 2000. Though it was optimized to search for the supermassive GUT magnetic monopoles, the MACRO research program included a wide range of topics, like atmospheric oscillations, astrophysics, nuclear and particle physics and cosmic ray physics.
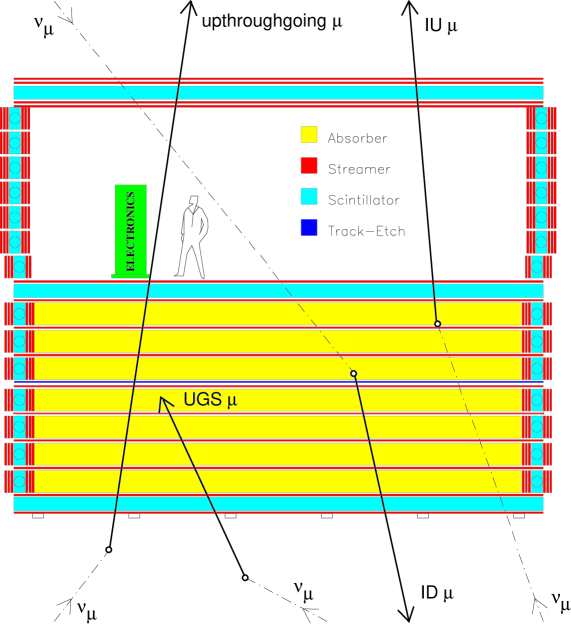
The average rock overburden of 3700 hg/cm2 reduced the atmospheric muon flux by a factor . MACRO was a large rectangular box, 76.6m12m9.3m, divided longitudinally in six supermodules and vertically in a lower part (4.8 m high) and an upper part (4.5 m high), Fig. 2. It had three types of detectors which gave redundancy of informations: liquid scintillation counters, limited streamer tubes and nuclear track detectors. This last detector was used only for rare particle searches.
For muon and for neutrino physics and astrophysics studies, the streamer tubes were used for muon tracking and the liquid scintillation counters for fast timing. The lower part of the detector was filled with trays of crushed rock absorbers alternating with streamer tube planes; the upper part was open and contained the electronics [2].
There were 10 horizontal planes of streamer tubes in the bottom half of the detector, and 4 planes at the top, all with wires and 26.5∘ stereo strips readout. Six vertical planes of streamer tubes and one layer of scintillators covered each side of the detector. The scintillator system consisted of three layers of horizontal counters, and of the mentioned vertical layer along the sides of the detector.
The combination of the informations from the streamer tubes and from the scintillators allowed tracking with a precision of 1 cm over path lengths of several meters, and timing with a precision of 600 ps. The detector provided a total acceptance m2 sr for an isotropic flux of particles.
Fig. 2 is a vertical section of the detector; it shows a general view of the detector and gives a sketch of the different topologies of detected neutrino-induced muon events used to study neutrino oscillations: Upthroughgoing muons, Internal Upgoing muons (IU), Upgoing Stopping muons (UGS) and Internal Downgoing muons (ID).
The Upthroughgoing muons [3] (with GeV) come from interactions in the rock below the detector of muon neutrinos with an average energy GeV. The tracking is performed with streamer tubes hits; the time information, provided by scintillation counters, allows the determination of the direction (versus) by the time-of-flight (T.o.F.) method.
The semicontained upgoing muons (IU) [4] come from interactions inside the lower apparatus. Since two scintillation counters are intercepted, the T.o.F. method is applied to identify the upward going muons. The average parent neutrino energy for these events is GeV. If the atmospheric neutrino anomalies are the results of oscillations with maximal mixing and eV2, one expects a reduction of about a factor two in the flux of IU events, without any distortion in the shape of the angular distribution.
The up stopping muons (UGS) [4] are due to interactions in the rock below the detector yielding upgoing muon tracks stopping in the detector; the semicontained downgoing muons (ID) [4] are due to induced downgoing tracks with vertex in the lower MACRO. The events are found by means of topological criteria; the lack of time information prevents to distinguish between the two subsamples. An almost equal number of UGS and ID events is expected in the no oscillation hypothesis. In case of oscillations, a similar reduction in the flux of the up stopping events and of the semicontained upgoing muons is expected; no reduction is instead expected for the semicontained downgoing events (which come from neutrinos which traveled km).
3 Upthroughgoing muons
The data were collected during the running period from March 1989 to April 1994 with the detector under construction and during the runs with the complete detector from 1994 until December 2000 (livetime 5.52 yrs). Since the total livetime normalized to the full configuration is 6.16 yrs, the statistics is largely dominated by the full detector run. The analysis of a data sample of more than 40 million atmospheric downgoing muons achieved a rejection factor of which includes background caused by showering events and radioactivity in coincidence with muons.
One of the main cuts to remove background requires that the position of a muon hit in each scintillator, as determined from the timing within the scintillator counter, agrees within cm with the position indicated by the streamer tube track.
Downgoing muons passing near MACRO may produce low energy upgoing particles, which could appear neutrino-induced upgoing muons [5]. In order to reduce this background, we require that each upgoing muon crosses at least 200 g cm-2 of material in the lower part of the detector.
A large number of nearly horizontal upgoing muons have been observed coming from azimuth angles between and . In this direction, the rock overburden is insufficient to remove nearly horizontal downgoing muons which have scattered in the mountain and appear as upgoing. This region was excluded for real events and for MC simulations.
For muons crossing 3 scintillation counters a linear fit of the times as a function of the path length is performed and a cut is applied on the ; further minor cuts are applied to events crossing 2 counters.
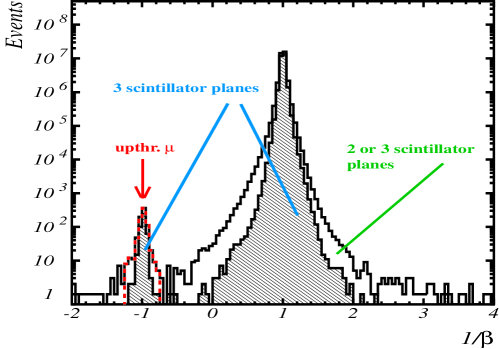
The direction of muons crossing MACRO is determined by the time of flight method, between two layers of scintillators. The measured muon velocity is calculated with the convention that downgoing muons have and upgoing muons have . The distribution for the sample collected with the full detector is shown in Fig. 3. We selected upwardgoing muons requiring ; we found 863 events, of which 809 events remained after quality cuts and background subtraction.
In the upgoing muon simulation the neutrino flux computed by the Bartol group [6] was used. The cross sections for the neutrino interactions was calculated using the deep inelastic parton distributions [7]. The muon propagation to the detector was computed using the energy loss calculation in standard rock [8].
The total systematic uncertainty on the expected flux of upthroughgoing muons, arising from the neutrino flux, cross section and muon propagation, was estimated to be 17%. This theoretical uncertainty is mainly a scale error that does not affect the shape of the angular distribution; the error on the shape is . The same cuts applied to the data were used for the simulated events: assuming no oscillations, they selected 1122 MC events.
Fig. 4 shows the zenith angle ) distribution of the measured flux of upthroughgoing muons (black points); the MC expectation for no oscillations is indicated by the dashed line with the 17% scale error band. A deficit of events, more evident around the vertical direction, can be noticed. The ratio of the observed number of events to the expectation without oscillations in is .
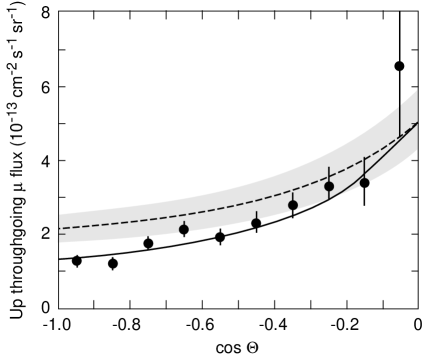
The shape of the angular distribution was tested with the hypothesis of no oscillations normalizing the prediction to the data. The corresponds to a probability of 0.2%. In the hypothesis of two-flavour () oscillations, the minimum in the physical region is 9.7/9 () for maximal mixing and eV2. An independent test was made on the number of the events.
Combining the probabilities from the two independent tests, the best probability is 66% for maximal mixing and eV2. The result of the fit is the solid line in Fig. 4.
3.1 Two-flavour oscillations
The simple relation (2) should be modified when neutrinos propagate through matter [9]. The weak potential in matter produces a phase shift that could modify the oscillation pattern if the oscillating neutrinos have different interactions with matter. The matter effect could discriminate between different neutrino channels: it could be important for and for oscillations, while for there is no matter effect ( and have the same weak potential in matter). Then, it is important when GeV/eV2, therefore for high energy events [9].
In the oscillation scenario, the matter effect changes the shape of the angular distribution and the total number of events with respect to the vacuum oscillations. Large matter effects are expected for neutrinos crossing the Earth, due to the long path length and to the increase of the density in the Earth core. In absence of resonances, due to particular values of the oscillation parameters, the matter effect produces a reduction of the oscillation effect, giving a prediction similar to the no oscillation scenario, particularly for directions near the vertical. Fig. 5a shows the predicted reduction for and oscillations with maximal mixing and eV2 or eV2.
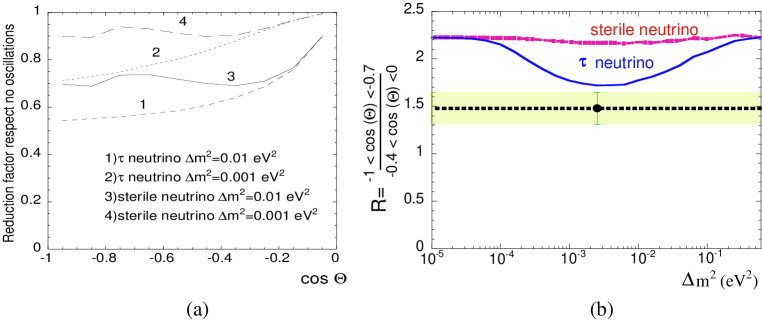
A statistically powerful test is based on the ratio between the events with and the events with [10]. This quantity is more powerful than the because the data are binned to maximize the difference between the two hypotheses and the ratio is sensitive to the sign of the variation. The angular regions were chosen by MonteCarlo (MC) methods in order to have the best discrimination between the and oscillations.
In this ratio, most of the theoretical uncertainties on neutrino flux and cross sections cancel. The remaining theoretical error was estimated at ; the systematic experimental error on the ratio, due to analysis cuts and detector efficiencies, is 4.6%. Combining the experimental and theoretical errors in quadrature, a global estimate of 7% is obtained. MACRO measured 305 events with and 206 with ; the ratio is [10]. The result is shown in Fig. 5b as the black point, with the error bar including statistical and systematic errors; the predictions for and oscillations as a function of are also shown.
For eV2 and maximal mixing, the minimum expected value of the ratio for oscillations is ; for oscillations one expects . The maximum probabilities to find a value of and of smaller than are 9.4% and 0.06% respectively. Hence, the ratio of the maximum probabilities is , so that oscillations (with any mixing) are excluded at 99% C.L. compared to the channel with maximal mixing and eV2 [10].
3.2 energy estimates by Multiple Coulomb Scattering of upthroughgoing muons
Since MACRO was not equipped with a magnet, the only way to experimentally estimate the muon energy was through the Multiple Coulomb Scattering (MCS) of muons in the absorbers, see Fig. 2. The r.m.s. of the lateral displacement of a relativistic muon traveling for a distance can be written as:
| (3) |
where (GeV/c) is the muon momentum and is the amount of crossed material in units of radiation lengths. A muon crossing the whole apparatus on the vertical has (cm)/(GeV). The muon energy estimate can be performed up to a saturation point, occurring when is comparable with the detector space resolution.
Two analyses were performed.
The first analysis was made studying the deflection of upthroughgoing muons in MACRO with the streamer tubes in digital mode [11]. Using MC methods to estimate the muon energy from its scattering angle, the data were divided into 3 subsamples with different average energies, in 2 samples in zenith angle and finally in 5 subsamples with different average values of . This method could reach a spatial resolution of cm, which implies a saturation point at GeV.
As the interesting energy region for atmospheric neutrino oscillations spans from GeV to some tens of GeV, it was important to improve the spatial resolution of the detector to push the saturation point as high as possible. For this purpose, a second analysis was performed using the streamer tubes in “drift mode” [12] using the TDC’s included in the QTP system [13], originally designed for the search for magnetic monopoles. To check the electronics and the feasibility of the analysis, two “test beams” were performed at the CERN PS-T9 and SPS-X7 beams. For each triggered tube, the arrival time of the signal multiplied by the drift velocity, measured at the test beam [14], gave the radius of the drift circle. The upthroughgoing muon tracks were reconstructed as the best fit of the drift circles referring to the triggered streamer tubes. The space resolution achieved is mm, a factor of 3.5 better than in the previous analysis. For each muon, 7 MCS sensitive variables were given in input to a Neural Network (NN) which was previously trained to estimate with MC events of known input energy crossing the detector at different zenith angles.
The calibration procedure of the NN output used to reconstruct event by event was used also to estimate the corresponding value of . The collected informations allowed to separate the whole sample of upthroughgoing muons in 4 subsamples with average energies of 12, 20, 50 and 102 GeV, respectively. The comparison of the zenith angle distributions of the 4 energy subsamples with the predictions of no oscillation MC shows a strong disagreement at low energies (where there is a deficit of vertical events), while the agreement is restored at higher neutrino energies.
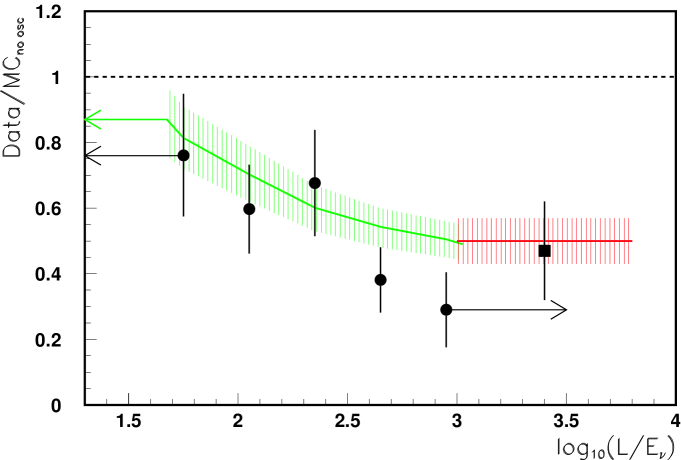
For each event, the neutrino traveled distance was measured with a precision by using the reconstructed zenith angle of the tracked muon. The distribution of the ratios Data/MC obtained by the second method is plotted in Fig. 6 as a function of . The black points are the data, their error bars contain the statistical error, the 17% uncertainty on the predicted flux and a 12% point-to-point systematic error added in quadrature. The continuous line represents the MC prediction for oscillations with maximal mixing and eV2, the shaded area includes the 12% point-to-point error associated to the MC prediction. In the same figure, the black square and the associated MC prediction refer to the Internal Up events (see Sect. 4).
4 Low energy events
These events were mainly due to CC interactions, with a contribution from NC and ( for IU and for UGS+ID). The data concern only the running period with the detector in the full configuration from April 1994 to December 2000. Due to the difference between the topologies of the low energy events, two separate analyses were performed.
The identification of Internal Upgoing (IU) events was based both on topological criteria and T.o.F. measurements. The IU sample corresponds to an effective livetime of 5.8 yrs. The basic request was the presence of a streamer tube track reconstructed in space matching at least two hits in two different scintillators in the upper part of the apparatus. The track starting point had to be inside the apparatus. To reject fake semicontained events entering from a detector crack, the extrapolation of the track in the lower part of the detector had to cross and not fire at least three streamer tube planes and one scintillation counter. The measured muon velocity was evaluated with the same convention of upgoing muons. The range of the IU signal is . After the subtraction of background events, mainly due to wrong time measurements or secondary particles hits, we had 154 upgoing partially contained events.
The identification of ID+UGS events was based on topological criteria. The candidates had a track starting (ending) in the lower apparatus and crossing the bottom detector face. The track had also to be located or oriented in such a way that it could not have entered (exited) undetected through insensitive regions of the apparatus. For this analysis the effective livetime was 5.6 yrs. The event selection required the presence of one reconstructed track crossing the bottom layer of the scintillators and that all hits along the track were confined one meter inside each MACRO supermodule. To reject ambiguous or wrongly tracked events passing the selection, a scan with the Event Display was performed. After background subtraction, we had 262 ID+UGS events.
The MC simulations for the low energy data used the Bartol neutrino flux [6] and the low energy neutrino cross sections [15]. We estimated a total theoretical scale uncertainty on the predicted number of muons of the order of 25% (probably overestimated).
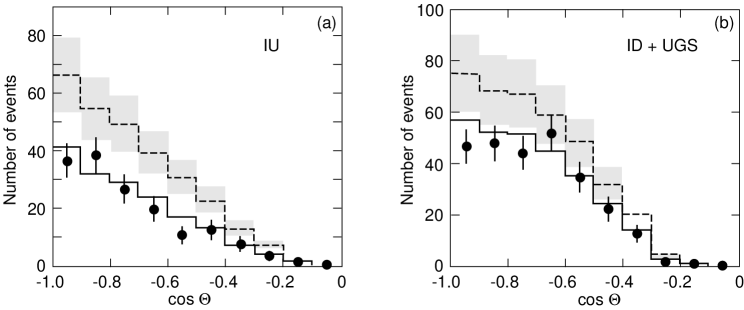
With the full MC simulation, the prediction for IU events was , while the observed number of events was . The ratio was (Data/MC). For this sample, the average value of is 3.2, in good agreement with the hypothesis of neutrino oscillations. The black square in Fig. 6 represents this value.
The prediction for ID+UGS events was , while the observed number of events was . The ratio was (Data/MC).
5 Exclusion plots in the plane
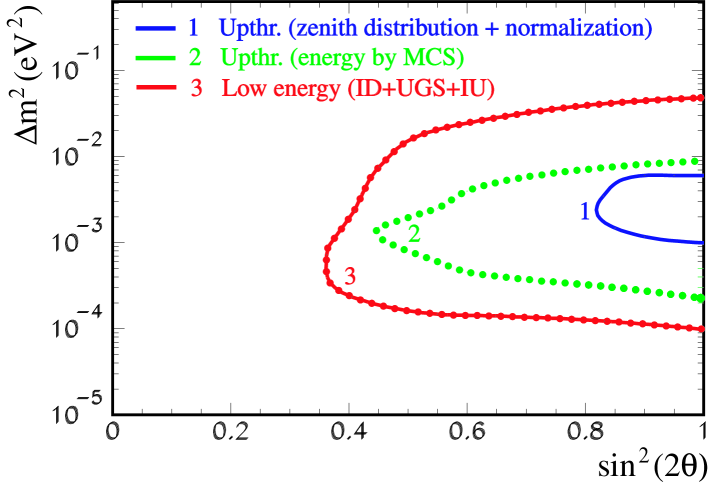
For each event category, the 90% C.L. regions were computed using the Feldman-Cousins procedure [16], Fig. 8. For upthroughgoing muons, we obtained the curve 1 using the angular distribution and the normalization and the curve 2 using only the muon energy reconstructed with the MCS method (Sect. 3.2). For low energy events we used a obtained from the shape of the angular distribution, the total normalization and the ratio between the two topologies of events. The low energy probability contour is the 3 curve in Fig. 8. A global analysis to combine all these informations is still in progress.
6 Conclusions
The MACRO results on atmospheric neutrinos were presented and discussed. For all the categories of neutrino-induced muons detectable by MACRO, the observed zenith angle distributions and the numbers of events (Fig. 4 and Fig. 7) disagree with the predictions of the no oscillation hypothesis. The muon angular distribution and flux are in agreement with the hypothesis of two-flavour oscillations, with maximal mixing and eV2. The hypothesis of oscillations is disfavoured at the 99% C.L.
References
- [1] Pontecorvo B 1957 J Exptl. Theoret. Phys. 33 549.
- [2] Ahlen S et al. (MACRO Coll.) 1993 Nucl. Instr. Meth. A324 337; Ambrosio M et al. (MACRO Coll.) 2002 Nucl. Instr. Meth. A486 663.
- [3] Ahlen S et al. (MACRO Coll.) 1995 Phys. Lett. B357 481; Ambrosio M et al. (MACRO Coll.) 1998 Phys. Lett. B434 451.
- [4] Ambrosio M et al. (MACRO Coll.) 2000 Phys. Lett. B478 5.
- [5] Ambrosio M et al. (MACRO Coll.) 1998 Astrop. Phys. 9 123.
- [6] Agrawal V et al. 1996 Phys. Rev. D53 1314.
- [7] Gluck M et al. 1995 Z. Phys. C67 433.
- [8] Lohmann W et al. 1985 CERN-EP/85-03.
- [9] Lipari P and Lusignoli M 1998 Phys. Rev. D58 073005.
- [10] Ambrosio M et al. (MACRO Coll.) 2001 Phys. Lett. B517 59.
- [11] Bakari D et al. 2001 Proc. of the NATO Advanced Research Workshop, Oujda, Morocco 135.
- [12] Ambrosio M et al. (MACRO Coll.) physics/0203018, subm. to Nucl. Instr. Meth. A.
- [13] Ambrosio M et al. (MACRO Coll.) 1992 Nucl. Instr. Meth. A321 609.
- [14] Giorgini M (for the MACRO Coll.) 2001 Proc. of the 7th ICATPP, Como, Italy.
- [15] Lipari P et al. 1995 Phys. Rev. Lett. 74 4384.
- [16] Feldman G J and Cousins R D 1998 Phys. Rev. D57 3873.