BABAR-PROC-02/047
Measurement of -Violating Asymmetry with the BABAR Detector
Shahram Rahatlou
Department of Physics
University of California, San Diego
9500 Gilman Drive
La Jolla, CA 92093
(for the BABAR Collaboration)
Contributed to the Proceedings of the Flavor Physics and Violation (FPCP),
16-18 May 2002, University of Pennsylvania, Philadelphia
1 Introduction
The Standard Model of electroweak interactions describes violation in weak interactions as a consequence of a complex phase in the three-generation Cabibbo-Kobayashi-Maskawa (CKM) quark-mixing matrix [1]. In this framework, measurements of -violating asymmetries in the time distribution of neutral decays to charmonium final states provide a direct measurement of [2], where .
We report an updated measurement of time-dependent -asymmetries in samples of fully reconstructed decays to charmonium-containing eigenstates (). The data for these studies were recorded at the resonance with the BABAR detector at the PEP-II asymmetric-energy collider at the Stanford Linear Accelerator Center.
We fully reconstruct a sample of neutral mesons, , decaying to several final states. Each event in the is examined for evidence that the recoiling neutral meson decayed as a or (flavor tag). The time distribution of meson decays to a eigenstate with a or tag can be expressed in terms of a complex parameter that depends on both the - oscillation amplitude and the amplitudes describing and decays to this final state [3]. The decay rate when the tagging meson is a is given by
| (1) |
where is the difference between the proper decay times of the reconstructed meson () and the tagging meson (), is the lifetime, and is the - oscillation frequency.
In the Standard Model for charmonium-containing decays and is the eigenvalue of the state . Thus, the time-dependent -violating asymmetry is
| (2) |
with for , , and , and for .
The measurement of with the decay mode is experimentally complicated by the presence of both even (L=0, 2) and odd (L=1) orbital angular momenta in the final state. The decay rate when the tagging meson is a , in addition to , is also a function of the angular distribution of the particles in the final state [4].
2 The BABAR detector
A detailed description of the BABAR detector can be found in Ref. [5]. Charged particles are detected and their momenta measured by a combination of a silicon vertex tracker (SVT) consisting of five double-sided layers and a central drift chamber (DCH), in a 1.5-T solenoidal field. The average vertex resolution in the direction is 70 for a fully reconstructed meson. We identify leptons and hadrons with measurements from all detector systems, including the energy loss () in the DCH and SVT. Electrons and photons are identified by a CsI electromagnetic calorimeter (EMC). Muons are identified in the instrumented flux return (IFR). A Cherenkov ring imaging detector (DIRC) covering the central region, together with the information, provides - separation of at least three standard deviations for decay products with momentum greater than 250 in the laboratory.
3 Data Sample
The data sample used in this analysis consists of approximately , corresponding to about million pairs, collected on the resonance with the BABAR detector at the SLAC PEP-II storage ring between October 1999 and December 2001.
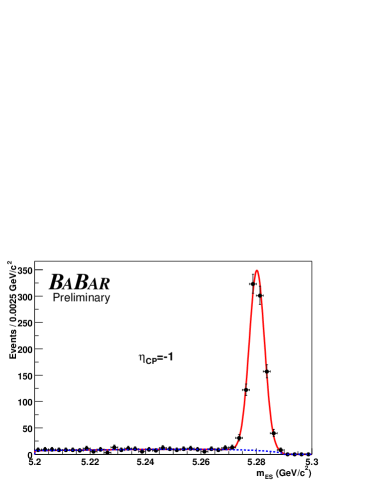
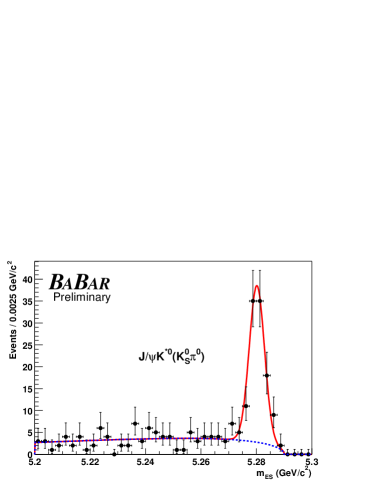
We fully reconstruct candidates in the final states , , , , and as described in Ref. [4]. Figure 1 shows the distribution of the beam-energy substituted mass for final states containing a and for the mode.
4 The Measurement Technique
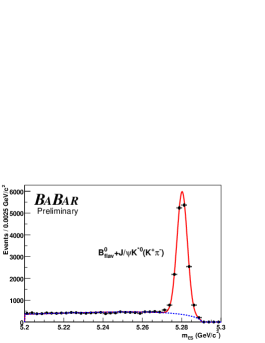
A measurement of requires a determination of the experimental resolution and the fraction of events in which the tag assignment is incorrect. This mistag fraction reduces the observed asymmetry by a factor . Mistag fractions and resolution functions are determined from a large sample of neutral decays to flavor eigenstates consisting of the channels , and and . Figure 2 shows the distribution of the beam-energy substituted mass for this sample.
4.1 Flavor-Tagging Algorithm
The algorithm used to determine the flavor of the tagging meson is described in Ref. [6]. The charges of energetic electrons and muons from semileptonic decays, kaons, soft pions from decays, and high momentum particles are correlated with the flavor of the decaying quark. For example, a positive lepton indicates a tag.
Each event is assigned to one of four hierarchical, mutually exclusive tagging categories or has no flavor tag. A lepton tag requires an electron (muon) candidate with a center-of-mass momentum . This efficiently selects primary leptons and reduces contamination due to oppositely-charged leptons from charm decays. Events meeting these criteria are assigned to the Lepton category unless the lepton charge and the net charge of all kaon candidates indicate opposite tags. Events without a lepton tag but with a non-zero net kaon charge are assigned to the Kaon category. All remaining events are passed to a neural network algorithm whose main inputs are the momentum and charge of the track with the highest center-of-mass momentum, and the outputs of secondary networks, trained with Monte Carlo samples to identify primary leptons, kaons, and soft pions. Based on the output of the neural network algorithm, events are tagged as or and assigned to the NT1 (more certain tags) or NT2 (less certain tags) category, or not tagged at all. The tagging power of the NT1 and NT2 categories arises primarily from soft pions and from recovering unidentified isolated primary electrons and muons.
The tagging efficiencies and mistag fractions for the four tagging categories are measured from data and summarized in Table 1.
| Category | Efficiency (%) | ||
|---|---|---|---|
| Lepton | |||
| Kaon | |||
| NT1 | |||
| NT2 | |||
| All |
4.2 Measurement and Resolution Function
The topology of a typical event is shown in Figure 3.
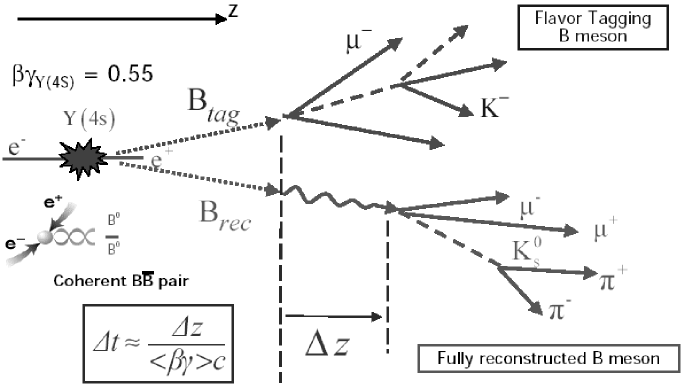
The time interval between the two decays is calculated from the measured separation between the decay vertices of and along the collision () axis [6]. We determine the position of the vertex from its charged tracks. The decay vertex is determined by fitting tracks not belonging to the candidate to a common vertex, employing constraints from the beam spot location and the momentum [6]. We accept events with a uncertainty of less than 2.5 and . The fraction of events satisfying these requirements is 93%. The r.m.s. resolution for 99.5% of these events is 1.1.
The resolution function for the signal is represented in terms of by a sum of three Gaussian distributions with different means and widths:
For the core and tail Gaussians, we use two separate scale factors to multiply the measured uncertainty that is derived from the vertex fit for each event. The scale factor for the tail component is fixed to the value found in simulated data since it is strongly correlated with the other resolution function parameters. The core and tail Gaussian distributions are allowed to have non-zero means to account for any daughters of long-lived charm particles included in the vertex. The mean of the core Gaussian is allowed to be different for each tagging category, but only one common mean is used for the tail component. These offsets are computed from the event-by-event multiplied by a scale factor which accounts for a correlation between the mean of the distribution and observed in simulated events. The outlier Gaussian has a fixed width of ps and no offset; it accounts for less than of events with incorrectly reconstructed vertices. In simulated events we find no significant difference between the resolution function of the and the samples, hence the same resolution function is used for both.
5 Results
We determine with a simultaneous unbinned maximum likelihood fit to the distributions of the tagged and samples. In this fit the distributions of the sample are described by Eq. 1 with . The distributions of the sample evolve according to the known frequency for flavor oscillation in mesons. The observed amplitudes for the asymmetry in the sample and for flavor oscillation in the sample are reduced by the same factor due to flavor mistags. Events are assigned signal and background probabilities based on the (all modes except and ) or () distributions. The distributions for the signal are convolved with the resolution function described in Section 4.2. Backgrounds are incorporated with an empirical description of their spectrum, containing prompt and non-prompt components convolved with a resolution function [6] distinct from that of the signal.
There are 35 free parameters in the fit: (1), the average mistag fractions and the differences between and mistag fractions for each tagging category (8), parameters for the signal resolution (8), and parameters for background time dependence (6), resolution (3), and mistag fractions (8). In addition, we allow (1), which is determined from the events, to vary in the fit [4]. We fix and [7]. The determination of the mistag fractions and resolution function parameters for the signal is dominated by the high-statistics sample. The largest correlation between and any linear combination of the other free parameters is 0.14.
Figure 4 shows the distributions and as a function of overlaid with the likelihood fit result for the and samples. The fit to the and samples yields
The dominant sources of systematic error are the uncertainties in the level, composition, and asymmetry of the background in the selected events (0.022), limited Monte Carlo simulation statistics (0.014), and the assumed parameterization of the resolution function (0.013), due in part to residual uncertainties in the internal alignment of the vertex detector. Uncertainties in and each contribute 0.010 to the systematic error.


The large sample of reconstructed events allows a number of consistency checks, including separation of the data by decay mode, tagging category and flavor. The results of fits to some subsamples and to the samples of non- decay modes are shown in Table 2. For the latter, no statistically significant asymmetry is found.
| Sample | Purity (%) | ||
| ,, | |||
| Full sample | |||
| non- sample | |||
| Charged non- sample |
With the theoretically preferred choice of the strong phases, consistent with the hypothesis of the -quark helicity conservation in the decay [8], the parameter is measured to be [4].
If the parameter in Eq. 1 is allowed to float in the fit to the sample, which has high purity and requires minimal assumptions on the effect of backgrounds, the value obtained is . The sources of the systematic error are the same as for the measurement with an additional contribution in quadrature of 0.012 from the uncertainty on the difference in the tagging efficiencies for and tagged events. In this fit, the coefficient of the term in Eq. 1 is measured to be in agreement with Table 2.
6 Summary
We have presented a new preliminary measurement of -violating asymmetry using a sample of fully reconstructed mesons decaying into final states.
Ever since this Conference we have further improved the analysis and updated our measurement [10]. Changes in the analysis with respect to the result presented here include a new flavor-tagging algorithm and the addition of the decay mode . The new result improves upon and supersedes the result presented at this Conference and provides the most precise measurement of currently available. It is consistent with the range implied by measurements and theoretical estimates of the magnitudes of CKM matrix elements in the context of the Standard Model [11].
References
- [1] N. Cabibbo, Phys. Rev. Lett. 10, 531 (1963); M. Kobayashi and T. Maskawa, Prog. Th. Phys. 49, 652 (1973).
- [2] A.B. Carter and A.I. Sanda, Phys. Rev. D23, 1567 (1981); I.I. Bigi and A.I. Sanda, Nucl. Phys. B193, 85 (1981).
- [3] See, for example, L. Wolfenstein, Phys. Rev. D66, 010001 (2002).
- [4] BABAR Collaboration, B. Aubert et al., SLAC-PUB-9153, hep-ex/0203007.
- [5] BABAR Collaboration, B. Aubert et al., Nucl. Instr. and Methods A479, 1 (2002).
- [6] BABAR Collaboration, B. Aubert et al., SLAC-PUB-9060, hep-ex/0201020, to appear in Phys. Rev. D .
- [7] Particle Data Group, D.E. Groom et al., Eur. Phys. Jour. C 15, 1 (2000).
- [8] M. Suzuki, Phys. Rev. D64, 117503 (2001).
- [9] BABAR Collaboration, B. Aubert et al., Phys. Rev. Lett. 87, 091801 (2001).
- [10] BABAR Collaboration, B. Aubert et al., SLAC-PUB-9293, hep-ex/0207042, submitted to Phys. Rev. Lett. .
- [11] See, for example, F.J. Gilman, K. Kleinknecht and B. Renk, Eur. Phys. Jour. C 15, 110 (2000).