2. Dipartimento di Fisica dell’Università di Bologna and INFN, 40126 Bologna, Italy
3. Physics Department, Boston University, Boston, MA 02215, USA
4. California Institute of Technology, Pasadena, CA 91125, USA
5. Department of Physics, Drexel University, Philadelphia, PA 19104, USA
6. Laboratori Nazionali di Frascati dell’INFN, 00044 Frascati (Roma), Italy
7. Laboratori Nazionali del Gran Sasso dell’INFN, 67010 Assergi (L’Aquila), Italy
8. Depts. of Physics and of Astronomy, Indiana University, Bloomington, IN 47405, USA
9. Dipartimento di Fisica dell’Università dell’Aquila and INFN, 67100 L’Aquila, Italy
10. Dipartimento di Fisica dell’Università di Lecce and INFN, 73100 Lecce, Italy
11. Department of Physics, University of Michigan, Ann Arbor, MI 48109, USA
12. Dipartimento di Fisica dell’Università di Napoli and INFN, 80125 Napoli, Italy
13. Dipartimento di Fisica dell’Università di Pisa and INFN, 56010 Pisa, Italy
14. Dipartimento di Fisica dell’Università di Roma ”La Sapienza” and INFN, 00185 Roma, Italy
15. Physics Department, Texas A&M University, College Station, TX 77843, USA
16. Dipartimento di Fisica Sperimentale dell’Università di Torino and INFN, 10125 Torino, Italy
17. L.P.T.P, Faculty of Sciences, University Mohamed I, B.P. 524 Oujda, Morocco
18. Dipartimento di Fisica dell’Università di Roma Tre and INFN Sezione Roma Tre, 00146 Roma, Italy
19. Department of Physics, Sant Longowal Institute of Engg. & Tech., Longowal 148 106, India
Also Università della Basilicata, 85100 Potenza, Italy
Also INFN Milano, 20133 Milano, Italy
Also IASF/CNR sez. Bologna, 40129 Bologna, Italy
Also Università di Trieste and INFN, 34100 Trieste, Italy
Also Dipartimento di Energetica, Università di Roma, 00185 Roma, Italy
Also Institute for Space Sciences, 76900 Bucharest, Romania
Macalester College, Dept. of Physics and Astr., St. Paul, MN 55105
Also Department of Physics, Pennsylvania State University, University Park, PA 16801, USA
Also Dipartimento di Fisica dell’Università della Calabria, Rende (Cosenza), Italy
Also RPD, PINSTECH, P.O. Nilore, Islamabad, Pakistan
Also Dipartimento di Scienze e Tecnologie Avanzate, Università del Piemonte Orientale, Alessandria, Italy
Also U. Minn. Duluth Physics Dept., Duluth, MN 55812
Also Dept. of Physics, MIT, Cambridge, MA 02139
Also Intervideo Inc., Torrance CA 90505 USA
Also Resonance Photonics, Markham, Ontario, Canada
Final results of magnetic monopole searches with the MACRO experiment
Abstract
We present the final results obtained by the MACRO experiment in the search for GUT magnetic monopoles in the penetrating cosmic radiation, for the range . Several searches with all the MACRO sub-detectors (i.e. scintillation counters, limited streamer tubes and nuclear track detectors) were performed, both in stand alone and combined ways. No candidates were detected and a Confidence Level (C.L.) upper limit to the local magnetic monopole flux was set at the level of cm-2 s-1 sr-1. This result is the first experimental limit obtained in direct searches which is well below the Parker bound in the whole range in which GUT magnetic monopoles are expected.
1 Introduction
Within the framework of Grand Unified Theories (GUT) of the strong and electroweak interactions, supermassive magnetic monopoles (MMs) with masses GeV/c2 could have been produced in the early Universe as intrinsically stable topological defects at the phase transition in which a simple gauge symmetry left an unbroken U(1) group monorev . At our time they can be searched for in the penetrating cosmic radiation as “fossil” remnants of that transition. The detection of such a particle would be one of the most spectacular confirmation of GUT predictions.
The velocity range in which GUT magnetic monopoles should be sought spreads over several decades. If sufficiently heavy (GeV/c2), GUT magnetic monopoles would be gravitationally bound to the galaxy with a velocity distribution peaked at monorev . MMs trapped around the Earth or the Sun are expected to travel with and , respectively.
Intermediate mass MMs () could have been produced in later phase transitions in the early Universe at a lower energy scale shafi ; lighter magnetic monopoles, with masses around GeV/c2, would be accelerated to relativistic velocities in one or more coherent domains of the galactic magnetic field, or in the intergalactic field, or in several astrophysical sites like a neutron star lightMM .
Theory does not provide definite predictions on the magnetic monopole abundance. However, by requiring that MMs do not short-circuit the galactic magnetic field faster than the dynamo mechanism can regenerate it, a flux upper limit can be obtained. This is the so-called Parker bound (cm-2s-1sr-1 parker ), whose value sets the scale of the detector exposure for MMs search. The original Parker limit was re-examined to take into account the almost chaotic nature of the galactic magnetic field, with domain lengths of about kpc; the limit become mass-dependent. An Extended Parker Bound (EPB) at the level of cm-2s-1sr-1 was obtained epb .
MACRO was a large multipurpose underground detector located in the Hall B of the Laboratori Nazionali del Gran Sasso (Italy); it was optimized for the search for GUT magnetic monopoles with velocity and with a sensitivity well below the Parker bound. The detector, which took data up to December 2000, is fully described in primosm ; techpap . It was arranged in a modular structure, it was divided into six m3 sections referred to as SuperModules (SM), each one with separate mechanical structure and electronics readout. The detector’s global dimensions were m3 and its total acceptance for an isotropic flux of particles was m2sr.
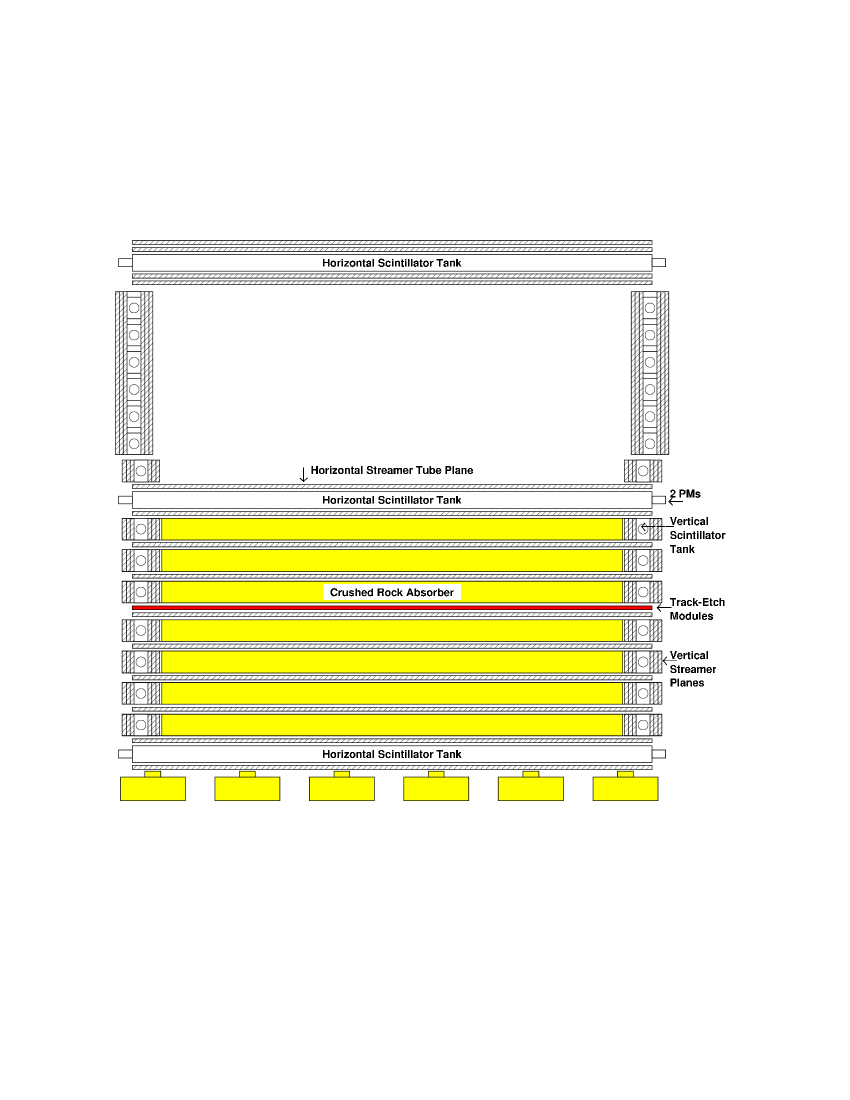
Redundancy and complementarity were the primary features in designing the experiment. Since we could not reasonably expect more than a few MMs during the detector lifetime, we deemed crucial to have multiple signatures and the ability to perform cross checks among various parts of the apparatus. To accomplish this, the detector consisted of three independent sub-detectors: liquid scintillation counters, limited streamer tubes and nuclear track detectors, each of them with dedicated and independent hardware. In Fig. 1 a cross sectional view of the apparatus is shown. Also visible are the seven horizontal absorber layers (which set at GeV the minimum energy threshold for throughgoing muons); notice the separation of the detector into a lower and an upper detector (the attico).
The background that magnetic monopole searches have to fight with is mainly due to muons of the cosmic radiation and natural radioactivity. Thus large detectors have to be installed in underground laboratories. At Gran Sasso the minimum thickness of the rock overburden above the detector is 3150 hg/cm2. The cosmic radiation muon flux in Hall B is m-2h-1, almost a factor smaller than that at the surface (only muons with minimum energy of TeV can cross the mountain and reach MACRO) with an average muon residual energy of GeV trd .
The signatures of the passage of a GUT magnetic monopole across the detector depend strongly on its velocity monorev ; boeloss . For this reason, different hardware systems were designed and operated to give optimum sensitivity in different values. Different analysis strategies were also adopted, depending on the range of interest and the subdetector(s) used; the entire MM range () was thus covered. In the different analyses we took into account both the MM signatures and the background characteristics.
The unique property of a fast magnetic monopole with monorev ; boeloss is its large ionization power compared either to the considerably slower magnetic monopoles or to the minimum ionizing electrically charged particles. The searches for fast MMs look for large energy releases in the detectors; the background is mainly due to high energy muons with or without an accompanying electromagnetic shower. On the other hand, slow magnetic monopoles should leave small signals spread over a large time window; a monopole could have a Time of Flight (ToF) across the detector as large as ms. This implies the use of specific analysis procedures that allow the rejection of the background mainly due to radioactivity induced hits and possible electronic noise.
In this paper we report the final results of several magnetic monopole searches performed with MACRO (Sect. 2); some early results were already published in monopap1 . In each Section we discuss the analysis criteria together with the results of each search; technical details may be found in various papers fully describing the procedures and their application to the first data samples hong ; phraserp ; stmono ; track ; fastcomb . In Sect. 3 the result of the combination of all the various searches is reported. In order to compare the MACRO results to those of other experiments or to theoretical models, we present upper limits for an isotropic flux of bare MMs with magnetic charge equal to one Dirac charge , (where is the electron charge and the fine structure constant) and nucleon decay catalysis cross section smaller than 1 mb monorev . These aspects are discussed in Sect. 4, the conclusions are given in Sect. 5. A dedicate analysis for the search for magnetic monopoles accompanied by one or more nucleon decays along their path was also performed. The results are reported in a separate paper catalysis .
2 Experimental searches
2.1 Searches with Scintillators
The MACRO liquid scintillator system was organized in three layers of horizontal and four layers of vertical counters, as shown in Fig. 1. For atmospheric muons crossing the apparatus this system provided particle position, energy deposition and ToF resolutions of about 11 cm, 1 MeV and 700 ps, respectively. The response of liquid scintillators to heavily ionizing particles was studied both experimentally ficenec and theoretically Ahlen1 ; Ahlen2 ; ahlentarle and their sensitivity to particles with down to was directly measured.
2.1.1 Wave Form Digitizer (WFD) analysis
Slow moving magnetic monopoles (in the range ) were searched using dedicated hardware, the Slow Monopole Trigger (SMT) and a 200 MHz custom-made Wave Form Digitizer (WFD) system. The main goal of the SMT was to remain sensitive over the entire range of widths and amplitudes of pulses (which could as well be just a train of single photoelectron pulses lasting over several microseconds) expected for slow moving magnetic monopoles while suppressing efficiently narrow (10 - 50 ns) pulses due to isolated radioactivity and cosmic ray muons. The SMT by itself offered only a hit register that recorded the scintillator counters that satisfied the trigger conditions. The photomultiplier tube (PMT) pulse shape information was recorded by a custom made 200 MHz WFD system. Redundant time-of-flight (TOF) information for every candidate event was recorded by a stand-alone TDC. The design and implementation of the triggering and recording electronics used by this search has been described in detail elsewhere primosm ; techpap .

The heart of this slow MM search was the analysis of the digitized PMT signals as recorded by the 200MHz WFDs. Several wave form analysis methods have been employed in the search for slow MM searches in the initial data taking and results from these have been reported elsewhere hong . In this final search the SMT hardware primosm ; techpap was used as the pattern recognition method for identifying a magnetic monopole candidate event sophia .
The sensitivity of the trigger hardware as well as of the entire slow MM analysis was measured experimentally in situ and multiple times throughout MACRO’s live time via LED light injection in each of the scintillation counters. The LED calibration system primosm ; techpap allowed the generation of a magnetic monopole-like signal in the detector of arbitrary direction, ionization yield and velocity. A grid of LED pulse widths and heights allowed the generation of MM-like PMT pulses on a channel-by-channel basis. The corresponding -range is and the light yield from few photoelectrons up to several times the yield of a muon. The generated wave forms were recorded by the WFD system independently of whether the SMT fired or not. Then, an off-line wave form analysis (the same used to analyze the real events) established the ratio of the events that the SMT had selected over the ones expected. This yielded the trigger sensitivity as a function of the particle’s velocity and it is shown in Fig. 2. More than of the detector’s channels exhibited efficiency above for light yields greater or equal the ones defined by the curve. The generated MM-like signals were then fed into the analysis wave form selection algorithm in discussion. The stars in Fig. 2 show the analysis efficiency, when more that of the simulated MM-like wave forms –corresponding to lights yields and velocities across the expected range– were successfully identified by the analysis algorithm.
There were three main instrumental sources which caused the hardware trigger to be less efficient than a software one: (a) electronics were operating at a very low threshold (2 mV) making them susceptible to ground loops and low amplitude interference; (b) electronics suffered from intrinsic pulse streching that may overestimated pulse duration; (c) helium and hydrogen contamination in the PMT envelope increased its activity, leading sometime to overestimate of pulse duration. A software pattern recognition method corrects for them, and the efficiency of this algorithm is folded in the trigger efficiency already discussed.
Magnetic monopole candidate events were selected as follows. The hardware trigger (SMT) was required to be present in at least two of the detector faces and within 1msec. This rejects mainly noise and radioactivity induced events. The two layers requirement reduces by the detector’s acceptance. The TOF requirement of 1 msec was dictated by the hardware, namely the mode of operation of the WFD system primosm ; techpap . The presence of the scintillator’s fast particle trigger was then used as a veto. The fast coincidence (1 s) between faces required by this trigger selects particle tracks corresponding to well above the SMT’s sensitivity (Fig. 2). It rejects mainly cosmic ray muons that triggered the SMT either due to pulse stretching or afterpulsing. A final loose cut on the hits per face (less than 4) and number of layers (less than 5) was applied to reject events induced by electronic noise, multi-muon or muon shower events. None of these requirements is expected to affect the sensitivity to slow MMs while any effect on the acceptance has been taken into account in the Monte Carlo. After applying the above cuts on the dataset of 4.75 years of data-taking and 28 million SMT’s, there were 35901 events left. These were attributed to cosmic ray muons () and electronic noise () leaking out of our fast particle and loose noise/high multiplicity veto. These events were further analyzed by our wave form analysis method.
The wave form analysis required that PMT signals satisfied the pattern recognition criteria on an end-to-end, face-to-face basis. 40 events survived. (There was an initial running of the detector that suffered from wave form memory saturation and effectively wave form loss. 14 events involving primarily large ionizations were allowed to pass this stage of the analysis).
The 40 remaining candidates were individually analyzed using all available information from the scintillator sub-system (the wave form shape, timing information from the wave forms, timing information from the precise muon system -ERP- and from the SMT TOF system) techpap . None of the events was compatible with the passage of a slow MM. Instead, based on information available from both the scintillator and the streamer tube sub-systems, the 40 events were classified as follows:
-
•
25 as bipolar electronic noise; using primarily the WFD information, they are distinguished from a genuine MM signal due to the preciable amount of positive content in the waveforms (PMTs operated with negative voltage).
-
•
10 as muon-induced showers; using primarily the fast muon and occasionally WFD TOF information, these events reflect fast crossing of the apparatus that failed to fire the fast particle veto.
-
•
4 as probably spurious electrostatic discharges of the LED system; using primarily geometrical arguments reflecting the inconsistency of the event with the passage of a monopole crossing the detector at a straight line at a constant velocity, and finally,
-
•
the “spokesmen even”. This event belongs to a particular run in which a LED-induced event (simulating a close to a realistic MM) was intentionally and secretly generated to test the efficiency of our analyses to detect a MM signal. The two analyses that should have been sensitive to the faked “spokesmen” MM (the present analysis, and the PHRASE one), found the event. The “spokesmen event” was a LED-generated event and was subject to the limitations the LED system had in generating a MM-like pulse, namely its slow rise-time.
No event was compatible with the passage of a single slow magnetic monopole. The analyzed data were collected in the period July 1995 – May 2000, corresponding to live-years. The detector performance during the data-taking period was monitored on a run-by-run basis. The total exposure was . By taking into account the trigger and analysis efficiencies we obtained a C.L. flux upper limit of cm-2s-1sr-1 for (curve “WFD” in Fig. 8) sophia .
2.1.2 The PHRASE analysis

Magnetic monopoles in the velocity range were searched for using the PHRASE (Pulse Height Recorder And Synchronous Encoder) system. It was a trigger and energy reconstruction processor which generated a trigger condition when the energy deposition in a scintillator was larger than a preset threshold, primosm ; collasso ; sorgente .
The energy deposition was reconstructed by integrating the photomultiplier pulses (recorded by a Wave Form digitizer system), taking into account their relative amplitudes, the response functions of the scintillation counters and the liquid scintillator, photomultiplier and electronic saturation effects. All these points were studied in detail by using laser light of various intensities and atmospheric muon pulses; appropriate algorithms were developed for correcting any nonlinearity which may be present in large energy loss rates as those expected from magnetic monopoles in the analyzed -range. The analysis technique is described in detail in phraserp .
The magnetic monopole candidate selection required hits in two scintillator layers and a minimum energy deposit of in each of them, spread out over no more than four adjacent boxes (this cut removed most of the natural radioactivity background but not atmospheric muons). The sampling frequency of the PHRASE Wave Form digitizers and the energy cut defined the minimum MM velocity which this search was sensitive to: . The velocity of a particle was reconstructed by using the TOF between the crossed scintillator layers; a minimum distance of between the hits was required to ensure accurate timing reconstructions. The timing and position uncertainties produced a tail in the muon velocity distribution which is peaked at . Atmospheric muons were rejected by setting the upper limit for the magnetic monopole analysis to . Finally, a minimum path length of was required in each scintillation counter (the typical path length for a crossing cosmic ray muon was ). All geometrical cuts were taking into account in computing the detector acceptance.
The candidates surviving the selection (a few thousands in years of running) were grouped in two overlapping sub-ranges, medium () and high () velocities. This was motivated by the fact that the MM light yield and crossing time (with respect to muons) differ significantly in these two regimes. Crossing muons released in each traversed scintillation layer, with a pulse width of due to the convolution between the time profile of the scintillation light emission and propagation and the PMT time jitter. The pulse width expected from a magnetic monopole in the medium range, corresponding to the time needed to cross a counter, is . In the high range the expected counter crossing time is ; thus the corresponding pulse width is comparable to that of a muon. The expected energy loss rate, for MMs in the medium range, is times larger than that of a muon, and times for MMs in the higher range.
For candidates with we compared the measured pulse width with the expected counter crossing time. The counter crossing time was calculated from the measured , assuming a minimum pathlength in the scintillation counter of 15 cm (Fig. 3).
For a particle crossing the detector with the measured velocity these two numbers must be consistent. No final candidates satisfied this condition with the exception of the LED simulated “spokesmen” magnetic monopole introduced in the data (see sec. 2.1.1).
For candidates with we compared the energy loss rate (computed with the assumption of a fixed path length in the scintillator) with that expected for a MM ficenec ; ahlentarle (see Fig. 4).

The range was extended down to to obtain an independent cross-check of the rejection based on the counter crossing time criterion for the candidates at the boundary between the two sub-intervals. In no case the energy deposition of a candidate was consistent with that expected for a monopole of the same apparent velocity.
In this search magnetic monopole candidates were categorized on the basis of the streamer tube and scintillator information. No event exhibits the pattern of a single particle crossing the detector at the measured velocity; the velocity values were artifacts due to uncommon classes of events. A fraction of candidates () comes from occasional timing errors, which produced an apparent low value for the velocity of a cosmic ray muon crossing the apparatus. In a larger fraction of cases (), the low velocity value comes from accidental coincidences, within the allowed time window, between radioactivity hits and/or a cosmic ray muon occurring in different scintillator layers. The remaining candidates are due to cosmic ray muons which crossed a scintillator layer and stopped just before reaching a second one. The decay electron produces a hit in this second layer, with a typical time delay (corresponding to the muon life time) with respect to the first hit.
This analysis was applied to the whole data set collected from October 1989 to June 1995 with the lower part of the detector, and with the full detector up to December 2000. The detector acceptance was computed by a Monte Carlo simulation, which takes into account the fraction of apparatus effectively in acquisition in each individual run. The total exposure was . By taking into account the trigger and analysis efficiencies we obtain a C.L. flux upper limit for , which is represented by curve “PHRASE” in Fig. 8.
2.2 Searches with Streamer Tubes
The streamer tube system was designed to be effective in the search for magnetic monopoles in a wide velocity range, . For this purpose we used a gas mixture containing helium and n-pentane. Helium is necessary to exploit the Drell effect drellpate : the passage of a magnetic monopole with through a helium atom leaves it in a excited metastable state. The n-pentane can then be ionized by collision with excited helium atoms (Penning effect). The high cross section for the processes ensures 100% efficiency in detecting bare MMs with this gas mixture.
In the higher velocity region (), where the assumptions used in the Drell-Penning effects do not apply, the standard ionization mechanism expected for a MM ensures an energy release several orders of magnitude higher than that due to minimum ionizing particles. The charge collected on a wire has a logarithmic dependence on the energy released inside the active cell gbation ; laser , so that a charge measurement allowed one to distinguish between MMs and muons.
Horizontal streamer tubes were equipped with readout strips in order to provide a three dimensional event reconstruction. The memory depth of the readout electronics was large enough to store signals for monopoles with down to . In order to retrieve spatial coordinates, signals were shaped at s and sent to parallel-in/serial-out shift register chains for readout. Analog ORs of wire signals (covering 1 m for central planes and 0.5 m for lateral planes) were fed to the Charge and Time Processor (QTP) system for arrival time and charge measurement of the streamer signals primosm ; techpap . The trigger was based on the assumption that a heavy MM crossed the apparatus without any appreciable change in its direction and speed, due to its large kinetic energy. In designing the trigger logic, particular attention was given to avoiding the possibility that relativistic decay products from magnetic monopole induced nucleon decay, could cause dead-time in the apparatus before the MM generated the trigger ivan .
Horizontal and vertical streamer tube planes were handled by two independent trigger systems. Monte Carlo simulations have shown that they were basically complementary. Two analysis were performed using data collected with the two different triggers; all streamer tubes were used for the event reconstruction. Both analyses were based on the search for single tracks and on the measurement of the particle velocity by using the time information provided by the streamer tubes (maximum time jitter ns) stmono . Detailed investigations were performed in order to check that both trigger logics and analysis efficiencies were independent of the particle velocity.
2.2.1 Search with horizontal streamer tubes
This analysis technique is described in details in stmono . The assumpition made in the trigger design allows the trigger logic to be sensitive to any massive particle able to produce a signal in the streamer tubes. The streamer tubes time resolution allows identification of slow particles by measuring their time of flight across the apparatus (“time track”). However, because of time jitter and afterpulsing in the streamer tubes, particles faster than could be confused with cosmic ray muons.
The analysis was based on the search for single space tracks in both wire and strip views and on the measurement of the velocity of the candidates. The width of the temporal window is so large that on average three spurious hits (due to the 40 Hz/m2 background on streamer tubes) are present in a m2 plane per event. The trigger logic selected events with an alignment in (the vertical coordinate) versus time of at least seven streamer tube planes in one or more of 320 time windows (called -slices). Each -slice covered a TOF window of 3 s and provided a rough estimate of the particle time of flight across the apparatus.
The TOF value provided by the trigger allowed a discrimination of the streamer tube hits from a real track, from the spurious hits recorded in the s memory depth of the readout electronics. If a space track was found, a more refined alignment in the temporal view was required (“time track”). This rejected effectively the background from radioactivity and the background from relativistic muons combined accidentally with some radioactivity hits.
The muon provided the spatial track, while the radioactivity hits may confuse the time tracking algorithm. Such events were rejected using a cut on the measured velocity. In fact, they were tagged with both the first -slice (that of relativistic muons) and with a higher -slice value (that of slow particles). For particles crossing the lower detector (path length 5 m) the above condition corresponds to a cut for all particles with (5 m/3 s)/c = 5.
The sensitivity of the trigger to relativistic muons provided a simple and efficient way to estimate the overall efficiency of this analysis. Muons crossing at least seven horizontal streamer tube planes survived all the analysis steps and were only rejected by the final -cut. The efficiency of the analysis was then estimated by the ratio of the number of reconstructed muons to the expected number of single muons crossing at least seven planes. A further possible source of inefficiency were failures in the trigger circuits . This effect was not accounted for by the above procedure, because muons were concentrated in the first -slice. The efficiencies and , were completely described in stmono .
This analysis used the data sample collected with the horizontal streamer tube trigger from January 1992 to September 2000, integrating a livetime of 8.1 years. The overall average efficiency was . The detector acceptance, computed by a Monte Carlo simulation which included geometrical and trigger requirements, was m2sr.
No monopole candidates were found. For the flux upper limit is cm-2 s-1 sr-1 at C.L. (Fig. 8, curve “stream. H”).

2.2.2 Search with vertical streamer tubes
Like in the search with horizontal streamer tubes, also in this case, the reconstruction procedure started from time and space information provided by the trigger. These were used to select hits compatible in both time and position with the -slice that fired. Using these time-position hits, we performed a complete space and time tracking of each events to reject accidental alignments; this leaves only the muon background. This was also used to evaluate the efficiencies. The spatial and temporal reconstruction algorithms are the same as those used in the horizontal analysis. On the basis of the overall event reconstruction in the 3 spatial views () and in the () view, it was possible to achieve the complete geometrical and temporal reconstruction of the particle track and to compute its . The spatial view corresponds to the horizontal streamer tube wire view; the view corresponds to the horizontal streamer tube strips and the view corresponds to that of the lateral (vertical) streamer tube wire view. Finally the view is the temporal view along the vertical direction. As for the search with horizontal streamer tubes, muons are rejected if see Fig. 5.
The analysis efficiency was estimated with the same approach used for the horizontal streamer monopole search.
The search covered data from October 1994 to September 2000 for a total of 4.4 liveyears. The overall average efficiency was . The acceptance, estimated by Monte Carlo simulation, was m2sr. The measured distribution, shown in Fig. 5, is broader than the one obtained from the horizontal analysis (see stmono for comparison). This limited the sensitivity of this search to the velocity range . No magnetic monopole candidate was found. We thus establish an upper limit to the monopole flux cm-2 s-1 sr-1 for (Fig. 8, curve “stream.V”).
2.3 Searches with the Track-Etch detector
The MACRO nuclear track subdetector primosm ; techpap covered a total area of 1263 m2 and was organized in stacks (“wagons”) of cm2 consisting of three layers of CR39, three layers of Lexan and an aluminum absorber placed in an aluminized Mylar bag filled with dry air.
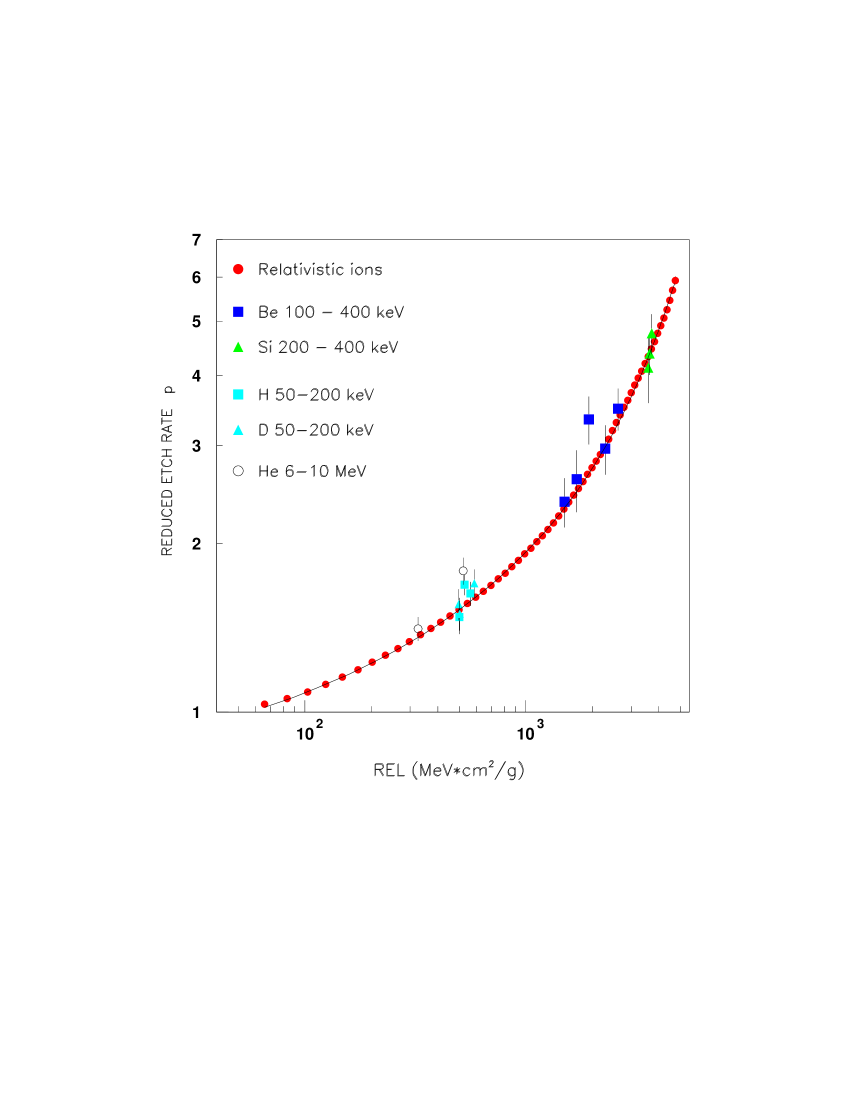
The formation of an etchable track in a nuclear track detector is related to the Restricted Energy Loss (REL) track . There are two contributions to REL: the electronic energy loss (), which represents the energy transferred to the electrons, and the nuclear energy loss (), which represents the energy transferred to the nuclei in the material. In cr39 it was shown that in our CR39 is as effective as in producing etchable tracks. The response of a nuclear track detector is measured by the reduced etch rate , where and are the etching rates along the particle track and of the bulk material, respectively calib . The reduced etch rate vs REL for our CR39 is shown in Fig. 6, it was measured using both relativistic and slow (down to ) ions cr39 .
The CR39 allowed a search for magnetic monopoles of different magnetic charges and . For a single Dirac charge, our CR39 is sensitive for MM in the ranges and boeloss . Lexan has a much higher threshold making it sensitive to relativistic MMs only ().
Our CR39 was manufactured by the Intercast Europe Co. of Parma (Italy). A specific production line was set up in order to achieve a low detection threshold, high sensitivity in a large range of energy losses, high quality of the post-etched surface after prolonged etching and stability of the detector response over long periods of time Produz .
We analyzed 845.5 m2 of the MACRO CR39 track-etch sub-detector, with an average exposure time of 9.5 years. Since no candidates were found, the Lexan foils were not analyzed. The top CR39 foils were strongly etched in a 8N NaOH water solution at 85∘C till their final thickness reached 300-400 . The signal looked for was a hole or a biconical track with the two base cone areas equal within experimental uncertainties.
After etching, the foils were scanned twice, using back lighting by different operators at low magnification looking for any possible optical inhomogeneity; the double scan guarantees an efficiency close to for finding an etched hole. Detected inhomogeneities were further observed with a stereo microscope and were classified either as surface defects or as particle tracks. The latter were further observed under an optical microscope with high magnification. The axes of the base-cone ellipses in the top and bottom surfaces of the foils were measured and the corresponding and incidence angle computed. A track was defined as a candidate if and on the top and bottom sides were equal to within 15%. At a residual thickness of 300-400 , double etch-pit tracks could be induced by proton recoils from neutron interactions or by low energy nuclei from muon interactions in the material surrounding the apparatus.
For the few candidates remaining after the analysis of the first sheet (an average of 5/m2), we looked for a coincidence in position, angles and RELs in the third (bottom) CR39 layer. The second foil was etched in 6N NaOH water solution at 70 ∘C for 30 hours. An accurate scanning at high magnification was performed within an area of about 1 mm2 around the expected position of the candidate.
We estimate a global efficiency of the procedure of 99. No two-fold coincidence was found, that is no magnetic monopole candidate was detected. The 90% C.L. flux upper limits are at the level of cm-2s-1sr-1 for magnetic monopoles with and cm-2s-1sr-1 for magnetic monopoles with (Fig. 8, curves “CR39”).
2.4 Combined search for fast magnetic monopoles
A search for fast magnetic monopoles with scintillators or streamer tubes alone was affected by the background due to high energy muons with large energy losses in the detector. This background could be reduced by a combination of geometrical and energy cuts imposed on each of the sub-detectors. A combined analysis, based on all three subsystems, allowed the use of these cuts in a rather conservative way. Moreover, any systematic error was greatly reduced by the combination of measurements from the three subsystems. The redundancy and complementary offered by the MACRO detector allowed a good rejection power against the background and a high reliability of possible candidates.

The analysis procedure is fully described in fastcomb . It used the data taken with the scintillator and the streamer tube sub-detectors to identify candidate events. This was done by reconstructing the energy release (using the scintillators’ Energy Reconstruction Processor –ERP– and the streamer tube Charge and Time Processor – QTP primosm ; techpap ) and the particle’s trajectory (using the streamer tubes’ digital hit information). Any remaining events were then searched for in the track-etch layers as a final tool for their rejection or confirmation. The trigger selection criteria required at least one fired scintillation counter and 7 hits in the horizontal streamer planes of the lower subdetector stmono . Once the event tracking was performed, the value of the energy lost in the scintillator intercepted by the track was reconstructed using the ERP system. The reconstructed energy in each selected scintillation counter was required to be MeV. The minimum light yield by a MM in 10 cm pathlength in the scintillator is 230 MeV. A further selection was applied on the streamer tube pulse charge by using the multiple measurements provided by QTPs along the particle trajectory.
A cut fastcomb was applied on the event average streamer charge, by exploiting the logarithmic dependence of the streamer charge on the primary ionization gbation ; laser .
In the analyzed data set, seven events survived the cuts. For these events the track-etch wagons identified by the streamer tracking system were extracted and analyzed. No track compatible with the crossing of a MM was found. As a further check, for each candidate, the measured value of the energy lost in the scintillation counters was compared with the expected signal of a magnetic monopole of the same velocity ficenec ; ahlentarle . This comparison is shown in Fig. 7. For three of the seven events, the TOF information was provided by the streamer system alone, since only one scintillation counter was present. In this case the error on the reconstructed velocity is large because of the limited time resolution (3 s) of the streamer tubes. For all the events the measured energy losses were well below the expectations for a MM.

The analysis referred to about 4.8 live years; the maximum geometrical acceptance, computed by Monte Carlo methods, including all the analysis requirements, was 3565 m2 sr. The average global efficiency was .
Since no candidate survived, we set a C.L. flux upper limit at cm-2 s-1 sr-1 (presented in Fig. 8 as curve “stream. + scint.”) for magnetic monopoles with . The analysis ends at since for Lorentz factor magnetic monopoles might induce showers in the detector, reducing the analysis efficiency fastcomb .
3 The global MACRO limit
No magnetic monopole candidates were found in any of the above mentioned searches. Since any one of the sub-detectors may rule out, within its own acceptance and sensitivity, a potential candidate, a global limit was computed by combining together the limits obtained by the single analyses. The final MACRO limit and the limits obtained by the single subdetectors are given in Tab. 1 and shown in Fig. 8.
| Flux upper Limits ( cm2 s-1 sr-1) | |||||||
| range | CR39 | WFD | Stream. H | Stream. V | PHRASE | Stream.+scint. | Global |
| 3.1 2.1 | 3.1 2.1 | ||||||
| 2.8 | 2.7 | 1.6 | |||||
| 2.2 7.5 | 2.5 | 2.8 | 7.9 | 1.3 1.5 | |||
| 2.5 | 2.8 | 7.9 | 1.6 | ||||
| 2.52.6 | 2.8 | 7.9 | 2.2 | 1.4 | |||
| 7.5 3.9 | 2.62.9 | 2.8 | 7.9 | 2.2 | 1.3 | ||
| 3.9 3.1 | 2.93.1 | 2.8 | 7.9 | 2.2 | 1.6 | ||
| 3.1 2.8 | 2.8 | 2.2 | 5.5 | 1.6 1.66 | |||
| 2.8 1.5 | 2.2 | 5.5 | 1.8 1.5 | ||||
| 1.5 | 5.5 | 1.4 | |||||
Each search “” produced a C.L. flux limit given by , where is the analysis time integrated acceptance. In order to obtain the global MACRO limit, we divided the full interval in a number of slices sufficient to characterize the changes in the individual acceptances. We required that the significance of the global limit (in terms of C.L.) is not altered.
In order to illustrate the algorithm, suppose that in a specific slice there are two analyses, “1” and “2”, based on the use of two sub-detectors during the same period of time. We consider analysis “1” as “dominant” in the sense that it contributes with its full time integrated acceptance to the global time integrated acceptance . Analysis “2” then contributes to the global limit only with its independent parts relative to “1”. We consider both the temporal independence as well as the spatial (geometric) independence versus the dominant analysis. The temporal independence is determined by comparing the “time efficiencies” of the analyses, defined as the ratios of each analyses live time to the covered solar time. If , the coefficient representing the temporal independence of “2” versus “1” is ; otherwise, . In the case of the track-etch subdetector, there is no dead-time, so its temporal efficiency is equal to 1. The coefficient representing the geometric independence of analysis “2” versus “1”, , originates from the difference between the acceptances of the analyses. It is obtained by Monte Carlo simulations, assuming an incoming isotropic flux of magnetic monopoles with respect to subdetector “2”: , where and are the number of MMs detected by “2” and both analyses, respectively.
The global time integrated acceptance is then:
The global C.L. limit for the flux of magnetic monopoles is
.
The algorithm used to combine the actual MACRO limits is more complicated than the example above. For each analysis we took into consideration its actual history, eliminating the longer periods of time in which it was eventually missing, and the changes in the detector configuration (super-modules involved). Those corrections were more critical in the case of earlier analyses, that were carried on during the construction of the MACRO detector and during initial tests; note that limits obtained by such older searches are not presented in Fig. 8 and in Tab.1, as they are considerably higher than the included ones, but they have still their imprint on the global limit.
In Fig. 9 we present the global MACRO limit; for comparison, the flux limits from other experiments which searched for magnetic monopoles with similar properties, are also shown otherexp . In the figure the arrow indicates the Extended Parker Bound (EPB) at the level of cm-2s-1sr-1, which was obtained by considering the survival probability of a magnetic monopole of mass in an early magnetic seed field epb .

4 Discussion
Our analysis applies to an isotropic flux of bare MMs with charge =e/2 and nucleon decay catalysis cross sections smaller than 1 mb monorev .
The magnetic monopole flux at the detector site is isotropic if magnetic monopoles have enough kinetic energy (i.e. large mass and/or high ) in order to cross the Earth. If this is not the case, only a fraction of the total detector acceptance is actually exploited and the upper limits given above must be corrected accordingly. In particular, if monopoles have sufficient energy to cross the overburden mountain (i.e. hg/cm2) and reach the detector from above, but not enough to cross the Earth, the flux upper limit is about a factor of two weaker. Therefore the energy losses suffered by magnetic monopoles in traversing the Earth set the accessible values of mass and for a given experiment. For MACRO, at least one half of the geometrical acceptance is ensured for relativistic MMs with GeV/c2 or, for if GeV/c2; the full acceptance is reached if GeV/c2 or GeV/c2, for relativistic and slow magnetic monopoles, respectively idmthesis ; boearth (see Table 2). Sensitivity to fast and light MMs is also important, since they could be responsible for ultra high energy cosmic ray events above the Greisen-Zatsepin-Kuzmin cutoff supergzk .
If magnetic monopoles have and/or an associated electric charge (dyons monorev ), the detection efficiency might change. As far as our sub-detectors are concerned, the dyon detection efficiency would be greater than that of bare monopoles since the excitation/ ionization-based energy losses would be larger boeloss . The only exception is the detection of very slow dyons with the streamer tubes, since it relies on the Drell effect on helium atoms drellpate , which for dyons might be prevented by coulombian repulsion. However, as shown in boeloss , the only effect would be the raising of the minimum velocity threshold at for dyons with electric charge , the threshold for bare MMs being .
| (cm2 s-1 sr-1) | m (GeV/c2) | |
|---|---|---|
As suggested in rubacallan , GUT magnetic monopoles may catalyze nucleon decays along their path with a cross section of the order of the hadronic cross sections monorev . If mb, the efficiencies of the aforementioned searches might decrease due to the effects of the fast decay products. A deep study was performed on the effect of the nucleon catalysis cross section on the streamer tube analysis. The main result is that the present analyses are still efficient up to at least mb. A dedicated search for magnetic monopoles accompanied by one or more nucleon decays along their path was also performed. The results are reported in a separate paper catalysis .
5 Conclusions
We present the final results of GUT magnetic monopole searches performed with the MACRO detector at Laboratori Nazionali del Gran Sasso (Italy). Different searches using the MACRO sub-detectors (i.e. scintillation counters, limited streamer tubes and nuclear track detectors) both in stand alone and combined ways, were performed. Since no candidates were detected, Tab.2 summarizes the C.L upper limit to an isotropic flux of bare MMs with charge =e/2 and nucleon decay catalysis cross section smaller than 1 mb.
Acknowledgements
We gratefully acknowledge the support of the director and of the staff of the Laboratori
Nazionali del Gran Sasso and the invaluable assistance of the technical staff of the
Institutions participating in the experiment. We thank the Istituto Nazionale di Fisica
Nucleare (INFN), the U.S. Department of Energy and the U.S. National Science Foundation
for their generous support of the MACRO experiment. We thank INFN, ICTP (Trieste),
WorldLab and NATO for providing fellowships and grants for non Italian citizens.
References
-
(1)
J. Preskill, Ann. Rev. Sci. 34 (1984) 461;
G. Giacomelli, Riv. Nuovo Cimento 7 (1984) 1;
D. E. Groom, Phys. Rep. 140 (1986) 324 and references therein. -
(2)
S. F. King and Q. Shafi, Phys. Lett. B422 (1998) 135;
T. W. Kephart and Q. Shafi, hep-ex/0105237 (2001). -
(3)
T. W. Kephart and T. J. Weiler, Astrop. Phys. 4 (1996) 217;
C. O. Escobar and R. A. Vazquez, Astrop. Phys. 10 (1999) 197. - (4) M. S. Turner et al., Phys. Rev. D26 (1982) 1296.
- (5) S. P. Ahlen et al. (MACRO Coll.), Nucl. Instr. Meth. in Phys. Res. A324 (1993) 337.
- (6) M. Ambrosio et al. (MACRO Coll.), NIM A486 (2002) 663.
- (7) M. Ambrosio et al. (MACRO Coll.), Astropart. Phys. 10 (1999) 11, hep-ex/9807009.
- (8) J. Derkaoui et al., Astropart. Phys. 10 (1999) 339.
- (9) M. Ambrosio et al. (MACRO Coll.), Phys. Lett. B406 (1997) 249.
- (10) S. P. Ahlen et al (MACRO Coll.), Phys. Rev. Lett. 72 (1994) 608.
- (11) M. Ambrosio et al.(MACRO coll.), Astropart. Phys. 6 (1997) 113.
- (12) M. Ambrosio et al. (MACRO coll.), Astropart. Phys. 4 (1995) 33.
- (13) L. Patrizii (MACRO Coll.), Proc. of the XXth ICNTS, Rad. Meas. 34 (2001) 259.
- (14) M. Ambrosio et al. (MACRO Coll.), hep-ex/0110083, accepted by Astroparticle Physics.
- (15) D. J. Ficenec et al., Phys. Rev. D36 (1987) 311.
- (16) S. P. Ahlen, Phys. Rev. D17 (1978) 229.
- (17) S. P. Ahlen and K. Kinoshita, Phys. Rev. D26 (1982) 2347.
- (18) S. P. Ahlen and G. Tarlé, Phys. Rev. D27 (1983) 688.
-
(19)
S. Kyriazopoulou (MACRO Coll.), Proc. NATO ARW
on Cosmic Radiations, Oujda (Morocco) 21-23 March 2001;
S. Kyriazopoulou, Ph.D. Thesis, California Institute of Tecnology (2002). - (20) S. P. Ahlen et al. (MACRO Coll.), Astropart. Phys. 1 (1992) 11.
- (21) A. Baldini et al., Nucl. Instr. & Meth. in Phys. Res. A305 (1991) 475.
- (22) S. D. Drell et al., Phys. Rev. Lett. 50 (1983) 644. V. Patera, Phys. Lett. A137 (1989) 259.
- (23) G. Battistoni et al., Nucl. Instr. Meth. in Phys. Res. A270 (1988) 185.
- (24) G. Battistoni et al., Nucl. Instr Meth. in Phys. Res. A401 (1997) 309.
- (25) I. De Mitri et al., Nucl. Instr. & Meth. in Phys. Res. A360 (1995) 311.
- (26) G. Battistoni et al., Nucl. Instr Meth. in Phys. Res. A399 (1997) 244.
- (27) S. Cecchini et al., Riv. Nuovo Cimento A109 (1996) 1119.
- (28) S. Cecchini et al. Radiat. Meas., 34 (2001) 54.
- (29) G. Giacomelli et al., Nucl. Instr Meth. in Phys. Res. A411 (1998) 41.
-
(30)
B. Choudhary (MACRO Coll.), 26th ICRC, Salt Lake City, Utah, USA (1999),
hep-ex/9905023;
M. Sitta (MACRO Coll.), 27th ICRC, Hamburg, Germany (2001). -
(31)
E. N. Alexeyev et al. (“Baksan”), 21st ICRC, Adelaide, Vol. 10, (1990) 83;
S. Orito et al. (“Ohya”), Phys. Rev. Lett. 66 (1991) 1951;
V. A. Balkanov for the Baikal Coll. (“Baikal”, “AMANDA”), Nucl. Phys. B91 (2001) 438;
G. Giacomelli et al., hep-ex/0005041 (2000). - (32) F.C. Adams et al., Phys. Rev. Lett. 70 (1993) 2511.
- (33) I. De Mitri, Ph.D. Thesis, University of L’Aquila (1996).
- (34) J. Derkaoui et al., Astropart. Phys. 9 (1998) 173.
-
(35)
T. W. Kephart and T. J. Weiler, Astropart. Phys. 4 (1996) 271;
P. Bhattacharjee and G. Sigl, Phys. Rep. 327 (2000) 109;
S. D. Wick et al., astro-ph/0001233 and references therein. -
(36)
V. A. Rubakov, JETP Lett. 33(1981) 644;
C. G. Callan, Phys. Rev. D25 (1982) 2141. - (37) M. Ambrosio et al. (MACRO Coll.), Search for Nucleon Decay induced by GUT Magnetic Monopoles with the MACRO Experiment, hep-ex 0207024.