Search for an exotic three-body decay of orthopositronium
Abstract
We report on a direct search for a three-body decay of the orthopositronium into a photon and two penetrating particles, . The existence of this decay could explain the discrepancy between the measured and the predicted values of the orthopositronium decay rate. From the analysis of the collected data a single candidate event is found, consistent with the expected background. This allows to set an upper limit on the branching ratio (at the 90% confidence level), for the photon energy in the range from 40 keV 400 keV and for mass values in the kinematical range 900 keV. This result unambiguously excludes the decay mode as the origin of the discrepancy.
keywords:
orthopositronium decay, new particles, experimental tests, , , , , , , , ,
1 Introduction
Positronium (), the positron-electron bound state, is the lightest known atomic system. It is bound and annihilates through the electromagnetic interaction alone. At the current level of experimental and theoretical precision this is the only interaction present in this system (see e.g. [1]). This feature has made the positronium an ideal system for testing the accuracy of the QED calculations for bound states, in particular for the triplet () state of , called orthopositronium (). Due to the odd-parity under C-transformation the decays predominantly into three photons. As compared with the singlet () state (parapositronium) decay rate, the decay rate, due to the phase-space and additional suppression factors, is about times smaller. Thus, it is more sensitive to potential admixtures of new interactions, which are not accommodated in the Standard Model.
The study of the system has a long history [2]. However, in spite of the substantial efforts devoted to the theoretical and experimental determination of the properties, there is a long-standing puzzle: the decay rate in vacuum measured by the Ann Arbor group, [3], has a discrepancy with respect to the predicted value [4] (see also [5]). This discrepancy has been recently confirmed by more precise calculations of Adkins et al.[6], including corrections of the order .
The result of the recent Tokyo measurements of decay rate in low density SiO2 powder corrected for matter effects [7] agrees, within the errors, with the theoretical value of [6]. However, the method to extract the value of the decay rate in vacuum from the measurement in matter is still under discussion [8]. Thus, it is difficult to disagree with the Adkins et al.[6] statement that : …no conclusions can be drawn until the experimental situation is clarified.
Various exotic decay modes have been investigated, with the hope that a relative contribution to the decay rate at the level of would solve the discrepancy111Note that the recent result [7] still allows exotic contribution to the at a (2) level of . (for review, see e.g. [8, 9]).
Invisible decays of , such as, e.g., , are excluded [10, 11]. However, there is still a possible explanation of both the discrepancy and the Tokyo results. This is based on the existence of the decay in vacuum (for more details see Ref. [12]–[14]).
Visible exotic decays of (i.e. decays accompanied by at least one photon in the final state) have been experimentally searched for: , and , where X is a new light particle and . These decay modes have definitely been excluded [15]–[21] as the cause of the lifetime discrepancy.
The possibility of a new exotic three-body decay into a photon and a pair of new light weakly interacting particles had not yet been considered. The photon energy spectrum from this decay mode has no peak, differently from the two-body decay . Thus, the sensitivity of previous searches based on the conventional peak-hunting technique is not sufficient to exclude this decay mode as the source of the discrepancy. Cosmological arguments place an indirect stringent constraint on the branching ratio of this decay mode [22]. However, one may argue that these arguments are depending on many assumptions.
The purpose of this experiment is to perform a direct search for the decay with the sensitivity needed to exclude this decay unambiguously.
2 Experimental technique
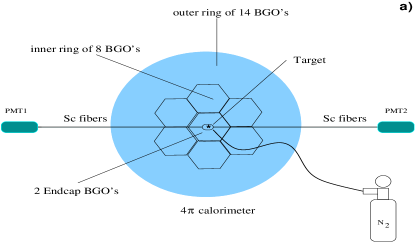
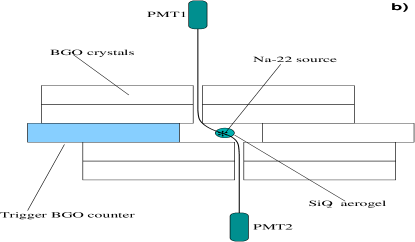
The schematic illustration of the detector setup used in the experiment is shown in Figure 1. Positrons from the 22Na source with an activity of 3.6 kBq are stopped in the SiO2 aerogel target (density 0.1 g/cm3, average grain size 50 - 100 Å) where a fraction of them produces orthopositronium. The source is prepared by sealing a drop of the 22Na solution between two 5 m mylar foils. The source is sandwiched between two 120 m thick scintillators fabricated by squeezing 1 mm thick scintillator fibers. The light produced by positrons crossing one of the scintillator fibers is delivered by the fibers to a pair of photomultipliers Philips XP2020 (PMT1 and PMT2 in Figure 1). The coincidence of the signals from PMT1 and PMT2 is used to tag the positron emission ( trigger) and to define the time of positronium formation in the target.
The photons produced by the positronium annihilation are detected by a 4 crystal calorimeter, schematically shown in Figure 1. The detector is composed of an inner and an outer ring of 8 and 14 BGO crystals, respectively, surrounding the target region. Two additional BGO crystals serve as endcaps. Each crystal has a hexagonal cross-section with an inner diameter of 55 mm and a length of 200 mm. For a more detailed description of the BGO crystals see [23]. One of the endcap counters, hereafter called trigger counter, is also used for the measurement of the annihilation time of the positronium relative to . When one of the annihilation photons is detected by the trigger counter, the recoil photons are detected by the other BGO counters, hereafter called the VETO detector. The detector is calibrated and monitored internally using the 511 keV annihilation photons and the 1.27 MeV photon emitted by the 22Na source in association with the positron emission. Variations of the energy scale are within and are corrected on the basis of an internal calibration procedure.
The particles and are assumed to be weakly interacting penetrating particles. Thus the experimental signature of the decay is the presence of energy deposition in the trigger counter, within a time interval consistent with the delayed annihilation of the in the target, and no energy deposition in the VETO detector.
In order to decrease the contribution of two photon events from collisional quenching of , the SiO2 target is dehydrated in a vacuum of 10-2 Torr at a temperature about 200oC during two hours before installation inside the detector. Furthermore, during the data taking period high purity dry nitrogen is flowing through the target. This procedure increases the lifetime of in the prepared sample of the SiO2 aerogel from 70 ns to 132 ns giving a two photon suppression factor of .
The signal of positron emission is also used to open a 3 s gate for complete recording of the signals from the BGO counters and the scintillator PMTs. An event is recorded if an energy deposition 40 keV is detected in the trigger counter within the 3 s gate.
A CAMAC-VME system interfaced to a personal computer is used for data acquisition. For each event the following quantities are recorded:
-
•
the amplitudes, and , of the pulses from PMT1 and PMT2 and the time interval between them;
-
•
the energy deposition in the trigger counter and the time interval between the trigger counter pulse and the trigger;
-
•
the pulses from each of the 23 BGO crystals for the measurement of the total energy deposition in the VETO detector.
3 Results

The search for the decay described in this paper uses a data sample of recorded events. Candidate events for o-Ps decays, with at least one photon in the final state, are identified by the following selection criteria, illustrated in Figure 2:
-
•
the PMT1 and PMT2 pulses from the scintillator fibers in the energy range keV. This cut is applied to reject signals of fake positrons from accidental coincidences due to PMT noise;
-
•
the time difference between PMT1 and PMT2 pulses ns;
-
•
the time difference between the PMT pulses from the scintillator fibers and the trigger counter signal is required to be in the range ns. The lower cut is used to eliminate background from the tail of prompt positron annihilation, shown in Figure 2c). The upper cut is chosen to eliminate a region where the background from accidental coincidences becomes dominant.
-
•
the presence in any single BGO crystal, except the two endcaps, of an energy deposition in the range keV. This criterion is applied to select events with a 1.27 MeV photon, emitted by the source at the same time as the positron.
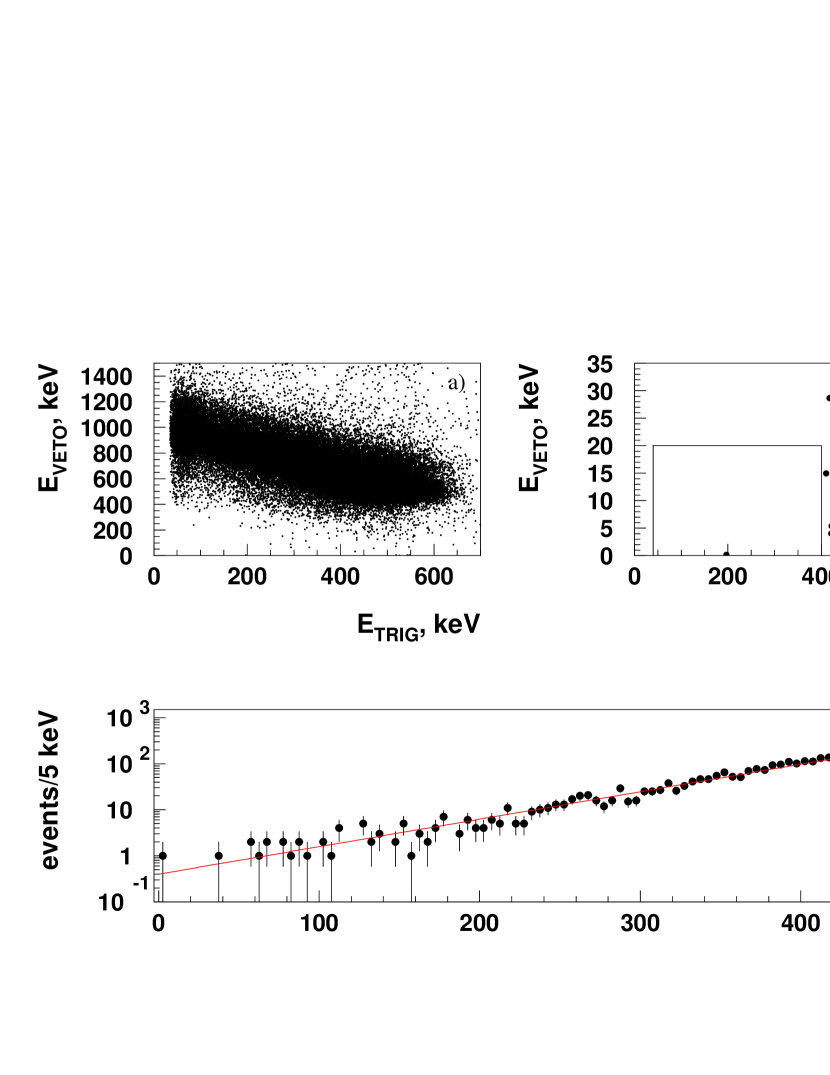
After imposing the above requirements 338’786 candidates events are found. The distribution of these events in the scatter plot vs is shown in Figure 3a). Here is defined as the sum over all BGO crystals minus the energy deposited in the trigger crystal and the energy deposited by the 1.27 MeV photon: . As expected for positronium decay into photons, the events accumulate around the line +=2, =511 keV being the electron or positron mass.
In Figure 3b) the region of the scatter plot for keV is shown. The box for 20 keV and 400 keV defines the signal region. The cut on the trigger energy 400 keV is applied to reject events where two photons from the decay deposit energy in the trigger counter and to eliminate background from annihilation into two photons due to collisional quenching.
The cut 20 keV is chosen according to the measured width of the zero-energy peak in the VETO detector. For this measurement, prompt positron annihilation events ( ns) are selected with one 511 keV photon in the trigger counter. The spectrum measured in the VETO counter for zero-energy signal, when the second photon escapes detection, shows that 95% of the zero-energy signal is collected in the region keV. The width of the zero-energy signal spectrum is determined mostly by the overlap of close in time events, while the contribution from the ADC pedestals fluctuation is found to be negligible.
The distribution of the VETO energy for 500 keV is shown in Figure 3c). The distribution of the events with keV can be extrapolated into the signal region to evalute the background contribution in this region. A fit shown in Figure 3c) results in a background estimate of events, where the error is evaluated from the uncertainty related to the extrapolation procedure itself.
As shown in Figure 3b) and 3c) one event is found in the signal region. This is consistent with the background evaluation described above. Hence, no evidence for the decay is found.
This result allows us to set an upper limit on from the 90% confidence level (CL) upper limit on the expected number of signal events, . Because of the uncertainty on the background estimate we have chosen conservatively not to subtract the background. Using Poisson statistics [24], for 1 event observed and 0 background event expected, the limit is =3.8 events.
Given the measured number of decays in the target, the numbers and of and decays , respectively, detected in the trigger counter, are
| (1) | |||
| (2) |
resulting in
| (3) |
Here and are the efficiencies of the trigger counter for and for decays, respectively. These efficiencies are evaluated with a Monte Carlo simulation of the detector response to both decay modes. For the decay, phase space distribution of the photon and of the two particles and are considered. It is found that for the kinematically allowed region of masses keV the efficiency ratio varies in the range . The lower value corresponds to calculated for =0 keV. The upper value corresponds to =900 keV. The efficiency for the is relatively high over this kinematically allowed region owing to our low trigger threshold of 40 keV. For the determination of the limit we take conservatively the value .
The number of decays in the target is measured from the decay curve of Figure 2c by fitting the distribution to the function ( is the accidental background) starting from the time ns when is completely thermalized in the target. Comparing the measured lifetime ns with the lifetime in vacuum ( 141.9 ns) the probability of quenching in the target is found to be 6.6%. Correcting for this efficiency factor the total number of detected is determined to be 3.2.
Finally, our 90 % CL limit on for the photon energy range keV and masses keV is
| (4) |
This limit is more than 20 times smaller than the value needed to explain the discrepancy in decay rate. Thus, the decay is definitely excluded as a possible origin of the discrepancy.
Acknowledgments
We thank the Paul Scherrer Institute (PSI)
for providing us with the BGO crystals
and W. Fetscher for advice. We gratefully acknowledge the help of
G. Roubaud for the 22Na source preparation. We wish to thank
N.V. Krasnikov for useful discussions.
Part of this work was supported by the Swiss National Science Foundation.
References
- [1] For a recent review, see S.N. Gninenko, N.V. Krasnikov, A. Rubbia, hep-ph/0205056.
- [2] A. Rich, Rev. Mod. Phys. 53 (1981) 127.
- [3] J. C. Nico, D. W. Gidley, A. Rich, P. W. Zitzewitz, Phys. Rev. Lett. 65 (1990) 1344.
-
[4]
G. S. Adkins, Ann. Phys. (N.Y.) 146 (1983) 78;
G.S.Adkins, Phys.Rev.Lett.76(1996)4903 - [5] W. G. Caswell, G. P. Lepage, Phys. Rev. A 20 (1979) 36.
- [6] G. S. Adkins, R. N. Fell, J. Sapirstein, Phys. Rev. Lett. 84 (2000) 5086.
-
[7]
O. Jinnouchi, S. Asai, T. Kobayashi, hep-ex/0011011.
S. Asai, S. Orito, N. Shinohara, Phys. Lett. B357 (1995) 475. - [8] M.Skalsey, Mater. Sci. Forum 255-257 (1997) 209, Trans Tech Publications, Switzerland.
- [9] M. I. Dobroliubov, S. N. Gninenko, A. Yu. Ignatiev, V.A. Matveev, Inter. J. Mod. Phys. A8 (1993) 2859.
- [10] G.S. Atojan, S.N. Gninenko, V.I. Razin, Yu.V. Ryabov, Phys. Lett. B220 (1989) 317.
- [11] T.Mitsui et al., Phys. Rev. Lett. 70 (1993) 2265.
-
[12]
S.L. Glashow, Phys. Lett. B167 (1986) 35;
E.D. Karlson, S.L. Glashow, Phys. Lett. B193 (1987) 168. - [13] S. N. Gninenko, Phys. Lett. B326 (1994) 317.
- [14] R. Foot, S. N. Gninenko, Phys. Lett. B480 (2000) 171.
- [15] S.N. Gninenko et al., Phys. Lett. B 237 (1990) 287.
- [16] S. Asai et al., Phys. Rev. Lett. 66 (1991) 2240.
- [17] U. Amaldi, G. Carboni, B. Jonson, J. Thun, Phys. Lett. B153 (1985) 444.
- [18] M. Tsuchiaki et al., Phys. Lett. B236 (1990) 81.
- [19] M.V. Akopyan et al., Phys. Lett. B272 (1991) 443.
- [20] T.Maeno et al., Phys. Lett. B351 (1995) 574.
- [21] T.Mitsui et al., Eur. Lett. 33 (1996) 111.
- [22] R. Escribano, E. Masso, R. Toldra, Phys. Lett. B 356 (1995) 313.
- [23] I.C. Barnett et al., Nucl. Instrum. Meth. A 455 (2000) 329.
- [24] D.E. Groom et al., Rev. of Part. Prop., The Eur. Phys. J. C15 (2000) 22.