Differential cross sections, charge production asymmetry, and spin-density matrix elements for (2010) produced in 500 GeV/ - nucleon interactions.
Abstract
We report differential cross sections for the production of (2010) produced in 500 GeV/ -nucleon interactions from experiment E791 at Fermilab, as functions of Feynman- () and transverse momentum squared (). We also report the charge asymmetry and spin-density matrix elements as functions of these variables. Investigation of the spin-density matrix elements shows no evidence of polarization. The average values of the spin alignment are and for leading and non-leading particles, respectively.
keywords:
PACS 13.85.Ni, 13.88.+e, 14.40.Lb; charm hadroproduction; differential cross section; spin alignment; polarization1 Introduction
(2010) () production is important to understanding the production of charm because ’s are expected to dominate the charm cross-section: their spin causes them to be favored threefold over the low-lying mesons at high center of mass energies. Charm production is an interesting topic in its own right, being calculable in perturbative QCD[1]. There has also been interest in the intrinsic charm content of hadrons[2]. Finally, accurate simulations of charm production required by future experiments at the Tevatron, the LHC, and lepton colliders will depend on these measurements which can be used to tune Pythia[3] and other Monte Carlo simulation packages.
Since mesons have spin 1, we might expect the charm quark spin to be reflected in the meson. Spin retention is particularly strong for heavy quarks, where the usual stiffness of the spin vector under relativistic boosts may be expected to play a part[4]. In any case, there are many anomalies of spin and polarization. For instance, it is known that some hyperons are strongly polarized in some regions of production and not in others, the reasons for this behavior being still not completely understood[5]. It is also known that most of the spin of the proton is not carried by the valence quarks[6]. Copious production of a vector meson provides us with a unique opportunity to add new information on polarization, and we hope that these data will shed further light on hadron physics.
In this paper, we report measurements of the production of (2010) in 500 GeV/ -nucleon interactions. Forward differential cross sections and production asymmetries have been measured as functions of Feynman-x () and transverse momentum squared (). The measurements are compared to Pythia Monte Carlo models. The differential distributions are fit to well-known functional forms and fit parameters are compared with previous measurements. Also, spin-density matrix elements were measured, again as functions of and .
2 Experiment and Data Sample
E791, a high statistics charm physics experiment, took data at Fermilab’s Tagged Photon Laboratory during the 1991–2 fixed-target run. The experiment [7] used an upgraded version of the two-magnet spectrometer previously used in E516, E691, and E769. A 500 GeV/ beam was directed at five target foils: a 0.52 mm thick platinum foil, followed by four 1.56 mm thick carbon foils, with a typical spacing of 15 mm between foil centers. Tracks and vertices used hits in 23 silicon microstrip and 45 wire chamber planes. The spectrometer included two Čerenkov counters, electromagnetic and hadronic calorimeters, and two muon scintillator walls. A loose trigger based on transverse calorimeter [8] energy was employed. An innovative data acquisition system [9] recorded events. The resulting 50 Terabyte data set was reconstructed using large computing farms at four sites [10].
The sample used in this analysis was collected from the decay mode .111Charge conjugates are implied for all decay modes discussed in this paper. The candidates were obtained in the decay modes and . Selection criteria were chosen to optimize , where and are respectively the signal and background in -value histograms. Here, the -value is defined as where is the reconstructed mass, is the reconstructed mass, and is the charged pion mass [11]. Owing to the high statistics of the sample and the small number of criteria used for selection, the data set was used directly for this optimization.

The short lifetime of the makes it impossible to reconstruct a decay vertex separate from the primary vertex, so in what follows, the secondary vertex is defined to be the point where the decays, and the primary vertex to be the point where the and are produced. The longitudinal separation between the primary and secondary vertices was required to be at least standard deviations222In some instances, different cuts were applied for the and modes. In these cases the cut is shown in parentheses., and the secondary vertex was required to be outside any target foil. The component of the momentum vector of the candidate perpendicular to the line joining the primary and secondary vertices was required to be less than , and also the momentum vector was required to point back to within 0.1 mm of the primary vertex in the plane transverse to the beam. To reduce background caused by false secondary vertices or tracks being mis-assigned to the secondary vertex, it was further required that the product over all decay tracks of the ratio of the transverse impact parameter at the secondary vertex to that at the primary vertex be less than one. To further reduce background, the reconstructed mass of the candidate was required to fall within a mass window which was determined by creating histograms of the masses of the candidates separately in the various regions of and to which a fit was performed where the signal was represented by a Gaussian and the background by a straight line. The limits of the mass window were chosen to be at on either side of the mean. Owing to the small phase space available to the decay, the background in the -value histogram is already low enough that no additional cuts on the decay pion candidates were necessary, other than basic track quality requirements applied to all decay tracks. Applying the above selection criteria yields a data sample of signal events which are shown in Figure 1.
3 Differential Production Cross Sections
For the differential cross section study, the data sample was divided into 12 bins each of and . In the range , the bins have a width of 0.05, and in the range the bins have a width of 0.1. In the range bins have a width of 0.5 , and in the range bins have a width of 1 . In each bin of or , -value histograms were created. Random event mixing was used to model the background shape, and the background level was determined by fitting the event mixed histogram to the corresponding data histogram using a binned maximum likelihood fit in the background region (). In the signal region () we subtract from the data histogram the scaled number of events from the event-mixed histogram to obtain the number of signal events. In this way, it isn’t necessary to model the details of the signal shape to determine the number of signal events in the histogram.
To model the acceptance, 14 million Monte Carlo events were generated which, when reconstructed and subjected to the same selection criteria as our data, yielded approximately ten times as many events as in the data sample. The Monte Carlo samples were fit in the same way as the data to obtain a bin-by-bin efficiency estimate.
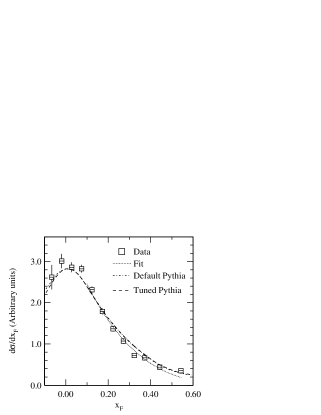

The acceptance-corrected yields were used to plot the differential cross sections in Figure 2. For the distributions, we used data in the range GeV2, and for the distributions, . The distribution was fit in the range 0.1–0.6 with the traditional function:
| (1) |
The distribution was fit with the traditional function
| (2) |
in the range and with the function
| (3) |
in the full range . This last functional form was suggested by Frixione et al.[12].
In Figure 2, the E791 results are also compared to the default Pythia model [3] and a “tuned” Pythia model [13] in which parameters are adjusted to more closely model the production characteristics reported in an earlier E791 paper [14]. The results of the various fits are listed in Table 1, along with results from previous experiments [15, 16, 17, 18, 19].
| Expt. | GeV/ | fit range | fit range (Gev/c)2 | * | * | ||
| E791 | 500 | 0.1 to 0.6 | 0 to 4 | ||||
| l. () | or | ||||||
| nl. () | 0 to 10* | ||||||
| WA92[15] | 350 | 0 to 0.6 | 0 to 4 | ||||
| l. | or | ||||||
| nl. | 0 to 14* | ||||||
| E769[16] | 250 | 0.1 to 0.6 | 0 to 4 | ||||
| l. | |||||||
| nl. | |||||||
| NA32[17] | 230 | 0 to 0.8 | 0 to 10 | ||||
| l. | |||||||
| nl. | |||||||
| NA32[18] | 200 | 0 to 0.7 | 0 to 5 | ||||
| l. | |||||||
| nl. | |||||||
| NA27[19] | 360 | 0 to 0.5 | 0 to 3 |
4 Charge Asymmetry in Production
The charge production asymmetry is defined by the parameter:
| (4) |
where and denote the production cross-sections, of and , respectively, and and denote the respective acceptance-corrected numbers of such particles observed.
Using the same fitting techniques and data sample as was used in the differential cross section study, the production asymmetry as functions of and are shown in Figure 3.


5 Spin-Density Matrix Elements
The polarization state of a spin 1 particle can be described by a complex spin-density matrix. A complex matrix has 18 real components, but hermiticity and the fact that reduces this number to 8. Also, the ’s are produced in a strong interaction where parity conservation further reduces this number to 4. The spin-density matrix when expressed in a helicity basis then takes this form [20]:
with and of course real.
From this, one can derive the angular distribution [20],
| (5) | |||||
The angles and in the above equation are polar and azimuthal angles respectively in a right-handed spherical polar coordinate system in the rest frame of the , whose polar axis () points along the boost vector (a “helicity” basis, with the -axis chosen to lie in the production plane) and the axis is chosen to point in the direction where is a unit vector in the direction of the momentum vector and is a vector in the direction of the beam particle momentum vector (the -axis is normal to the production plane).
Note that this distribution depends on only three of the four independent components of the spin-density matrix: , , and . Thus cannot be determined from this angular distribution study.
The degree of polarization is commonly expressed by the spin alignment parameter:
To measure the spin-density matrix elements, the data sample was first divided into five bins each of and . In each of these bins, an two-dimensional histogram of vs. was created. The yield in each bin was measured as follows. Events were counted both above and below a -value of 10 for both the data histogram and the event-mixed data histogram (our background model). A comparison of the number of events in the data and mixed data sample in the region yields a scale factor, which is used in subtracting the number of background events from the signal region . The same procedure was applied to a Monte Carlo sample to obtain a binned acceptance function, and the data sample was corrected for acceptance in this way.
The resulting two dimensional histogram was fitted with the functional form shown in Equation 5 to obtain values for the spin-density matrix elements. These results are plotted separately for and in Figure 4. Because the sample had to be split into sub-regions of and in order to perform the fits, fewer bins in and were used than in previous sections. There is no measurable polarization at our level of sensitivity in any sub-region of the or range examined. The average value of the spin alignment parameter is found to be and for leading () and non-leading () particles respectively.

6 Systematic Errors
The systematic errors reported were determined by comparing results, either from various subsamples, or by analyzing the full sample in multiple ways. Differences in measurements of the number of observed signal events were then determined as fractions of statistical errors bin by bin. Root mean squares of these fractions were then used as estimates of the systematic error as a fraction of statistical error. Several possible sources of systematic error were considered, and those found to be significant are tabulated in Table 2. The cut on the mass varies with and and depends on our modeling of the signal. By comparing results with different mass cuts, a systematic error of 24% (of the statistical error) was assigned for this effect. Because the default Pythia and distributions don’t match those in data exactly, it was necessary to weight the Monte Carlo events to correct the distributions when modeling acceptance as a function of the other variable. By varying the “weighting curve” parameters by from their central values, it was determined that a relative systematic error of 13% should be assigned. Two decay modes of the ( and ) are used in this analysis. Since one mode involves two more decay particles than the other, one can compare results from the two modes to obtain an estimate of the error resulting from modeling of the tracking efficiency. A relative error of 25% was assigned for this effect, although some uncertainty remains as the two samples were statistically independent, and it is not possible to unambiguously untangle the systematic and statistical errors. Event mixing was used to model the backgrounds in the histograms. If the event-mixed histograms do not perfectly model the actual background, this would result in a systematic error. By varying the range of -values in which the background is fit, an estimate of the magnitude of the systematic error is obtained. A relative error of 39% is assigned to this effect. Over the period of E791’s run, the 500 beam caused a significant amount of ionization in regions of the drift chambers through which it passed. This caused deposits to gradually form on the drift chamber wires resulting in a loss of tracking efficiency in regions through which the beam passed. These drift chamber “holes” changed in size and shape throughout the run period. Although this is modeled in the Monte Carlo in a time dependent fashion, this modeling is not perfect. By comparing results obtained from subsamples of various run periods, a 58% relative systematic error was assigned to this effect.
Each source of error was measured as a fraction of the statistical error, and a quadratic sum of the various sources is shown at the end of the table to be 79% of the statistical error. Combining the statistical with the overall systematic error by adding them in quadrature results in a combined error which is 1.3 times the statistical error alone. These combined errors are used to create the error bars in the plots in this paper.
| Source of Uncertainty | Syst. / stat. err. |
|---|---|
| / weighting | 13% |
| mass cut | 24% |
| Tracking efficiency | 25% |
| fitting | 39% |
| Drift chamber efficiency modeling | 58% |
| Total | 79% |
7 Conclusions
We have measured the differential cross sections of production as functions of and . While the usual functional forms used by other experiments to parameterize their data (Equations 1 and 2) do not describe our data well, Equation 3 suggested by Frixione et al. provides an excellent fit over our full range of ( for 9 degrees of freedom). The Pythia model tuned for the E791 analysis of production does describe the cross section much better than the default Pythia model.
We observe an overall charge asymmetry which favors the leading particle as predicted by the Pythia model, although our overall observed asymmetry is significantly less than predicted. We do observe an increase in asymmetry with as predicted by Pythia and consistent with that for production[14]. The asymmetry is approximately constant as a function of ; while it dips to zero near , data points in this region are also consistent with the average value.
We observe no polarization at our level of sensitivity, either on average or as functions of or .
References
- [1] P. Nason, S. Dawson, and R. K. Ellis, Nucl. Phys. B327 (1989) 49. See also L. M. Jones and H. W. Wyld, Phys. Rev. D17 (1978) 759.
- [2] S. J. Brodsky, C. Peterson, and N. Sakai, Phys. Rev. D23 (1981) 2745.
- [3] T. Sjöstrand, Computer Physics Commun. 82 (1994) 74. (Pythia version 5.7 and Jetset version 7.4 were used.)
- [4] This arises from the inverse mass dependence of rate of change of spin in the Bargmann–Michel–Telegedi (BMT) equation. See, for instance, J. D. Jackson, Classical Electrodynamics 2nd. Ed. John Wiley & Sons, New York (1975) 558.
- [5] S. M. Troshin and N. E. Tyurin, (2002) hep-ph/0201267, and references therein.
- [6] B. Adeva et al., Phys. Lett. B320 (1994) 400.
- [7] E. M. Aitala et al., Eur. Phys. J. direct C4 (1999) 1, hep-ex/9809029; D. J. Summers et al., XXVII Moriond (15-22 March 1992) 417, hep-ex/0009015.
- [8] V. K. Bharadwaj et al., Nucl. Instrum. Meth. 155 (1978) 411; A228 (1985) 283; D. J. Summers, ibid. A228 (1985) 290; J. A. Appel et al., ibid. A243 (1986) 361.
- [9] S. Amato et al., Nucl. Instrum. Meth. A324 (1993) 535.
- [10] S. Bracker et al., IEEE Trans. Nucl. Sci. 43 (1996) 2457; F. Rinaldo and S. Wolbers, Comput. Phys. 7 (1993) 184.
- [11] Particle Data Group, Eur. Phys. J. C15 (2000) 396.
- [12] S. Frixione, M. L. Mangano, P. Nason, and G. Ridolfi, Nucl. Phys. B431 (1994) 453.
- [13] The “tuned” parameters were obtained from [14]: PMAS(4,1) (the charm quark mass in GeV/) was changed from 1.35 to 1.7, PARP(91) (the average in ) increased from 0.44 to 1.0, PARP(93) (the maximum allowable ) in GeV/) increased from 2.0 to 5.0, and MSTP(92) the remnant quark-diquark energy splitting function) changed from 4 to 3.
- [14] E. M. Aitala et al., Phys. Lett. B371 (1996) 157.
- [15] M. Adinolfi et al., Nucl. Phys. B547 (1999) 3.
- [16] G. A. Alves et al., Phys. Rev. D49 (1994) 4317.
- [17] S. Barlag et al., Z. Phys. C49 (1991) 555.
- [18] S. Barlag et al., Z. Phys. C39 (1988) 451.
- [19] M. Aguilar-Benitez et al., Phys. Lett. B169 (1986) 106.
- [20] Martin L. Perl, High Energy Hadron Physics John Wiley & Sons, New York (1974) 281.