Experimental Study of and Decays
Abstract
The process was studied in the SND
experiment at VEPP-2M collider in the energy region
0.60–0.97 GeV. From the analysis of the energy dependence of
measured cross section the branching ratios
and
were obtained.
PACS: 13.65.+i,14.40.Cs
1 Introduction
In 1998 and 2000 the experiments with Spherical Neutral Detector (SND)[1] at VEPP-2M collider were carried out in the energy range MeV where cross section of annihilation into hadrons is determined by the and meson decays. The integrated luminosity of 9 pb-1 collected in the experiment corresponds to and produced and mesons, respectively. One of the goals of the experiment was the investigation of the rare process
| (1) |
Our preliminary study [2] of the process (1) was based on 1/3 of collected statistics. Its results were the first measurement of and the measurement of confirming the only previous measurement of this decay by GAMS: [3].
The theoretical study of the decays was begun by P.Singer in Ref. [4] where the transitions via (Fig. 1a) and intermediate states were suggested. The vector meson dominance (VMD) calculation with these intermediate states leads to branching ratios and for and , respectively [5].
| model | VMD | loops, | total |
|---|---|---|---|
| pole |
For decay another mechanism through the pions loops (Fig. 1b) is also possible [5]. The branching ratios expected for this mechanism in different models [6, 7, 8, 9] are listed in Table 1. It was noted in Ref. [8] that the decay via chiral loops can be interpreted as , where is a scalar state decaying into pair. The dependence of on parameters was studied in Ref. [7]. The range of values in L model corresponds to different widths.
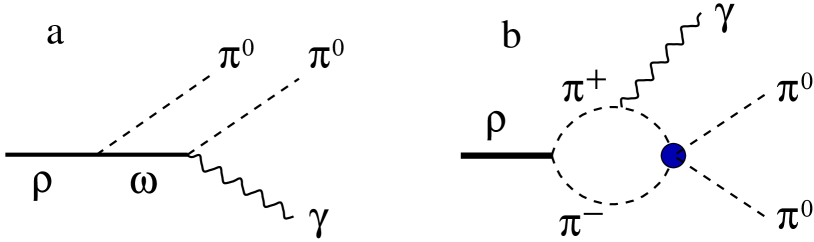
Since the amplitudes of transition (Fig. 1a) and of the pion loops (Fig. 1b) are of the same order of magnitude, their interference is substantial. The interference contribution into branching ratio is predicted to be positive. The theoretical values for the total branching ratios are also listed in Table 1. The predictions of the chiral models [6, 7, 8, 9] are in agreement with our previous experimental result. The significantly larger value of was obtained in Ref. [10] using pole model. Their result contradicts to existing experimental data.
In decay the contribution of pion loops is G-parity suppressed while the contribution of kaon loop is small due to large kaon mass. Therefore, it is assumed that the decay proceeds through intermediate state. The first measurement [3] significantly exceeded the existent prediction of VMD model: [5]. An attempt to explain this discrepancy was done in Ref. [11] where – mixing was taken into account and coupling constants were extracted from experimental values of and . As a result the estimated value of increased up to . Similar results (4.5–4.7) were then obtained in Refs. [6, 9]. In Ref. [12] the large experimental value of was explained by additional contribution of the transition and used to extract the value of coupling constant.
In the present work we present the experimental results on and based on full SND data sample.
2 Event selection
For analysis five-photon events with the energy deposition in the calorimeter
| (2) |
and the total momentum measured by the calorimeter
| (3) |
were selected. Here is center of mass energy.
Due to high beam background rate in 5% of events fake photons appear. This makes possible for lower photon multiplicity QED processes , and decays to imitate five-photon events producing main background contribution for the process under study. Detector response to the beam background was studied using special events recorded with a random generator trigger. The information on the fired detector channels in these events was used for simulation of the process under study and the background processes. Considerable suppression (by a factor of 8) of the background from events with fake photons was achieved by imposing the following cuts:
| (4) |
where and are the energy and polar angle of the softest photon in an event. These cuts reduce the detection efficiency for the process under study by 25%. Another background source is the reaction producing five-photon events mainly due to the merging of near photons. To suppress this background, the parameter describing transverse energy deposition profile of the detected photon [13] was used. The cut
| (5) |
suppresses the background by a factor of 2 with a 5% loss of actual 5-photon events.
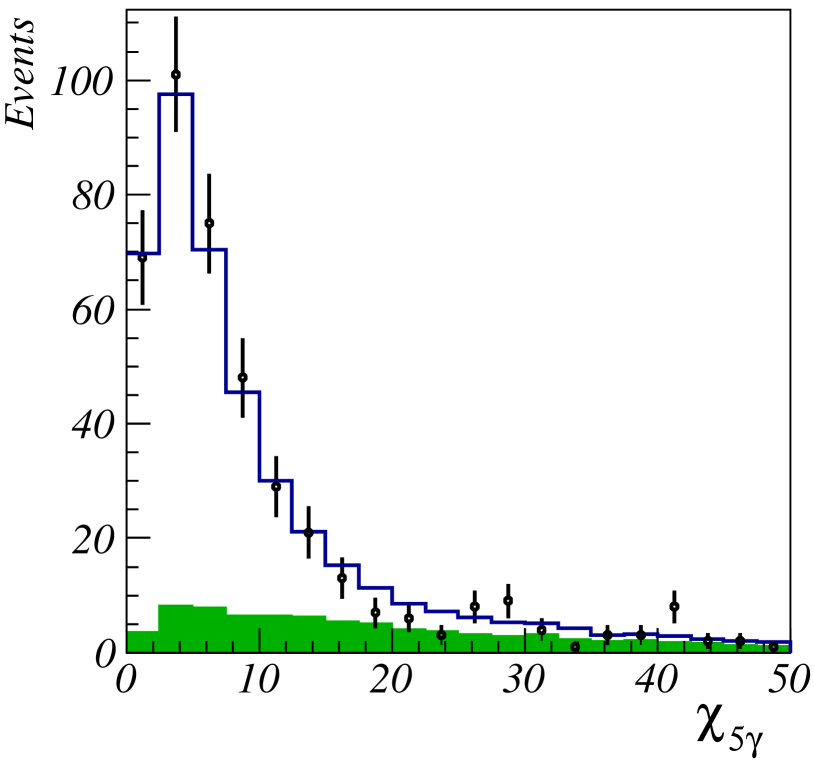
Further selection was based on the kinematic fitting of the events. Compatibility of the event kinematics with and hypotheses was checked. For the hypothesis two out of five photons were considered spurious: all 3- subsets were tested and the best one with minimum value was selected. As a result of kinematic fitting the values, and , were calculated for both hypotheses. The cut
| (6) |
practically eliminates background with the loss only 2.5% of the events of the process under study. Figure 3 depicts the distribution of the experimental and simulated events. The following cut was imposed on this parameter:
| (7) |
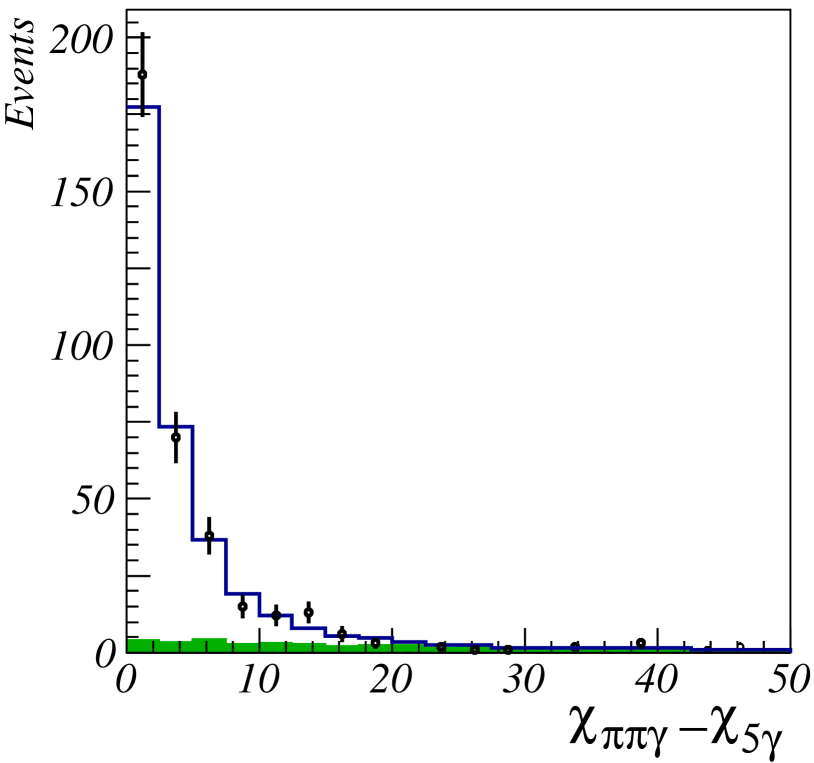
Finally, the events with two mesons were selected. To do this the kinematic fit in hypothesis was performed and the following cut was imposed:
| (8) |
Here is the value of the kinematic fit for the hypothesis. The distributions for the experimental and simulated events are shown in Fig.3.
The difference between distributions of the background events and events of the process under study (Figs. 3 and 3) was used to estimate the accuracy of the background calculation. The experimental distribution was fitted by the sum of simulated distributions for the process (1) and background. As a result of the fit the ratio was determined. For softer selection criteria without cuts (4,6,5) this ratio is equal to and does not depend on the beam energy at our level of statistical accuracy. From this we conclude that the systematic error of the background estimation does not exceed 50%.
The total of 310 events were selected with estimated background of events. The main sources of the residual background are and processes. The distribution of selected events and calculated background over center of mass energy is given in the Table 2. No events were detected below 600 MeV. The uncertainty of the center of mass energy, integrated luminosity, and detection efficiency are listed in Table 2 for each energy point. The uncertainty of the center of mass energy includes the beam energy spread and the energy shift between 1998 and 2000 scans. The integrated luminosity was measured using process. The statistical error of the luminosity in each energy point does not exceed 1% and is not included in the table. Its systematic error was estimated to be 3%. The detection efficiency for the process (1) was determined by simulation. The differential cross section of the process calculated in VMD model [14] was used for simulation. The systematic error of the detection efficiency, including the model error due to possible contribution from intermediate state was estimated to be 5%.
| ,MeV | ,MeV | L, nb-1 | ,nb | ||||
|---|---|---|---|---|---|---|---|
| 600.1 | 0.29 | 88.3 | 0 | 0.1 | 0.273 | 0.912 | |
| 630.1 | 0.30 | 116.1 | 0 | 0.1 | 0.269 | 0.906 | |
| 660.2 | 0.25 | 271.6 | 2 | 0.3 | 0.273 | 0.900 | |
| 690.2 | 0.29 | 167.2 | 2 | 0.2 | 0.263 | 0.895 | |
| 720.3 | 0.26 | 588.5 | 1 | 0.8 | 0.251 | 0.892 | |
| 750.2 | 0.32 | 219.0 | 3 | 0.1 | 0.259 | 0.897 | |
| 760.2 | 0.31 | 238.9 | 2 | 0.3 | 0.251 | 0.896 | |
| 764.2 | 0.32 | 250.4 | 5 | 0.2 | 0.254 | 0.892 | |
| 770.2 | 0.31 | 284.4 | 8 | 0.3 | 0.253 | 0.877 | |
| 774.2 | 0.34 | 217.1 | 7 | 0.2 | 0.252 | 0.855 | |
| 778.1 | 0.34 | 247.9 | 6 | 0.5 | 0.261 | 0.820 | |
| 780.2 | 0.35 | 319.5 | 16 | 1.2 | 0.263 | 0.807 | |
| 781.1 | 0.33 | 339.6 | 20 | 1.2 | 0.267 | 0.807 | |
| 782.1 | 0.31 | 656.3 | 34 | 1.0 | 0.257 | 0.815 | |
| 783.2 | 0.30 | 473.4 | 30 | 2.0 | 0.253 | 0.833 | |
| 784.2 | 0.32 | 346.2 | 24 | 0.7 | 0.261 | 0.857 | |
| 785.3 | 0.24 | 212.3 | 12 | 0.4 | 0.257 | 0.890 | |
| 786.1 | 0.33 | 267.7 | 11 | 0.4 | 0.255 | 0.914 | |
| 790.1 | 0.34 | 191.4 | 4 | 0.3 | 0.258 | 1.006 | |
| 794.2 | 0.34 | 206.7 | 1 | 0.2 | 0.256 | 1.044 | |
| 800.2 | 0.32 | 276.8 | 10 | 0.3 | 0.255 | 1.053 | |
| 810.2 | 0.34 | 279.5 | 3 | 0.4 | 0.240 | 1.043 | |
| 820.1 | 0.36 | 315.2 | 2 | 0.3 | 0.244 | 1.035 | |
| 840.2 | 0.35 | 677.5 | 8 | 0.8 | 0.247 | 1.025 | |
| 880.0 | 0.41 | 376.0 | 7 | 0.5 | 0.222 | 1.001 | |
| 919.9 | 0.44 | 478.6 | 8 | 0.3 | 0.256 | 0.916 | |
| 939.9 | 0.43 | 469.0 | 22 | 0.7 | 0.248 | 0.856 | |
| 949.7 | 0.32 | 261.7 | 20 | 0.3 | 0.261 | 0.855 | |
| 957.7 | 0.32 | 233.9 | 13 | 0.2 | 0.263 | 0.858 | |
| 969.7 | 0.34 | 251.5 | 29 | 0.5 | 0.250 | 0.865 |
3 Fitting of the cross section
The fitting procedure maximizes the logarithmic likelihood function
where is a Poisson probability to detect observed number of events in the -th energy bin with a theoretical expectation of . The theoretical expectations were calculated as
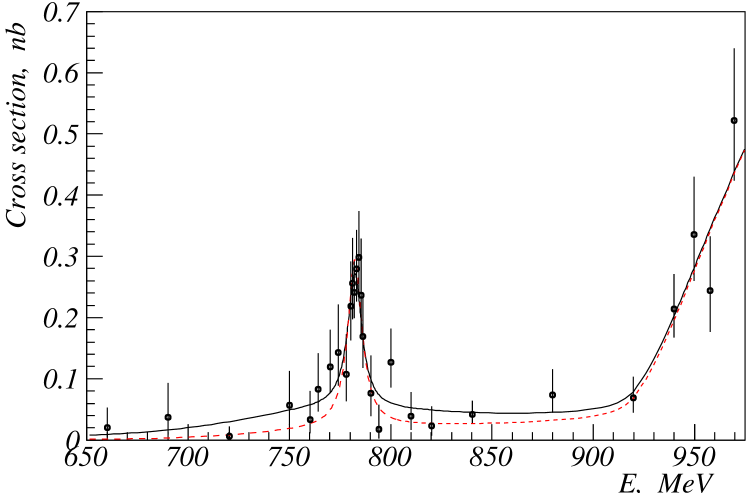
where is a calculated number of background events, is a detection efficiency, is the integrated luminosity, is cross section depending on a set of approximation parameters, is a radiative correction. The radiative correction, which is a functional of the cross-section energy dependence [15], was determined within the fitting procedure. The values of radiative correction evaluated for each experimental energy point are listed in Table 2. The model error of the value does not exceed 3%. The values of the experimental cross section calculated as
are shown in Fig.4 and listed in Table 2. The systematic error of the cross section is determined by the the errors of the detector efficiency, integrated luminosity, and radiative correction. It was estimated to be 7%.
To calculate the cross section the amplitude of the process was parametrized as
| (9) |
The first term in Eq.(9) is the amplitude of the , where and are excitations of the . Second and third terms are and amplitudes. Each amplitude is written in a factorized form. The functions , , depending on the momenta of final particles describe the dynamics of vector mesons decays. The functions describe the Breit-Wigner resonance shapes:
Here and are resonance mass and energy dependent width. The cross section is calculated from Eq.(9) by integration over the phase space of final particles: . At the energy above threshold the Breit-Wigner functions of mesons are modified , where are Blatt-Weisskopf factors, restricting fast growth of the partial widths [16]:
| (10) |
Here is the meson momentum in decay. The range parameter is supposed to be the same for mesons. The main decay modes of mesons were taken into account for calculation of the energy dependence of the resonance widths. For instance, in the case of we use the following expression:
| (11) |
Here is a pion momentum in the decay. The Blatt-Weisskopf factor is expressed by the formula similar to Eq.(10).
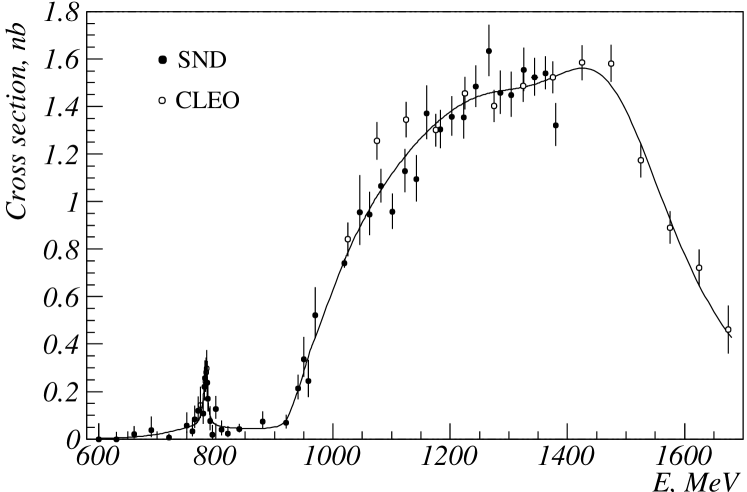
The amplitude of the process is described by formulas from Ref. [14, 17] and depends on 8 parameters. The data from energy region below 1 GeV are insufficient to determine them. Therefore we used additional measurements of the cross section in the 1–1.4 GeV energy range by SND [17] and of the spectral function in decay by CLEO [18]. The spectral function can be converted to corresponding production cross section in collisions using CVC hypothesis [19]. The all-data fit on cross section is shown in Fig.5.
For experimental data are well described by three models with parameters listed in Table 3.
| 1 | 14.3-15.8 | — | — | — | 1630-1710 | 630-1000 | -(0.19-0.24) |
| 2 | 14.1-15.7 | 1400 | 500 | -(0.04-0.06) | 1580-1620 | 420-580 | -(0.14-0.18) |
| 3 | 15.4-16.6 | 1400 | 500 | -(0.39-0.42) | 1560-1640 | 380-780 | 0.24-0.30 |
The ranges of parameter values correspond to the variation of the parameter from 0 to 2 GeV-1. The statistical errors are not shown because they are significantly smaller than model biases. For models with two excited states the mass and width were fixed to 1400 MeV and 500 MeV. These values are close to parameters from spectral function data [20, 21].
Below threshold the amplitude of the process drops rapidly and the product in contrast with the corresponding product for transition does not demonstrate resonance behavior. This allows to separate contributions of the two decay mechanisms by measurement of energy dependence of the cross section. The decay amplitude was described by the and models from Ref. [7]. The three sets of parameters [22, 23, 7] used in the model are listed in Table 5. The model corresponds to . The parameter represents the difference between observed value of the decay amplitude and theoretical prediction.
For decay the variation of the final state phase in the CMS energy interval of the meson is small, so we cannot separate different decay mechanisms studying the cross section energy dependence. Thus the amplitude of the decay was written according to VMD model [14]. The - mixing was taken into account following Ref. [7]. Possible contributions of other mechanisms would result in a deviation of the complex parameter from 1.
Full description of the energy dependence of the cross section below 1 GeV requires extra four parameters e.g. absolute values and phases of and : , , , . But we prefer two other sets of parameters: , , , or , , , . The branching ratios are related to and as
where is a total vector meson production cross section in collisions.
Characteristic feature of the process under study is a large interference between the contributions of and decays. For instance the cross section of process at evaluated using the table value of is equal to 0.12 nb. The interference with meson increases this value up to approximately 0.25 nb (Fig.4). The experimental data on the energy dependence of the cross section are insufficient for determination of unambiguous solution for interference phases , . There are four solutions listed in Table 4.
| Model | |||||
|---|---|---|---|---|---|
| 1 | , | 35% | |||
| 2 | , | 30% | |||
| 3 | , | 6% | |||
| 4 | , | 8% | |||
The third and fourth ones correspond to a large destructive contribution into decay from mechanisms other than . The values obtained in this case disagree with existing experimental value . The solution with , can be ruled out for two reasons: exceeds the table value by 1.7 standard deviations and consistency of the calculated spectrum of the recoil photon with the experimental one is poor. The analysis of the photon spectrum is described in the next section.
For the only survivor solution with both phases close to zero, the model dependence of the fit parameters was studied. Three models of excited states (Table 3) and four sets of parameters (Table 5) were tested. The was found ranging within . These values are in agreement with theoretically expected zero value [7]. Therefore the final fitting was performed with . The phase was considered as a floating parameter to take into account its possible shift due to the contribution of mechanisms other than . The fitted is consistent with zero.
The probabilities of the and decays into obtained with different parameters of meson are listed in Table 5.
| Model | |||||||
| MeV | MeV | exp. | th. | exp. | th. | ||
| LM | 478 | 324 | 6.2-6.5 | 4.0-4.1 | 3.8 | 1.5-1.9 | 1.5 |
| LM | 555 | 540 | 6.3-6.6 | 4.2-4.3 | 2.8 | 1.9-2.3 | 0.8 |
| LM | 478 | 263 | 6.2-6.4 | 4.2-4.3 | 4.7 | 1.7-2.1 | 2.1 |
| PT | — | — | 6.5-6.9 | 3.9-4.0 | 2.9 | 1.8-2.2 | 1.0 |
The spreads in parameter values correspond to different models describing cross section above 1 GeV. All models reproduce the experimental data well. Therefore parameter midrange was taken as a final result. Its spread was regarded as the model error. The branching ratios obtained this way with statistical and systematic errors are listed in the last row of Table 5. The systematic error includes the model error, uncertainties in the detection efficiency and integrated luminosity. The variation of the background level within its systematic error practically does not change the central value and results in following additional uncertainties of the meson branching ratios: 7% for and 12% for . Since these uncertainties affect statistical significance of the results they were added to statistical errors. The energy dependence of the cross section in the model with MeV and MeV is shown in Fig. 4 together with the curve corresponding to . The value for the latter model is equal to 0.5%.
4 The energy and angular spectra
From Table 2 it is seen that selected events are mainly concentrated in two energy regions: 180 events near peak and 92 events in the range 920–970 MeV above the reaction threshold. The angular and energy distributions in the latter region agree with mechanism.
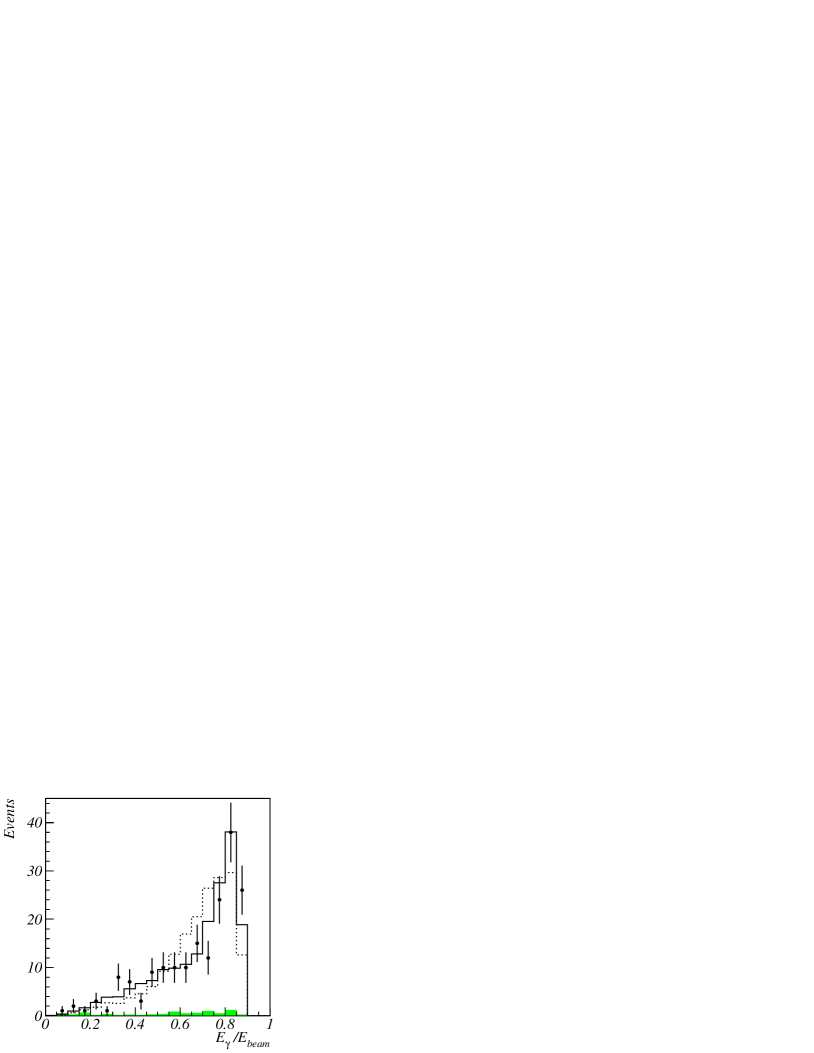

Recoil photon spectrum for events from 760–800 MeV energy range is shown in Fig.7. Although this energy region is dominated by peak the contributions of both and decays must be taken into account to obtain the theoretical spectrum. The spectrum calculated in model 3 from Table 5 (Fig.7) is in a good agreement with the experimental one. In this model it is supposed that decay proceeds through intermediate state. Another way is to describe the decay by a sum of contributions of and mechanisms. To do this we fix at and fit the decay contribution to a value yielding observed branching ratio. In case of constructive interference this leads to and the photon spectrum close to that expected for mechanism. As was shown in the previous section, assumption of destructive interference results in inconsistent with the PDG table value.
The second theoretical spectrum in Fig.7 corresponds to the model 2 from Table 4 with destructive interference of and amplitudes in decay. For this model the consistency between theoretical and experimental spectra calculated using Kolmogorov test [24] is about 1%, which was one of the reasons to discard this model.
Additional information about mechanism of decay can be obtained from the analysis of angular distributions. One of such distribution is shown in Fig.7. The same figure displays the theoretical distributions obtained under assumptions that decay proceeds through either pure intermediate state or a mixture of and . One can see that our limited statistics does not allow to distinguish these two models.
5 Summary
The branching ratios measured in this work,
| (12) |
| (13) |
are in a good agreement with our preliminary results [2] and GAMS measurement [3], but have higher accuracy.
The probability of decay significantly exceeds VMD model prediction . This excess can be explained by the contribution of the decay via scalar state . Two mechanisms, and , can be separated using difference in energy dependence of their amplitudes. Our result on decay
| (14) |
differs from zero by 2.4 standard deviations and is consistent with the predictions of chiral models [7, 9]. The magnitude of is sensitive to parameters. As can be seen from Table 5, the models with MeV give the most consistent description of the experimental data.
The value of the branching ratio , obtained by averaging of our measurement with the GAMS result exceeds theoretical predictions, [7, 11] and [9], by 1.3 standard deviations. It is necessary to make some remarks about these predictions. The result of Ref. [11] is based on table value of keV [25]. It must be corrected taking into account newer measurement keV [26], which is close to the value for charged , keV [25]. This decreases the predicted and worsens agreement with the experiment. In the Refs. [7] and [9] the values of equal to 15 GeV-1 and 15.9 GeV-1 were used to calculate . On the other hand, the use of these values for VMD calculation of and leads to too large values conflicting with experimental data. For example, the obtained from width assuming intermediate state is equal to GeV-1 [14]. Therefore, our opinion is that is the maximum branching ratio acceptable within VMD model and the additional theoretical study is required to explain the large value of .
6 Acknowledgments
This work is supported by “Russian Fund for Basic Researches” grants No. 01-02-16934-a and 00-15-96802 and STP “Integration” Fund, grant No. A0100.
References
- [1] M.N. Achasov et al., Nucl. Instr. Meth. A 449 (2000) 125.
- [2] M.N. Achasov et al., JETP Letters, 71 (2000) 355.
- [3] D. Alde et al., Phys. Lett. B 340 (1994) 122.
- [4] P. Singer, Phys. Rev. 128 (1962) 2789.
- [5] A. Bramon, A. Grau, G. Pancheri, Phys. Lett. B 283 (1992) 416.
- [6] A. Bramon, A. Grau, G. Pancheri, Phys. Lett. B 289 (1992) 97.
- [7] A. Bramon et al., Phys. Lett. B 517 (2001) 345.
- [8] E. Marco et al., Phys. Lett. B 470 (1999) 20.
- [9] J. E. Palomar, S. Hirenzaki, E. Oset, e-print hep-ph/0111308.
- [10] A. Gokalp, O. Yilmaz, Phys. Lett. B 508 (2001) 25.
- [11] D. Guetta, P. Singer, Phys. Rev. D 63 (2001) 017502.
- [12] A. Gokalp, O. Yilmaz, Phys. Lett. B 494 (2000) 69.
- [13] A.V. Bozhenok, V.N. Ivanchenko, Z.K. Silagadze, Nucl. Instr. Meth. A 379 (1996) 507.
- [14] M.N. Achasov et al., Nucl. Phys. B 569 (2000) 158.
- [15] E.A. Kuraev, V.S. Fadin, Sov. J. Nucl. Phys. 41 (1985) 466.
- [16] A.B. Clegg, A. Donanachie, Z. Phys. C 62 (1992) 455.
- [17] M.N. Achasov et al., Phys. Lett. B 486 (2000) 29.
- [18] K.W. Edwards et al., Phys. Rev. D 61 (2000) 072003.
- [19] Y.S. Tsai, Phys. Rev. D 4 (1971) 2821.
- [20] R. Barate et al., Z. Phys. C 76 (1997) 15.
- [21] S. Anderson et al., Phys. Rev. D 61 (2000) 112002.
- [22] E.M. Aitala et al., Phys. Rev. Lett. 86 (2001) 770.
- [23] D.M. Asner et al., Phys. Rev. D 61 (2000) 012002.
- [24] HBOOK Reference Manual, CERN program library Y250, 1998, p.90.
- [25] Review of Particle Physics. Eur. Phys. J. C 15 (2000) 1.
- [26] M.N. Achasov et al., e-print hep-ex/0109035.