IMPROVED MEASUREMENT OF ASYMMETRY
IN THE NEUTRAL MESON SYSTEM
T. Higuchi
aaaThe author is a Research Fellow of the Japan Society for the Promotion of Science. (for the Belle collaboration)
We present an improved measurement of the standard model violation
parameter (also known as ) based on a sample of
pairs collected at the resonance
with the Belle detector at the KEKB asymmetric-energy collider.
One neutral meson is reconstructed in the , ,
, , , or -eigenstate
decay channel and the flavor of accompanying meson is identified from its
decay products. From the asymmetry in the distribution of the time intervals
between the two meson decay points, we obtain
.
The result is preliminary.
In the Standard Model (SM), violation arises from an
irreducible complex phase in the weak interaction quark mixing matrix
(CKM matrix).
In particular, the SM predicts a violating asymmetry
in the time-dependent rates for and decays to a common
eigenstate, ,
with negligible corrections from strong interactions:
(1)
where is the decay rate for a or
to dominated by transition
at a proper time after production, is the eigenvalue of
, is the mass difference between the two mass eigenstates,
and is one of the three interior angles of the CKM unitarity triangle,
defined as .
In this paper, we report an improved measurement of using
pairs (42 fb-1) collected with the Belle detector at the resonance in collisions of 8.0 GeV to
3.5 GeV at KEKB, where two mesons reside in a coherent
-wave state until one of
them decays. The decay of one of the mesons to a self-tagging state,
, i.e., a final state that distinguishes and
, at a time projects the accompanying meson onto the
opposite -flavor at that time; this meson decays to at time
. The violation manifests itself as an asymmetry ,
where is the proper time interval .
At KEKB, the resonance is produced with a boost of
along the electron beam direction ( direction). Because
the and mesons are nearly at rest in the center
of mass system (cms), can be determined as ,
where is the distance
between the and decay vertices, .
The average value for is approximately 200 m.
We reconstruct decays to the following eigenstates
bbbThroughout this paper, when a decay mode is quoted,
the inclusion of the charge conjugation mode is implied.:
, , , for and
for = +1. We also use decays where
. Here the final state is a mixture of even and odd
, depending on the relative orbital angular momentum of the
and . We find that the final state is primarily ; the
fraction is .
For reconstructed candidates except ,
we identify decays using the
energy difference and the
beam-energy constrained mass
, where
, , and are the beam
energy, the energy, and the momentum of the reconstructed candidate in the
cms, respectively.
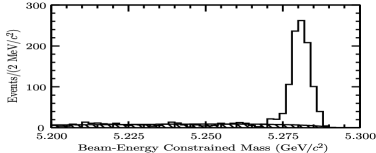
Figure 1 (top) shows the distributions for all
candidates except for that are found in the signal
region.
Figure 1: (Top) the beam-energy constrained mass distribution for all decay modes
combined other than .
(Bottom) the distribution for candidates with the results of the fit.
Table 1: The numbers of observed candidates () and the estimated
background () in the signal region for each mode.
Mode
636
31.2
102
20.8
49
2.4
57
4.3
34
2.3
39
11.1
33
8.9
55
6.0
767
307
Table 1 lists the
numbers of observed candidates () and the background ()
estimated by extrapolating the rate in the non-signal vs region
into the signal region.
Candidate decays are selected by requiring
electromagnetic calorimeter
(ECL) and/or and muon detector
(KLM) hit patterns that are consistent with the presence of a shower
induced by a neutral hadron.
The centroid of the shower is required to be
in a cone centered on the direction that is inferred from
two-body decay kinematics and the measured four-momentum of the .
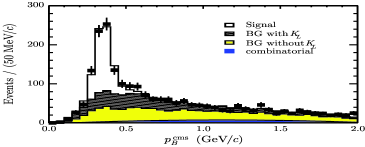
Figure 1 (bottom) shows the distribution,
calculated with the two-body decay hypothesis. The histograms
are the results of a fit to the signal and background distributions.
There are 767 entries in total in the region GeV/ with KLM clusters and in GeV/ with
clusters in the ECL only.
The fit finds a signal purity of 60%.
The reconstruction and selection criteria for used channels
are described elsewhere.
Leptons, charged pions, kaons, and baryons that are not associated
with a reconstructed eigenstate decay are used to identify the -flavor
of the accompanying meson;
high momentum leptons from ,
lower momentum leptons from ,
charged kaons and baryons from ,
fast pions from (, etc.), and
slow pions from .
Using those tracks, two parameters, and , are assigned to an event.
The first, , has the discrete values that is
when is likely to be a (), and the parameter is an
event-by-event flavor-tagging dilution factor ranging from for no flavor
discrimination to for unambiguous flavor assignment. It is used only
to sort data into six intervals of , according to flavor purity;
the wrong-tag probabilities, , for the final fit are determined
directly from data.
The decay to exclusively reconstructed self-tagged channels
are utilized to obtain using time-dependent - mixing
oscillation: . Here and are the numbers of opposite
and same flavor events.
The total effective tagging efficiency is ,
where is the event fraction for each interval.
The vertex position for is reconstructed using leptons from
decay and that for is obtained with well reconstructed tracks
not assigned to . Tracks that form a invariant mass are not used.
Each vertex position is required to be consistent with the interaction
point profile smeared in the - plane by the meson decay length.
The requirement enables us to determine a vertex even with a single track.
The fraction of such vertices is about 10% for and 30% for .
A proper-time interval resolution, ,
consists of a convolution of four components:
detector resolution for and , shift in the reconstruction
due to secondary tracks originated from charmed hadrons such as and , and
smearing effect due to kinematic approximation in converting
to .
We find broad outlier components in distributions due to
mis-reconstruction, which are represented by Gaussian distributions.
We simultaneously
determine ten resolution parameters from data with a fit of neutral
and charged meson lifetimes
and obtain a resolution of ps (rms).
The width and the fraction of the outlier component are determined to be
ps, and or
(multiple- or single-track case).
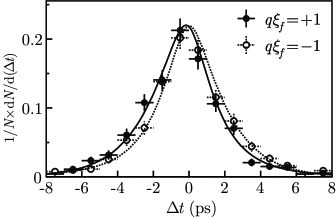
After vertexing we find 766 events with flavor tags and 784 events
with . Figure 2 shows the observed distributions
for the (solid points) and (open points) event samples.
The asymmetry between two distributions demonstrates the violation of the
symmetry.
Figure 2: distributions for the events with (solid points)
and (open points). The results of the global fit with
are shown as solid and dashed curves, respectively.
Table 2: The values of for various subsamples (statistical errors only).
Sample
except
All
We determine from an unbinned maximum-likelihood fit to the observed
distributions. The probability density function (pdf) expected
for the signal distribution is given by
(2)
where we fix the lifetime and mass difference at their world average
values.
Each pdf is convolved with the appropriate
to determine the likelihood value for each event as a function of :
(3)
where is the signal probability calculated
as a function of for and of and for
other modes.
is a pdf for combinatorial background events
that is modeled as a sum of exponential and prompt components. It is convolved
with a sum of two Gaussians, .
and are the pdf and the fraction for the outlier
component.
The only free parameter in the final fit is , which is determined by
maximizing the likelihood function , where the product is over
all events. The preliminary result of the fit is
The systematic error is dominated by uncertainties due to effects of the tails
of the vertex distribution (0.030). Other significant
contributions come from uncertainties
(a) in ();
(b) in the resolution function parameters ();
(c) in the background fraction ().
The errors introduced by uncertainties in and are 0.01 or less.
A number of checks on the measurement are performed. Table 2
lists the results obtained by applying the same analysis to various subsamples.
All values are statistically consistent with each other.
The result is unchanged
if we use the ’s determined separately for and .
A fit to the non- eigenstate self-tagged modes ,
, and , where no asymmetry is expected,
yields .
We also measure violating asymmetry in decays
based on pairs.
Numbers of fully reconstructed events
for and for
are and , respectively.
Flavor of the accompanying meson is identified from its decay products.
The decay rate has a time dependence given by
(4)
From the asymmetry in the distribution,
we obtain and
.
References
References
[1] M. Kobayashi and T. Maskawa, Prog. Theor. Phys.49,
652 (1973).
[2] A. B. Carter and A. I. Sanda, Phys. Rev. D 23, 1567 (1981); I. I. Bigi and A. I. Sanda, Nucl. Phys. B193, 85 (1981).
[3] Belle Collaboration, A. Abashian et al., Nucl. Instrum. Methods Phys. Res., Sect. A 479, 117 (2002).
[4] E. Kikutani ed., KEK Preprint 2001-157 (2001), to appear in Nucl. Instrum. Methods.
[5] Belle Collaboration, K Abe et al., “Measurement of Polarization and Asymmetry in Decays” (2001); BELLE-CONF-0105.
[6] Belle Collaboration, K Abe et al., Phys. Rev. Lett.87, 091802 (2001); Belle Collaboration, K Abe et al., arXiv:hep-ex/0202027 submitted to Phys. Rev. D.
[7] Belle Collaboration, K Abe et al., Phys. Rev. Lett.88, 171801 (2002).
[8] D. E. Groom et al., Eur. Phys. J. C 15, 1 (2000).