SLAC-PUB-9059
B A B AR-PROC-01/97
November, 2001
Violation in the meson system with BaBar
J. Weatherall
Department of Physics and Astronomy
University of Manchester, Oxford Road
Manchester, M13 9PL, UK
(for the B AB AR Collaboration)
Abstract
The B A B AR detector, at the PEP-II asymmetric Factory at SLAC collected a sample of 32 million pairs whilst operating at energies near the resonance between October 1999 and May 2001. An study of time-dependent -violating asymmetries in events where one neutral meson is fully reconstructed in a final state containing charmonium produced the measurement , which constitutes an observation of violation in the meson system at the 4 level. Also presented are preliminary results from a study of violation in the decays and .
Contributed to the Proceedings of the
Seventh Topical Seminar on the Legacy of LEP and SLC
8-11 October 2001, Siena, Italy
Stanford Linear Accelerator Center, Stanford University, Stanford, CA 94309
Work supported in part by Department of Energy contract DE-AC03-76SF00515.
1 Introduction
violation was first observed in the decays of mesons in 1964 [1]. It was 37 years before this phenomenon was observed in another system, that of the neutral mesons. The effect arises from the existence of an irremovable, -violating phase in the three-generation CKM quark-mixing matrix [2]. The system has an important advantage over the system in that the measurements of -violating asymmetries provide a direct test of the Standard Model of electroweak interactions, free of corrections from strong interactions, which arise when trying to interpret the results from decays. The primary goal of B A B AR is to over-constrain the Unitarity Triangle through multiple, independent measurements of its sides and angles. In this analysis, the angle is probed through a measurement of using decays.
2 PEP-II and B A B AR
The PEP-II factory at SLAC comprises a pair of storage rings producing asymmetric collisions (9 GeV , 3.1 GeV ) at a center-of-mass energy corresponding to the mass of the resonance (10.58 GeV). The decays almost exclusively to or coherent pairs. The primary goal of the B A B AR detector for this analysis is to measure the time difference between the two meson decays, . The asymmetric nature of the collisions gives a boost of which yields an average spatial vertex separation of .
A detailed description of the B A B AR detector can be found in [3]. The volume inside the 1.5T superconducting solenoid consists of a five layer silicon vertex detector (SVT), a drift chamber (DCH), a quartz Cerenkov detector (DIRC) and a CsI(Tl) crystal electromagnetic calorimeter (EMC). The instrumented flux return (IFR) outside the magnet comprises alternate layers of iron and resistive plate counters (RPCs).
3 Exclusive reconstruction
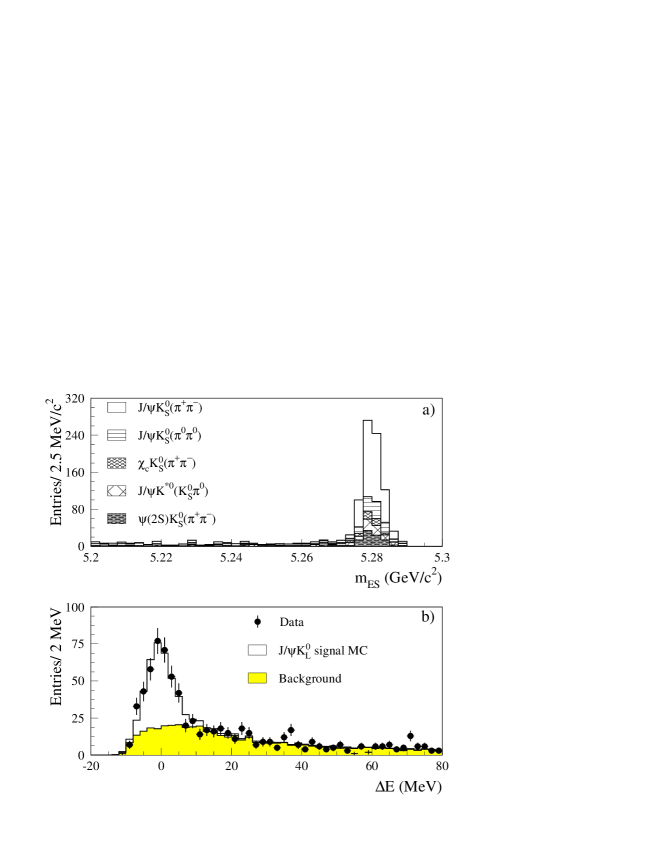
A sample of neutral mesons, have been fully reconstructed in their decays to final states of known content: , , , and . In addition there are also samples of decays to final states of definite flavour (): , , and as well as charged decays: , and (charge conjugate modes are implied throughout this paper). All selections have been optimized to give maximum sensitivity to the final measurement. Particle identification, mass (or mass difference) and vertex constraints are used wherever applicable. The resulting signal yield for each mode is identified by using the kinematical variables and where , are the center-of-mass energy and momentum of the reconstructed and is the beam energy in the center-of-mass. In the case that an event has more than one candidate, only the one with the smallest is retained. For each mode a signal region is defined as about (5.279,0) in the plane. The resolution is , dominated by the spread of the beam energy. The resolution is mode dependent and varies from about 10-33 MeV. Figure 1 shows the distributions for candidates containing a and the distribution for candidates containing a . The number of tagged events and the signal purities, determined from fits to the (all modes except ) or ( mode) distributions in data or from Monte Carlo simulation ( mode) are shown in table 1.
| Sample | Purity (%) | ||
| ,, | 0.56 0.15 | ||
| 0.70 0.34 | |||
| 0.82 1.00 | |||
| Full sample | 0.59 0.14 | ||
| , , only | |||
| () | 0.45 0.18 | ||
| () | 0.70 0.50 | ||
| () | 0.47 0.42 | ||
| () | 2.59 | ||
| Lepton tags | 0.54 0.29 | ||
| Kaon tags | 0.59 0.20 | ||
| NT1 tags | 0.67 0.45 | ||
| NT2 tags | 0.10 0.74 | ||
| tags | 0.50 0.22 | ||
| tags | 0.61 0.22 | ||
| non- sample | 0.02 0.04 | ||
| Charged non- sample | 0.03 0.04 | ||
4 Flavour Tagging
Flavour tagging information is extracted from the other (partially reconstructed) in the event, . The coherent production of the pair ensures that the flavour of is exactly opposite to that of at the time when decays, . Each event is assigned to one of four hierarchical, mutually exclusive tagging categories or excluded from further analysis. The Lepton and Kaon categories contain events with high momentum leptons from semileptonic decays or with kaons whose charge is correlated with the flavour of the decaying quark (e.g. a positive lepton or kaon yields a tag). The NT1 and NT2 categories are based on a neural network algorithm whose tagging power arises primarily from soft pions from decays and from recovering unidentified isolated primary leptons. The sample is used to measure the tagging performance along with the events. The figure of merit used is where and are the efficiency and mistag fraction for category . The statistical error on is proportional to , where . The efficiencies and mistag fractions for the four tagging categories are shown in table 2.
| Category | |||
|---|---|---|---|
| Lepton | |||
| Kaon | |||
| NT1 | |||
| NT2 | |||
| All |
5 measurement and resolution
The time difference between the two decays, = is determined by first measuring their spatial separation . This is corrected on an event-by-event basis for the direction of the with respect to the direction in the frame. is determined from the charged tracks that constitute the candidate. All other tracks in the event are fitted to a common vertex in order to calculate the decay position, . Tracks from photon conversions are removed. Pairs of tracks compatible with the decay of a long lived or are replaced by their parent neutral pseudotrack. The bias in the forward direction due to charm decays is reduced by removing the track with the largest contribution to the vertex , if above 6 and iterating the fit until either no track fulfills this condition or fewer than two tracks remain. Knowledge of the beam spot location and beam direction is incorporated through the addition of a pseudotrack to the tagging vertex, computed from the vertex and three-momentum, the beam spot (with a vertical size of 10 ) and the momentum. The total reconstruction efficiency is 97%. For 99% of the reconstructed vertices the r.m.s. resolution is 180 , dominated by the vertex. An accepted candidate must have a converged fit for the and vertices, an error of less than 400 on and a measured .
The resolution function for signal events is represented as a sum of three Gaussian distributions. All offsets are modelled to be proportional to the event-by-event error, , which is correlated with the weight that the daughters of long-lived charm particles have in the tag vertex reconstruction. The ‘core’ and ‘tail’ Gaussians have widths scaled by the event-by-event measurement error derived from the vertex fits. A separate offset for the core distribution is allowed for each tagging category to account for small shifts caused by inclusion of residual charm decay products in the tag vertex. The third Gaussian has a fixed width of 8 ps and accounts for fewer than 1% of events with incorrectly reconstructed vertices. Identical resolution function parameters are used for all modes, since the resolution is dominated by the vertex precision. Separate resolution function parameters have been used for data collected in 1999-2000 and 2001, due to the significant improvement in the SVT alignment.
6 Measuring
6.1 Improvements to the analysis
There are several significant changes in this analysis [4] relative to the first B A B AR publication [5]. The modes and have been added. Improvements in track and reconstruction efficiency in 2001 data produce a increase in the yields per luminosity unit. Better alignment of the tracking systems in 2001 data and improvements in the tag vertex reconstruction algorithm have increased the sensitivity of the measurement by an additional 10%. The purity of the sample has been increased by a reoptimization of the selection. In total, the statistical power of the analysis is almost doubled with respect to that of Ref. [5]. The final sample contains about 640 events, the sample has 7591 fully reconstructed events and the charged sample has 6814 fully reconstructed events.
6.2 The fit
The fit for is based on the following framework. Each event in the sample is examined for evidence that the decayed as a or . The decay distributions as a function of time for events with either type of tag can be expressed in terms of a complex parameter that depends both on mixing and the amplitudes describing and decay to a common final state [6]. The distribution f+(f-) of the decay rate when the tag is a is
where is the lifetime and is the oscillation frequency of mixing. The first oscillatory term is due to interference between direct decay and decay after mixing. A difference between the and distributions or a asymmetry for either flavour tag is evidence for violation.
In the Standard Model, for decays containing charmonium where is the eigenvalue of the state and is an angle of the Unitarity Triangle. Thus, the time-dependent -violating asymmetry is
where for , and and for . Due to the presence of even (L=0,2) and odd (L=1) orbital angular momenta in the system there can be -even and -odd contributions to the decay rate. When the angular information in the decay is ignored, the measured asymmetry in is reduced by a dilution factor , where is the fraction of the L=1 component. It has been measured as which, after acceptance corrections leads to an effective for this mode.
The and samples are used together in the unbinned maximum likelihood fit for the extraction of . A total of 45 parameters are varied in the fit, including (1), the average mistag fraction and the difference between and mistags for each tagging category (8), parameters for the signal resolution (16) and parameters for background time dependence (9), resolution (3) and mistag fractions (8). The determination of the mistag fractions and signal resolution function is dominated by the large sample. Background parameters are governed by events with . As a result, the largest correlation between and any linear combination of the other free parameters is only 0.13. The lifetime and mixing frequency are fixed at and respectively [7]. The value of and the asymmetry in the distribution were hidden using a blind analysis method (as described in [5]) until the event selection was optimized and all other aspects of the present analysis were complete.

Figure 2 shows the distributions and as a function of overlaid with the likelihood fit results for the candidates. The probability of obtaining a lower likelihood value than the one from the fit, evaluated using a Monte Carlo technique, is 27%. The simultaneous fit to the full sample yields
6.3 Systematic errors and consistency checks
The systematic error is dominated by the parametrization of the resolution function (0.03) - due in part to residual uncertainties in SVT alignment, possible differences in the mistag fractions between the and samples (0.03) and uncertainties in the level, composition and asymmetry of the background in the selected events (0.02).
The large sample of reconstructed events allows a number of consistency checks, including separation of the data by decay mode, tagging category and flavour. The results of fits to these subsamples and to the samples of non- decay modes (where no statistically significant asymmetry is found) are shown in table 1.
7 Results from decays
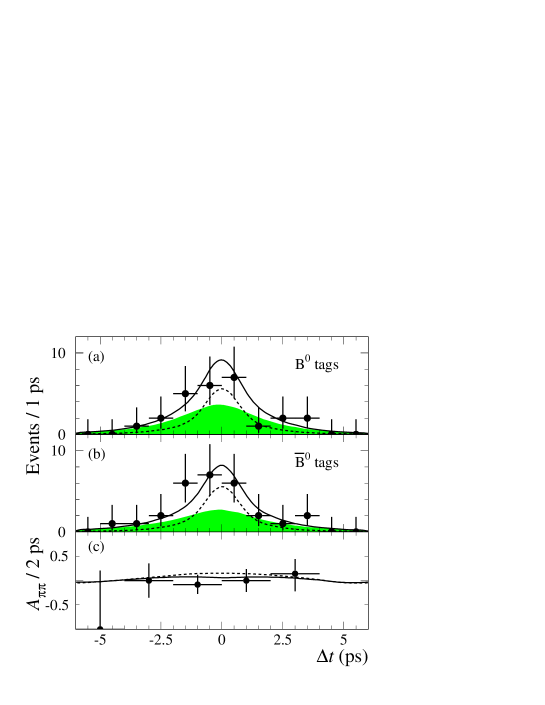
A search for -violating asymmetries in decays of to two light mesons has been carried out on a sample of 33 million pairs [8]. Here one hopes to measure although the analysis is complicated by the possibility of penguin pollution leading to diagrams with different weak and strong phases contributing to the same final state. In this case, one has to allow for direct violation and in general . The fit is then complicated by the presence of a cosine term as well as the coefficient of the sine term containing , where depends on the magnitudes and strong phases of the tree and penguin amplitudes. The selected signal sample consists of , 217 18 and events. The results for -violating asymmetries are summarized in table 3. Here and are respectively the coefficients of the sine and cosine terms in the expression for f and
Figure 3 shows the distributions and the asymmetry for tagged events which are enhanced in signal decays.
| Parameter | Central Value | 90% C.L. Interval |
|---|---|---|
| [-0.89,+0.85] | ||
| [-1.0,+0.47] | ||
| [-0.21,+0.07] |
8 Conclusions and outlook
The measurement of presented here establishes violation in the meson system at the 4.1 level, 37 years after its discovery in the Kaon system. The probability of obtaining this value of or higher in the absence of violation is . This direct measurement is consistent with the range implied by measurements and theoretical estimates of the magnitudes of CKM matrix elements [9]. By the summer of 2002, with a data sample of more than 100 million pairs a measurement of with a precision of less than 0.1 will be possible.
In addition the search for -violating asymmetries in the decays and looks promising and with a similar amount of data should yield errors of on the asymmetries.
References
- [1] J. H. Christenson, J. W. Cronin, V. L. Fitch and R. Turlay, Phys. Rev. Lett. 13 (1964) 138.
- [2] N. Cabibbo, Phys. Rev. Lett. 10 (1963) 531. M. Kobayashi and T. Maskawa, Prog. Theor. Phys. 49 (1973) 652.
- [3] B. Aubert et al. [BABAR Collaboration], SLAC-PUB-8569, hep-ex/0105044, to appear in Nucl. Instr. and Methods.
- [4] B. Aubert et al. [BABAR Collaboration], Phys. Rev. Lett. 87 (2001) 091801, hep-ex/0107013.
- [5] B. Aubert et al. [BABAR Collaboration], Phys. Rev. Lett. 86 (2001) 2515
- [6] See, for example L. Wolfenstein, Eur. Phys. J. C 15 (2000) 115.
- [7] D. E. Groom et al. [Particle Data Group Collaboration], Eur. Phys. J. C 15 (2000) 1.
- [8] B. Aubert et al. [BABAR Collaboration], hep-ex/0110062.
- [9] See, for example, F.J. Gilman, K. Kleinknecht and B. Renk, Eur. Phys. Jour. C 15, 110 (2000).