]http://superk.physics.sunysb.edu/ jimhill/
K2K (KEK-E362) Collaboration
Results from the K2K Long–Baseline Neutrino Oscillation Experiment
Abstract
The K2K Long–Baseline neutrino oscillation experiment has been aquiring data since mid-1999 and has analysed those up to March of 2001. Forty-four fully contained events are observedin the fiducial volume of the far detector where are expected based partly on measurements near the beam production point. There is virtually no background for the contained event search. The methods established in this experiment are crucial for operation of future similar experiments to probe the nature of mixing in the neutral lepton sector, a necessary step in understanding the nature of family structure and of mass itself. A brief history and a few notes about the future and direction of the field precede the description of the experiment and its results.
I Motivation for long–baseline experimentation
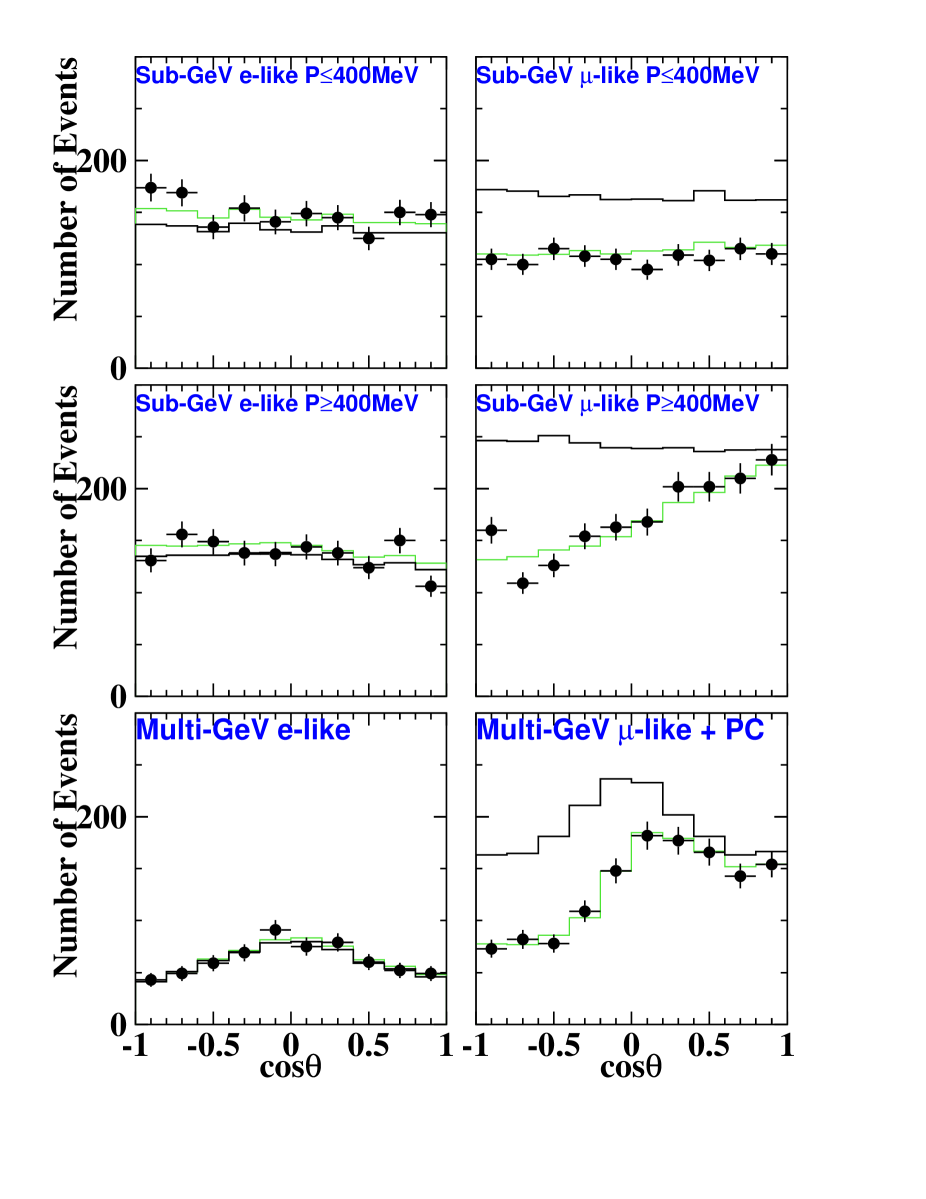
K2K Plenary_hill_0712_ref1 is the world’s first experiment designed specifically to search for oscillations in the neutral lepton sector using the technique of long–baseline experimentation. The main motivation for long–baseline accelerator based neutrino experiments lies in the results provided by the analysis of atmospheric neutrino data Plenary_hill_0712_ref2 . Figure 1 shows the most current information from Super–Kamiokande regarding the zenith angle distributions of various event classes in the atmospheric neutrino sample. A detailed explaination of the plots in the figure is given below. Earlier atmospheric neutrino experiments generally gave consistent results although with much lower statistics.
I.1 Historic Results Implying Neutrino Oscillation
The first observation of atmospheric neutrinos Plenary_hill_0712_ref3 came in the 1960’s from underground experiments searching for proton decay. Atmospheric neutrino studies began in earnest in the 1980’s when proton decay experimenters realized the need to understand their backgrounds better. The first indications of the so-called “atmospheric neutrino anomaly” from the water Čerenkov detectors Kamiokande and IMB Plenary_hill_0712_ref4 ; Plenary_hill_0712_ref5 were that the observed flavor ratio of atmospheric neutrinos did not match the expectation. Originally, the Soudan, NUSEX Plenary_hill_0712_ref6 , and Frejus Plenary_hill_0712_ref7 experiments, which used iron calorimeters, appeared to disagree with the conclusion from the water target experiments, although these lacked sufficient statistics to refute any other claim. Later analyses Plenary_hill_0712_ref8 of of Soudan’s full data set data appeared consistent with the previous water experiments and the new one, Super–Kamiokande, although still with smaller statistics.
The first generation of large water Čerenkov detectors began analyses of the directional distribution of neutrino events, but lacked the statistical power to fully exploit the information. When Super–Kamiokande began taking data in 1996, within a few years it had acquired and analyzed a sample of atmospheric neutrino events larger than the sum of all previous experiments. The larger dimensions of the detector also allow us to study higher energy events in which the neutrino reaction products are all contained within the detector. The higher density of photo-cathode coverage gives better energy resolution and slightly better directional reconstruction. Finally, the large volume gives us the statistics necessary to study the directional distribution of neutrino events in sufficient detail to address the issue of oscillations.
In figure 1, each plot is the azimuthal direction distribution for a discrete subclass of the atmospheric neutrino event event sample. Positive values of represent down-going events which have in general come from tens of km away from the atmosphere above, and negative values represent up-going events which come from neutrinos created as far as a full earth diameter away. In each case the points are data, the thick dark line is the result of simulations assuming no neutrino oscillation or other new physics, and the thin light green line is the result of simulations assuming oscillations with a parameter set resulting from a fit to these data. All plots on the left side are for single ring contained events with the ring identified as a showering type. Most of these are therefor the result of charged-current or interactions. Plots on the right are for single ring contained events with the ring identified as a non-showering type, plus (included in the set in the bottom panel) single ring events with a vertex reconstructed within the detector fiducial volume, but with the reconstructed track exiting the inner detector. In general, the average energy of events represented is highest for events at the bottom of the page and lowest at the top. The quantity plotted is the direction cosine for a charged lepton from a neutrino interaction, thus for the lowest energy events the direction is smeared by the wide scattering angle expected in low energy collisions.
While the distributions regarding showers all agree with simulations, those involving non-showering events do not. For higher energy events, the distribution is strikingly asymmetric about the horizon (). The simplest interpretation is that fewer enter the detector from below than from above. The symmetry of the earth and of the primary cosmic ray distribution suggest that no such asymmetry can exist for the production of neutrinos in the atmosphere. A simple, yet elegant, solution to this would be some process which converts neutrinos into a type unobservable in this detector as they propagate through space. Oscillations between and are an obvious candidate since the charged current interaction threshold for is relatively high and the small number of interactions that do occur are unlikely to enter the single ring sample.
I.2 The Next Steps
Super–Kamiokande proves rather conclusively that the atmospheric neutrino results demonstrate some lack of understanding of the underlying physics. The simplest amendment to the Standard Model of electro-weak interactions which would explain this is neutrino oscillations. With this strong evidence and a firm testable hypothesis, the two tasks at hand for particle physicists are to verify or refute the effect in a controlled experiment, and to probe the values of relevant parameters of the theory, possibly with a whole series of experiments each drawing on the knowledge and experience gained in the previous.
K2K is designed to explore that first step. Through the 1990’s, several similar experiments were proposed; a few of those proposals are in this generation of experiments, but only K2K has started data taking. The experiments which will follow in the next few years, MINOS Plenary_hill_0712_ref9 , the CNGS projects Plenary_hill_0712_ref10 , and some longer time scale projects generically referred to as “superbeam” or “neutrino factory” experiments represent a program of measurements to measure the full neutrino mixing matrix with precision competitive with (or in some estimations better than) the precision of corresponding measurements in the quark sector.
MINOS intends to concentrate on measurement of the parameters of mixing by using a more intense beam than K2K and a more precisely tuned distance to its far detector. A major goal is to address the issue of spectral distortions due to oscillations in a convincing quantitative way allowing a more precise determination of the mixing parameters. The CNGS experiments have chosen to concentrate instead on doing an appearance experiment to look for the presumably present in the oscillated beam. Both of these experiments should start taking data around the year 2005. They will start from the results of Super–Kamiokande and K2K and directly build on the technological background of K2K. In parallel, studies currently underway on low energy neutrinos from the sun Plenary_hill_0712_ref11 and from reactors Plenary_hill_0712_ref12 will probe another corner of the three generation mixing matrix. The farther future projects aim to explore the full character of the mixing matrix, including the possibility CP violating terms just as has been pursued in the quark sector for many years now.
I.3 The Generic Strategy of Long–Baseline Experimentation
The atmospheric neutrino results –our main motivating measurement– have as their source mostly neutrinos in the GeV momentum range which travel geographical distances. Thus, a controlled experiment to check its validity might use accelerator produced neutrinos and a detector at a well known distance some hundreds of kilometers away. To ensure full understanding of the beam at production, a near detector is useful; to reduce uncertainties of the neutrino interaction model (on which detection relies) and detector based uncertainties, the near and far detectors should preferably use the same target materials and technology for detection.
There are several aspects of the technique for long–baseline experimentation that are generic to this whole class of experiments. Two crucial aspects of this technique are fine timing and precise beam aiming to a remote site too far away to be directly measured by conventional survey. The large distance scale drives us to rely strongly on the Global Positioning System (GPS) Plenary_hill_0712_ref13 for timing synchronization. The consequent small solid angle subtended by even a large far detector motivate a spatially wide beam with redundant systems in place to check its aiming stability and a well surveyed near neutrino detector Plenary_hill_0712_ref14 capable of measuring the beam direction precisely.
II Design and overview of K2K
The K2K neutrino beamPlenary_hill_0712_ref15 is a horn-focused wide band beam, with expected spectrum peaked at about 1 GeV. The primary beam for K2K is 12 GeV kinetic energy protons from the KEK proton-synchrotron Plenary_hill_0712_ref16 . Every 2.2 s, approximately protons in nine bunches are fast-extracted in a single turn, making a 1.1 beam spill. These protons are focused onto a 30 mm diameter, 66 cm long aluminum target which is a current carrying element in the first of a pair of horn magnets operating at 250 kA.
The near detector for K2K is actually a suite of different detectors with varying capabilities situated in a hall 300 m downstream of the pion production target. The main flux measurement is based on a one-kiloton water Čerenkov detector (1kt) which uses the same photo-multipliers as Super–Kamiokande, the far detector. The design is essentially the same except for scale and the analysis for the two detectors uses the same reconstruction algorithms.
A fine grained detector sits downstream of the 1kt. The first main component of it is a scintillating fiber tracker (SciFi) Plenary_hill_0712_ref17 with water targets enclosed between layers of tracking material. The next major component is a stack of iron plates interleaved with drift tubes to serve as a muon range detector (MRD) Plenary_hill_0712_ref18 . Both the SciFi and MRD have transverse pairs of tracking planes so tracks can be reconstructed in three dimensions. The SciFi has planes of plastic scintillator upstream and downstream of it to tag incoming and outgoing particles and to record fine timing for events in common with the MRD.
The fine grained detector as a whole is excellent for event classification studies since it can readily distinguish quasi-elastic and inelastic events. The MRD is has sufficient target mass to provide a rate of neutrino interactions sufficient for beam stability monitoring. In particular, its large transverse area makes it ideal for beam profile monitoring.
The far detector for K2K is the Super–Kamiokande detector, probably the best known water Čerenkov detector in the world. It is located in a mine in Kamioka town, Gifu prefecture, Japan, 250 km from the beamline at KEK.
III Results From K2K
Any discussion of results from K2K naturally concentrates on the main goal of the experiment, the search for oscillations by comparing the near and far detector measurements. Here, we present results along this line by first detailing the near detector measurements before summarizing the data reduction and analysis at the far detector. There is not enough room here to include any deep discussion of the other results from measurements only at the near detector, so first we will list a few items currently being analyzed.
III.1 Topics Other than Neutrino Oscillations at K2K
The 1kt detector can tag electromagnetic showers with good efficiency in the momentum range of this beam. Since the beam contamination of is low (), a sample of events with are straightforward to extract. Most events with no other visible ring are the result of neutral current interactions (). Therefor, this detector can be used to measure well the cross section for this process compared to the relatively well known quasi-elastic cross section in this momentum range. Such a measurement will aid atmospheric neutrino analyses distinguishing from by the presence or absence of neutral current events.
Events with a and a non-showering ring are likely to be from the charged current process , the dominant background for an important mode of proton decay predicted by some super–symmetric theoriesPlenary_hill_0712_ref19 . Precise measurement of this interaction cross section is crucial to understanding the backgrounds for future even larger proton decay experiments.
While the K2K neutrino beam consists predominantly of neutrinos from charged pion decay, the highest energy part of the beam (GeV/c) comes almost exclusively from kaon decays. While this accounts for only about a percent of the neutrinos in the beam, there are enough such events to easily tag as coming from neutrinos that must have originated from kaons (although the geometrical acceptance is low). Most of the nuclear physics data on meson production by proton beams is quite old and the relative normalizations of different experiments has a large uncertainty. The hundred or so high energy neutrino events we already observe can help us to limit the uncertainty on the relative meson production in the target.
III.2 Near Detector Results Related to Oscillation
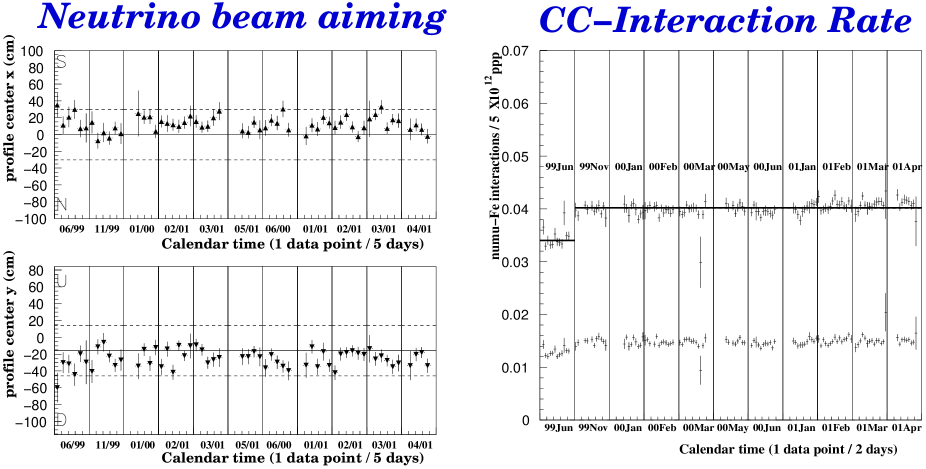
A prerequisite for any measurement in such an experiment is the direct monitoring of the stability of the beam. This is especially true for oscillation searches where aiming to the far detector is a crucial issue. A series of charged particle monitors along the beam-line measure the distribution of the progenitors and “sisters” of our neutrino beam. Many of these give crucial information about the pulse to pulse stability of the beam. More direct information about the neutrino beam can be gleaned from the near detector measurements, particularly with the large mass and area of the MRD. Figure 2 shows neutrino beam data from the MRD relati ng to the aiming and flux of neutrinos as a function of calendar time.
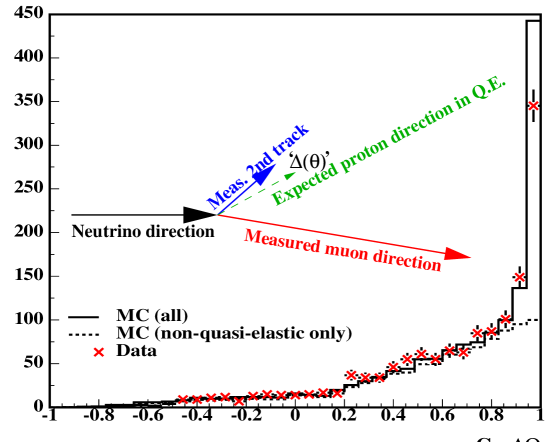
For a correct spectral measurement of the neutrino beam, background of non-quasi-elastic interactions needs to be well understood. The fine grained detector with scintillating fiber planes between water targets using the MRD as a muon calorimeter is well suited for this study since it can reconstruct two-track kinematics with great precision. Figure 3 gives some idea of how such a measurement can be done.
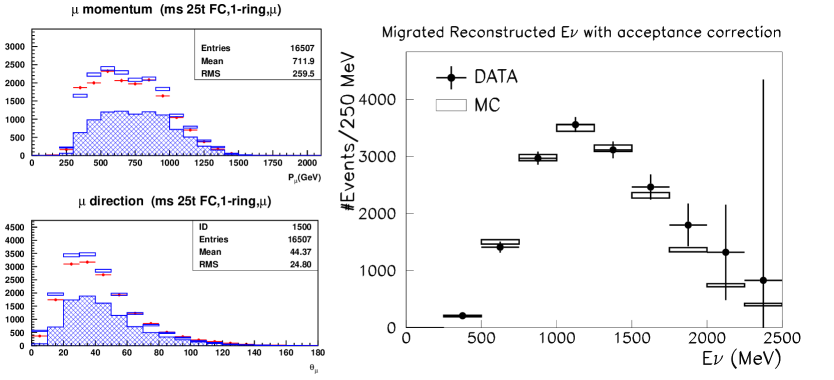
With the beam stability assured and the background measured, we can set about measuring a spectrum at the near detectors. The ideal detector for the spectral measurement is the 1kt detector since it is essentially a scale model of the far detector. It can give the absolute flux prediction for the far detector with small systematic uncertainties. After ongoing work, particularly to understand the high energy tail where information from different detectors must be combined, it will provide the basis for a well-measured spectrum which can be used in tuning our simulations. Currently, the spectral measurement is used as a check on the existing modeling. One can see from figure 4 that while there is some room for improvement, the inferred spectrum is quite similar to the simulation result. Once the efficiency for the high energy tail is better understood, we will know about the significance of the apparent small discrepancy and tune our simulations accordingly.
III.3 Far Detector Results
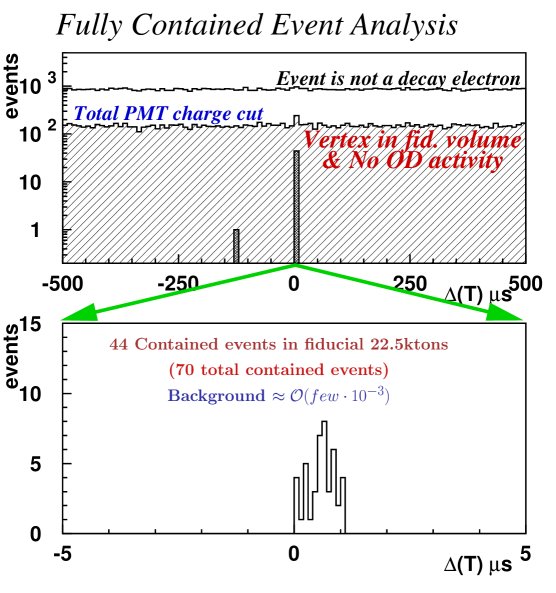
The far detector, Super–Kamiokande, aquires data constantly with over 90% live time. Physics events are all self-triggered. Timing analysis for correlation with the arrival of the K2K beam is done off-line by comparing files of timestamps from the beam channel to the GPS trigger time recorded with each SK event. The beam macro-structure of a pulse each 2.2 sec gives a duty factor small enough so that an analysis for fully contained events is virtually without background. Figure 5 shows a summary view of the data reduction for fully contained event analysis. The one millisecond window for initial selection has one event out of time with the K2K beam. This is what is expected knowing the rate of atmospheric neutrino detections and the sample size and duty factor. That one event is presumably a good atmospheric neutrino event; it is classified as a single ring showering event. The bottom plot in the figure shows an expansion of the two central bins of the upper plot for only the final fully contained fiducial volume event subsample. The definition of zero time is the expected time of arrival of the K2K beam, so assuming a syncronization random error of less than 200 ns, we expect the good events to be included in a search window from to . The factors leading to the 200 ns error are really an upper limit, and the fact that these data show no tail beyond the expected beam window seems to suggest the synchronization is actually somewhat better than that. Table 1 shows a breakdown of the contained, in fiducial volume events into subclasses.
Analysis of outside fiducial volume and outer detector events gives a total sample with which to check timing of 104 events. The outer detector search has an expected background of order one.
| Category | Observed | Exp. (no osc.) | Exp. with full mixing and in | ||
|---|---|---|---|---|---|
| 3. | 5. | 7. | |||
| FC-22.5kton (all) | 44 | ||||
| 1-ring | 26 | ||||
| -like | 24 | ||||
| -like | 2 | ||||
| multi-ring | 18 | ||||
III.3.1 A Note About the Arrival Times of Events
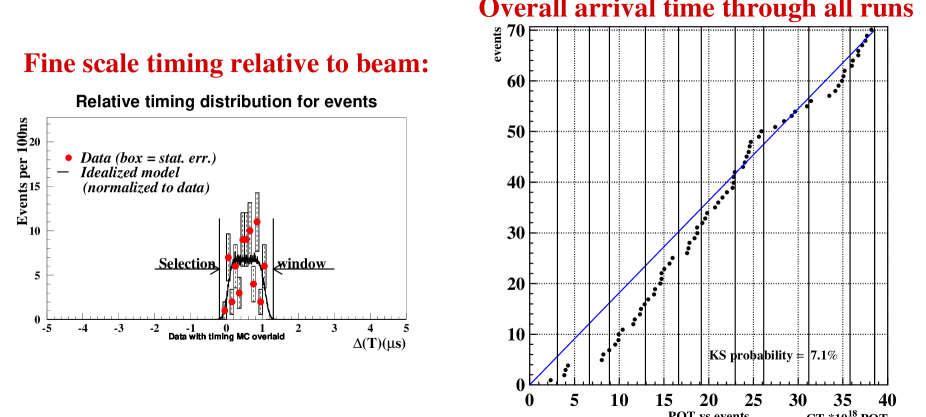
A question which arises often regards the calendar time distribution of the events observed at the far detector. The rate of these should be proportional to the rate observed at the near detector at any time. To a very good approximation, this is proportional to the rate of protons reaching the target, so the cumulative observation at the far detector plotted against the accumulated protons on target should fall roughly along a straight line. The right plot in figure 6 shows that distribution. The diagonal line in the plot is drawn from (0,0) to the last point to show the average rate of arrival.
The first approximately 8% of K2K data were taken with a different beamline configuration. This is the one point left of the first solid vertical line. The contribution of this period to the whole result (or even to the total observed deficit) is too small to change any qualitative conclusion about it. The far detector expectation is calculated using the flux information from the near detector; the rate reduction is obvious in figure 2. For reference, the overall flux measured by the far detector is approximately 70% of what is expected based on near detector total flux measurements and beam simulations.
IV Physics Interpretation of These Results
While a full quantative physics interpretation of these results is not yet possible, several important statements can be made. First, based solely on the observed number of fully contained fiducial volume events a quantitative statement about the probability of this observation for a given scenario involving oscillations can be made since the error on this expectation is relatively well understood. Secondly, while errors on the calculation of an expected neutrino spectrum are not completely understood, an expected spectrum can be constructed and from this a meaningful qualitative statement can be made about the appearance of the observed spectral shape.
There are several ways to calculate a meaningful probability to represent the power of a data set to make a statement about a hypothesis. It is probably fair to say that experts agree that the most important thing to do is to be as explicit as possible about how a given quantitative statement is derived. We have tried many methods and all give consistent results. The result of one is explained below.
A hypothesis that a priori predicts a central value expected to be higher than that of competing scenarios is disfavored at a confidence level given by:
where is the number observed, and is a gaussian approximation of the distribution of systematic errors for an expectation of with a lower side error of .
This prescription gives a probability of approximately 3% that the total number of fully contained fiducial volume events in the data sample is consistent with the hypothesis of no oscillations. This statement is independent of the information available in our measurement of the spectrum of the observed events. To make a quantitative statement using the spectrum, we need to understand the errors on the prediction of the spectrum (particularly the correlation of errors between bins of momentum). For now, only a qualitative statement can be made that the spectrum reconstructed from the K2K far detector data set, while it lacks sufficient statistics, seems at least as consistent with the hypothesis of oscillations with the atmospheric neutrino best fit parameters as it does with the no oscillations hypothesis.
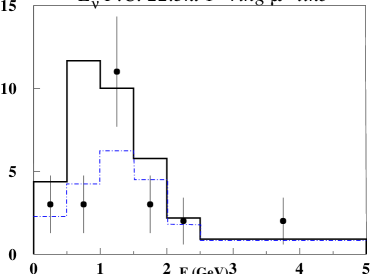
Only single non-showering ring events are most likely to be produced by quasi-elastic scatters, so only the 24 events in that subset of fully contained events in the fiducial volume are used to make a neutrino spectrum. The neutrino momentum is reconstructed from these events by assuming quasi-elastic kinematics using the well known direction of the beam. Figure 7 shows the spectrum derived from data events along with expectations with and without oscillations. The expectation from our simulations are normalized by the near detector measurement. (Later work will tune the simulation to more closely match the near detector measured spectral shape.) Since the systematic error on the expectation is still under study the only errors shown are the statistical errors on the data.
V Conclusion
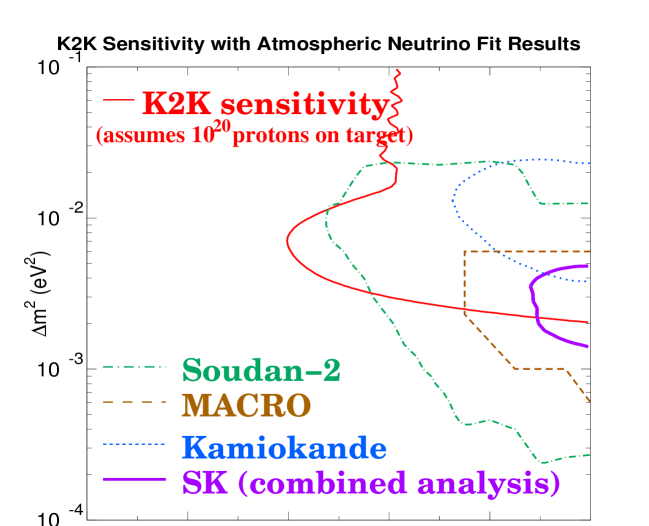
The hypothesis of no oscillations or other new physics is disfavored at approximately the level based on analysis of the total counts observed in K2K. Spectral analysis gives more information, but a quantitative statement based on it is not yet available. Within a few years, K2K expects to gather more data and study systematic errors to make a firm statement about oscillations. With the full data set, K2K will cover a sensitive region of parameter space for oscillations which overlaps significantly with the atmospheric neutrino allowed region, giving it a good chance to confirm the nature of the effect. Figure 8 shows the (90% C.L.) sensitive region of parameter space for two family mixing along with the allowed regions from various atmospheric neutrino measurements. K2K has analysed approximately 40% of the data it is scheduled to collect.
Furthermore, we should note again the significance of the successful operation of this experiment. It represents the first time in high energy physics that fine time synchronization has been successfully implemented over such large distance. The method of timing and of stability checks for aiming established by K2K will be used in a whole series of future experiments which will explore the first new physics beyond the Standard Model.
Acknowledgements.
K2K is a collaboration of approximately 100 physicists from Japan, Korea, and the U.S. hosted by both the Japanese High Energy Physics Lab, KEK, and the Institute for Cosmic Ray Research. We gratefully acknowledge the cooperation of the Kamioka Mining and Smelting Company. This work has been supported by the Ministry of Education, Culture, Sports, Science and Technology, Government of Japan, the Japan Society for Promotion of Science, the U.S. Department of Energy, the Korea Research Foundation, and the Korea Science and Engineering Foundation. We thank the KEK and ICRR Directorates for their strong support and encouragement.References
-
(1)
This first major physics paper from K2K is brief, but gives good detail
about several of the subsystems and analysis features: “Detection of Accelerator Produced Neutrinos at a Distance of 250-km,”
S. H. Ahn et al. [K2K Collaboration], Phys. Lett. B 511, 178 (2001) [arXiv:hep-ex/0103001].
A few NIM papers about subsystems are cited below. -
(2)
The full list of SK papers on atmospheric neutrinos is
rather long. Here are some important ones:
Y.Fukuda et al., Phys. Lett. B433, 9 (1998); Y.Fukuda et al., Phys. Lett. B436, 33 (1998);
Y.Fukuda et al., Phys. Rev. Lett. 81, 1562 (1998). - (3) F. Reines et al., Phys. Rev. Lett. 15, 429 (1965).
- (4) D. Casper et al., Phys. Rev. Lett. 66, 2561 (1991); R. Becker-Szendy et al., Phys. Rev. D46, 3720 (1992).
- (5) K. S. Hirata et al., Phys. Lett. B205, 416 (1988); K. S. Hirata et al., Phys. Lett. B280, 146 (1992).
- (6) M. Aglietta, et al., Europhys. Lett., ‘8(1989), 611.
- (7) C. Berger et al. [Frejus Collaboration], Phys. Lett. B 245, 305 (1990).
- (8) W. W. Allison et al. [Soudan-2 Collaboration], Phys. Lett. B 449, 137 (1999) [arXiv:hep-ex/9901024].
- (9) The best source of up-to-date information for this future experiment is its web page: http://www-numi.fnal.gov:8875/
-
(10)
Similarly, there are several web pages dedicated
to various parts of the proposals for a CERN to Gran Sasso
experiment. A stable, general, and well maintained one is: http://proj-cngs.web.cern.ch/proj-cngs/
which has details about the CERN site and links to pages about far detectors proposed. -
(11)
Two important experimental papers are:
S. Fukuda et al. [Super-Kamiokande Collaboration], Phys. Rev. Lett. 86, 5656 (2001);
Q. R. Ahmad et al. [SNO Collaboration], Phys. Rev. Lett. 87, 071301 (2001).
A lot of information on theory for solar neutrinos is available at: http://www.sns.ias.edu/~jnb/. - (12) A. Piepke [KamLAND Collaboration], “KamLAND: A reactor neutrino experiment testing the solar neutrino anomaly,” Nucl. Phys. Proc. Suppl. 91, 99 (2001).
- (13) H. G. Berns and R. J. Wilkes, IEEE Nucl. Sci. 47, 340 (2000)
- (14) H.Noumi et al., Nucl. Instr. and Meth. A398, 399 (1997).
- (15) M.Ieiri et al., Proc. 1st Asian Particle Accelerator Conference (1998).
-
(16)
H. Sato,
Proc. Particle Accelerator Conference (1999);
K. Takayama, ICFA Beam Dynamics Newsletter No.20, (1999). - (17) A. Suzuki et al. [K2K Collaboration], Nucl. Instrum. Meth. A 453, 165 (2000) [arXiv:hep-ex/0004024].
- (18) T. Ishii et al. [K2K MRD GROUP Collaboration], arXiv:hep-ex/0107041.
- (19) For a review of this topic, there is a section detailing the studies in the UNO “white paper” distributed at the Snowmass,’01 conference, “ Physics Potential and Feasibility of UNO,” preprint #:SBHEP01-3. The full report is available on the web at: http://superk.physics.sunysb.edu/uno/.