HyperCP Collaboration

Observation of the Decay Kβˆ’β†’Ο€βˆ’β€‹ΞΌ+β€‹ΞΌβˆ’β†’superscript𝐾superscriptπœ‹superscriptπœ‡superscriptπœ‡K^{-}\rightarrow\pi^{-}\mu^{+}\mu^{-} and Measurements of the Branching Ratios for K±→π±​μ+β€‹ΞΌβˆ’β†’superscript𝐾plus-or-minussuperscriptπœ‹plus-or-minussuperscriptπœ‡superscriptπœ‡K^{\pm}\rightarrow\pi^{\pm}\mu^{+}\mu^{-}

H.K.Β Park University of Michigan, Ann Arbor, Michigan 48109    R.A.Β Burnstein Illinois Institute of Technology, Chicago, Illinois 60616    A.Β Chakravorty Illinois Institute of Technology, Chicago, Illinois 60616    A.Β Chan Institute of Physics, Academia Sinica, Taipei 11529, Taiwan, Republic of China    Y.C.Β Chen Institute of Physics, Academia Sinica, Taipei 11529, Taiwan, Republic of China    W.S.Β Choong University of California, Berkeley, California 94720 Lawrence Berkeley National Laboratory, Berkeley, California 94720    K.Β Clark University of South Alabama, Mobile, Alabama 36688    E.C.Β Dukes University of Virginia, Charlottesville, Virginia 22904    C.Β Durandet University of Virginia, Charlottesville, Virginia 22904    J.Β Felix University of Guanajuato, 37000 Leon, Mexico    G.Β Gidal Lawrence Berkeley National Laboratory, Berkeley, California 94720    P.Β Gu Lawrence Berkeley National Laboratory, Berkeley, California 94720    H.R.Β Gustafson University of Michigan, Ann Arbor, Michigan 48109    C.Β Ho Institute of Physics, Academia Sinica, Taipei 11529, Taiwan, Republic of China    T.Β Holmstrom University of Virginia, Charlottesville, Virginia 22904    M.Β Huang University of Virginia, Charlottesville, Virginia 22904    C.Β James Fermi National Accelerator Laboratory, Batavia, Illinois 60510    C.M.Β Jenkins University of South Alabama, Mobile, Alabama 36688    D.M.Β Kaplan Illinois Institute of Technology, Chicago, Illinois 60616    L.M.Β Lederman Illinois Institute of Technology, Chicago, Illinois 60616    N.Β Leros University of Lausanne, CH-1015 Lausanne, Switzerland    M.J.Β Longo University of Michigan, Ann Arbor, Michigan 48109    F.Β Lopez University of Michigan, Ann Arbor, Michigan 48109    L.Β Lu University of Virginia, Charlottesville, Virginia 22904    W.Β Luebke Illinois Institute of Technology, Chicago, Illinois 60616    K.B.Β Luk University of California, Berkeley, California 94720    K.S.Β Nelson University of Virginia, Charlottesville, Virginia 22904    J.P.Β Perroud University of Lausanne, CH-1015 Lausanne, Switzerland    D.Β Rajaram Illinois Institute of Technology, Chicago, Illinois 60616    H.A.Β Rubin Illinois Institute of Technology, Chicago, Illinois 60616    P.K.Β Teng Institute of Physics, Academia Sinica, Taipei 11529, Taiwan, Republic of China    J.Β Volk Fermi National Accelerator Laboratory, Batavia, Illinois 60510    C.Β White Illinois Institute of Technology, Chicago, Illinois 60616    S.Β White Illinois Institute of Technology, Chicago, Illinois 60616    P.Β Zyla Lawrence Berkeley National Laboratory, Berkeley, California 94720
Abstract

Using data collected with the HyperCP (E871) spectrometer during the 1997 fixed-target run at Fermilab, we report the first observation of the decay Kβˆ’β†’Ο€βˆ’β€‹ΞΌ+β€‹ΞΌβˆ’β†’superscript𝐾superscriptπœ‹superscriptπœ‡superscriptπœ‡K^{-}\rightarrow\pi^{-}\mu^{+}\mu^{-} and new measurements of the branching ratios for K±→π±​μ+β€‹ΞΌβˆ’β†’superscript𝐾plus-or-minussuperscriptπœ‹plus-or-minussuperscriptπœ‡superscriptπœ‡K^{\pm}\rightarrow\pi^{\pm}\mu^{+}\mu^{-}. By combining the branching ratios for the decays K+β†’Ο€+​μ+β€‹ΞΌβˆ’β†’superscript𝐾superscriptπœ‹superscriptπœ‡superscriptπœ‡K^{+}\rightarrow\pi^{+}\mu^{+}\mu^{-} and Kβˆ’β†’Ο€βˆ’β€‹ΞΌ+β€‹ΞΌβˆ’β†’superscript𝐾superscriptπœ‹superscriptπœ‡superscriptπœ‡K^{-}\rightarrow\pi^{-}\mu^{+}\mu^{-}, we measure Γ​(K±→π±​μ+β€‹ΞΌβˆ’)/Γ​(KΒ±β†’a​l​l)=(9.8Β±1.0Β±0.5)Γ—10βˆ’8Ξ“β†’superscript𝐾plus-or-minussuperscriptπœ‹plus-or-minussuperscriptπœ‡superscriptπœ‡Ξ“β†’superscript𝐾plus-or-minusπ‘Žπ‘™π‘™plus-or-minus9.81.00.5superscript108\Gamma(K^{\pm}\rightarrow\pi^{\pm}\mu^{+}\mu^{-}){/}\Gamma(K^{\pm}\rightarrow all)=(9.8\pm 1.0\pm 0.5){\times}10^{-8}. The CP asymmetry between the rates of the two decay modes is [Γ​(K+β†’Ο€+​μ+β€‹ΞΌβˆ’)βˆ’Ξ“β€‹(Kβˆ’β†’Ο€βˆ’β€‹ΞΌ+β€‹ΞΌβˆ’)]/[Γ​(K+β†’Ο€+​μ+β€‹ΞΌβˆ’)+Γ​(Kβˆ’β†’Ο€βˆ’β€‹ΞΌ+β€‹ΞΌβˆ’)]=βˆ’0.02Β±0.11Β±0.04delimited-[]Ξ“β†’superscript𝐾superscriptπœ‹superscriptπœ‡superscriptπœ‡Ξ“β†’superscript𝐾superscriptπœ‹superscriptπœ‡superscriptπœ‡delimited-[]Ξ“β†’superscript𝐾superscriptπœ‹superscriptπœ‡superscriptπœ‡Ξ“β†’superscript𝐾superscriptπœ‹superscriptπœ‡superscriptπœ‡plus-or-minus0.020.110.04[\Gamma(K^{+}\rightarrow\pi^{+}\mu^{+}\mu^{-})-\Gamma(K^{-}\rightarrow\pi^{-}\mu^{+}\mu^{-})]/[\Gamma(K^{+}\rightarrow\pi^{+}\mu^{+}\mu^{-})+\Gamma(K^{-}\rightarrow\pi^{-}\mu^{+}\mu^{-})]=-0.02\pm 0.11\pm 0.04.

pacs:
13.20.Eb, 14.40.Aq, 11.30.Er

The rare decay of charged K𝐾K mesons to a pion and a lepton pair (Kπ​l​lΒ±subscriptsuperscript𝐾plus-or-minusπœ‹π‘™π‘™K^{\pm}_{\pi ll}, where l𝑙l = e𝑒e or ΞΌπœ‡\mu) can be used to study flavor-changing neutral currents as a higher-order process in the standard model and to explore new physics. However, to realize these goals, it is necessary to understand the dominant KΒ±β†’Ο€Β±β€‹Ξ³βˆ—β†’superscript𝐾plus-or-minussuperscriptπœ‹plus-or-minussuperscript𝛾K^{\pm}\rightarrow\pi^{\pm}\gamma^{*} radiative transition which involves long-distance hadronic effects. Since it is difficult to calculate such effects, chiral perturbation theory (ChPT) including electroweak interactions has been applied to Kπ​l​l+subscriptsuperscriptπΎπœ‹π‘™π‘™K^{+}_{\pi ll} [1]. In a recent model-independent analysis with ChPT at π’ͺπ’ͺ\mathcal{O}(p6)superscript𝑝6(p^{6}) [2], the Kπ​l​l+subscriptsuperscriptπΎπœ‹π‘™π‘™K^{+}_{\pi ll} decay rate and the form factor characterizing the dilepton invariant-mass spectrum are calculated in terms of two parameters a+subscriptπ‘Ža_{+} and b+subscript𝑏b_{+}. Determining these parameters from the measured branching ratio and the dilepton mass spectrum of the Kπ​e​e+subscriptsuperscriptπΎπœ‹π‘’π‘’K^{+}_{\pi ee} decay, this analysis predicts the ratio β„›β„›\mathcal{R} = B​(Kπ​μ​μ+)/B​(Kπ​e​e+)𝐡subscriptsuperscriptπΎπœ‹πœ‡πœ‡π΅subscriptsuperscriptπΎπœ‹π‘’π‘’B(K^{+}_{\pi\mu\mu})/B(K^{+}_{\pi ee}) to be greater than 0.23 and an increase in the CP asymmetry between the decay rates of Kπ​l​l+subscriptsuperscriptπΎπœ‹π‘™π‘™K^{+}_{\pi ll} and Kπ​l​lβˆ’subscriptsuperscriptπΎπœ‹π‘™π‘™K^{-}_{\pi ll} compared to the leading-order estimation in the chiral expansion [3]. The resulting expected CP asymmetry is ∼10βˆ’5similar-toabsentsuperscript105\sim{10^{-5}} [2, 3].

The Kπ​e​e+subscriptsuperscriptπΎπœ‹π‘’π‘’K^{+}_{\pi ee} decay has been studied by several experiments [4, 5, 6], and the Particle Data Group (PDG) has compiled a mean branching ratio B​(Kπ​e​e+)=(2.88Β±0.13)Γ—10βˆ’7𝐡subscriptsuperscriptπΎπœ‹π‘’π‘’plus-or-minus2.880.13superscript107B(K^{+}_{\pi ee})=(2.88\pm 0.13)\times 10^{-7} [7]. The Kπ​μ​μ+subscriptsuperscriptπΎπœ‹πœ‡πœ‡K^{+}_{\pi\mu\mu} decay was first observed by the E787 Collaboration at the Brookhaven National Laboratory (BNL). With 13 fully reconstructed 3-track and 196 partially reconstructed 2-track events, they determined B​(Kπ​μ​μ+)𝐡subscriptsuperscriptπΎπœ‹πœ‡πœ‡B(K^{+}_{\pi\mu\mu}) = [5.0 Β±plus-or-minus\pm 0.4(stat) Β±plus-or-minus\pm 0.7(syst) Β±plus-or-minus\pm 0.6(theor)] Γ—10βˆ’8absentsuperscript108\times 10^{-8} [8]. The E865 Collaboration at BNL has subsequently observed 430 fully reconstructed Kπ​μ​μ+subscriptsuperscriptπΎπœ‹πœ‡πœ‡K^{+}_{\pi\mu\mu} events and measured B​(Kπ​μ​μ+)𝐡subscriptsuperscriptπΎπœ‹πœ‡πœ‡B(K^{+}_{\pi\mu\mu}) = [9.22 Β±plus-or-minus\pm 0.60(stat) Β±plus-or-minus\pm 0.49(syst)] Γ—10βˆ’8absentsuperscript108\times 10^{-8} [9]. The discrepancy between these two experimental results is more than three standard deviations and is not understood. In addition the value of β„›β„›\mathcal{R} obtained with the E787 result and the average value of B​(Kπ​e​e+)𝐡subscriptsuperscriptπΎπœ‹π‘’π‘’B(K^{+}_{\pi ee}) is inconsistent with the prediction and is difficult to accommodate within the standard modelΒ [2]. It is thus important to resolve the discrepancy in the B​(Kπ​μ​μ+)𝐡subscriptsuperscriptπΎπœ‹πœ‡πœ‡B(K^{+}_{\pi\mu\mu}) measurements.

Refer to caption

Figure 1: Plan view of the HyperCP spectrometer. The length (width) of the spectrometer is about 62 m (4 m).

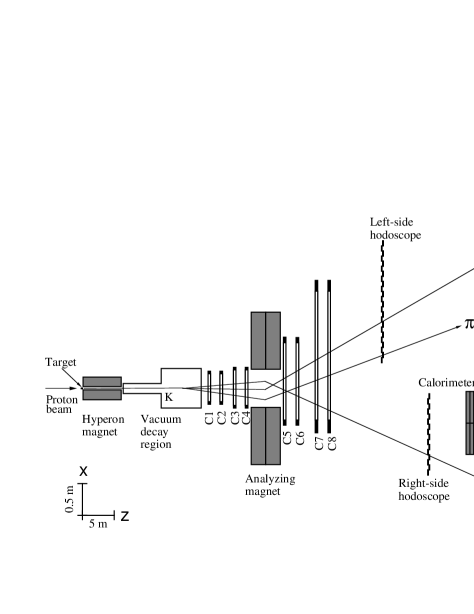
In this Letter we present results on the first observation of Kβˆ’β†’Ο€βˆ’β€‹ΞΌ+β€‹ΞΌβˆ’β†’superscript𝐾superscriptπœ‹superscriptπœ‡superscriptπœ‡K^{-}\rightarrow\pi^{-}\mu^{+}\mu^{-} decay, the branching ratios of Kπ​μ​μ±subscriptsuperscript𝐾plus-or-minusπœ‹πœ‡πœ‡K^{\pm}_{\pi\mu\mu} decays, and a limit on their CP asymmetry. The HyperCP (E871) experiment in the Meson Center beam line of Fermilab, which was designed primarily to study CP violation in Ξžβˆ’/Ξ¯superscriptΞ¯Ξ\Xi^{-}/\overline{\Xi}+ and ΛΛ\Lambda/Λ¯¯Λ\overline{\Lambda} decays, took data in 1997 and 1999. We report here on an analysis of the 1997 data. A plan view of the spectrometer is shown in Fig.Β 1; a detailed description is given elsewhere [10].

KΒ±superscript𝐾plus-or-minusK^{\pm}’s were produced by directing an 800-GeV/c𝑐c proton beam, with a typical intensity of 1.2Γ—10111.2superscript10111.2\times 10^{11} protons per 20-second spill, onto a 2-mm-square copper target. A target length of 22 (60)Β mm was used when taking positive (negative)-secondary-beam data. The secondary-beam momentum was selected by a curved collimator embedded in a 6-m-long dipole magnet (Hyperon magnet) with a horizontal magnetic field of 1.67Β T. The mean momentum of the secondaries was about 170Β GeV/c𝑐c, and the charge of the secondary beam was selected with the sign of the Hyperon magnet field. The typical secondary-beam rate was 13Β MHz at the exit of the collimator. Following a 13-m evacuated decay pipe were eight multiwire proportional chambers (C1–C8) with wire spacings increasing from 1 to 2Β mm. A dipole magnet (Analyzing magnet) deflected charged particles horizontally with a transverse-momentum kick of 1.43Β GeV/c𝑐c. Particles with the same charge as the secondary beam were deflected to the left and those with opposite charge to the right. At the rear of the spectrometer were two scintillation hodoscopes and a calorimeter, used for triggering, and a muon detector system. The muon system consisted of two similar detectors on either side of the secondary beam line. The muon detectors had three layers of 0.81-m-thick steel absorber, each layer followed by a tracking station consisting of vertical and horizontal planes of proportional tubes with a pitch of 25.4 mm. At the rear of the third layer, behind the proportional tubes, were two orthogonal scintillator hodoscopes used for the muon triggers.

The Kπ​μ​μ±subscriptsuperscript𝐾plus-or-minusπœ‹πœ‡πœ‡K^{\pm}_{\pi\mu\mu} rates were measured relative to the K±→π±​π+β€‹Ο€βˆ’β†’superscript𝐾plus-or-minussuperscriptπœ‹plus-or-minussuperscriptπœ‹superscriptπœ‹K^{\pm}\rightarrow\pi^{\pm}\pi^{+}\pi^{-} (Kπ​3Β±subscriptsuperscript𝐾plus-or-minusπœ‹3K^{\pm}_{{\pi}3}) rates (the normalization mode). The trigger for the Kπ​3Β±subscriptsuperscript𝐾plus-or-minusπœ‹3K^{\pm}_{\pi 3} events was a heavily-prescaled coincidence of at least one hit in each of the left- and right-side hodoscopes. The trigger for the Kπ​μ​μ±subscriptsuperscript𝐾plus-or-minusπœ‹πœ‡πœ‡K^{\pm}_{\pi\mu\mu} events, the unlike-sign dimuon trigger, required the presence of at least one hit in each hodoscope in the muon detectors in coincidence with hits in the left- and right-side hodoscopes. The sign of the secondary beam was changed every few hours by reversing the polarities of both the Hyperon and Analyzing magnets. The typical run cycle was two runs with positive secondary beam followed by one run with negative secondary beam.

Data for the Kπ​μ​μ±subscriptsuperscript𝐾plus-or-minusπœ‹πœ‡πœ‡K^{\pm}_{\pi\mu\mu} and Kπ​3Β±subscriptsuperscript𝐾plus-or-minusπœ‹3K^{\pm}_{{\pi}3} triggers were processed with the same reconstruction program. A three-track event topology was required. The sample of Kπ​μ​μ±subscriptsuperscript𝐾plus-or-minusπœ‹πœ‡πœ‡K^{\pm}_{\pi\mu\mu} candidates was selected by requiring a muon track in each muon station and an unlike-sign dimuon trigger. The muon track was required to have hits in at least two of three muon chambers in both xπ‘₯x and y𝑦y views with corresponding in-time hits in the muon hodoscope. The algorithm for muon selection was checked using muon calibration data. The momentum of accepted muons was greater than 20Β GeV/c𝑐c.

Similar selection criteria were applied to both the signal (Kπ​μ​μ±subscriptsuperscript𝐾plus-or-minusπœ‹πœ‡πœ‡K^{\pm}_{\pi\mu\mu}) and normalization (Kπ​3Β±subscriptsuperscript𝐾plus-or-minusπœ‹3K^{\pm}_{{\pi}3}) event samples. One right-side track and two left-side tracks were required. Two pions from the Kπ​3Β±subscriptsuperscript𝐾plus-or-minusπœ‹3K^{\pm}_{\pi 3} decays were required to project to the same fiducial areas in the left- and right-side muon hodoscopes as the muons from the Kπ​μ​μ±subscriptsuperscript𝐾plus-or-minusπœ‹πœ‡πœ‡K^{\pm}_{\pi\mu\mu} decays. The total momentum of the reconstructed tracks was required to lie between 120 and 250Β GeV/c𝑐c, consistent with the momentum spread of the secondary beam. To ensure that the kaons came from the target, the combined three-track momentum had to point back to within 5Β mm of the center of the target in both xπ‘₯x and y𝑦y. The decay vertex of the three tracks was calculated by the method of distance of closest approach using the front track segments, and was required to be well within the vacuum decay region.

The Kπ​μ​μ±subscriptsuperscript𝐾plus-or-minusπœ‹πœ‡πœ‡K^{\pm}_{\pi\mu\mu} and Kπ​3Β±subscriptsuperscript𝐾plus-or-minusπœ‹3K^{\pm}_{{\pi}3} event candidates were required to have a decay topology consistent with a single vertex. This was done by first fitting the three tracks to a single vertex using the wire hits in C1–C4 and computing the Ο‡2superscriptπœ’2\chi^{2} of the fit. In addition the average separation between the three pairs of tracks in the xβˆ’yπ‘₯𝑦x-y plane at the z𝑧z position of the vertex determined by distance of closest approach was measured. Clean Kπ​3Β±subscriptsuperscript𝐾plus-or-minusπœ‹3K^{\pm}_{{\pi}3} decays were used to study selection cuts based on the vertex-constrained-fit Ο‡2superscriptπœ’2\chi^{2} and the average separation distance. Candidates were accepted if Ο‡2/n​d​f<2.5superscriptπœ’2𝑛𝑑𝑓2.5\chi^{2}/ndf<2.5 and the average separation distance was less than 2Β mm. These vertex cuts provided strong rejection of backgrounds, in particular those from two-vertex hyperon decays.

Refer to caption

Refer to caption

Figure 2: The Ο€β€‹ΞΌβ€‹ΞΌπœ‹πœ‡πœ‡\pi\mu\mu invariant mass distributions for (a) positive- and (b) negative-secondary-beam data after cuts. The large peak comes from Kπ​3Β±subscriptsuperscript𝐾plus-or-minusπœ‹3K^{\pm}_{\pi 3} events with in-flight decays of pions and pion punch-through to the muon stations. The inset shows the region around the kaon mass in more detail; points are data and the solid lines show the results of the likelihood fits.

For events passing these cuts, the reconstructed three-track invariant mass Mπ​μ​μsubscriptπ‘€πœ‹πœ‡πœ‡M_{\pi\mu\mu} distributions with a Kπ​μ​μ±subscriptsuperscript𝐾plus-or-minusπœ‹πœ‡πœ‡K^{\pm}_{\pi\mu\mu} decay hypothesis are shown in Fig.Β 2. The signals in the vicinity of the kaon mass are clear and unambiguous.

To determine the branching ratios B​(Kπ​μ​μ±)=Γ​(K±→π±​μ+β€‹ΞΌβˆ’)/Γ​(KΒ±β†’a​l​l)𝐡subscriptsuperscript𝐾plus-or-minusπœ‹πœ‡πœ‡Ξ“β†’superscript𝐾plus-or-minussuperscriptπœ‹plus-or-minussuperscriptπœ‡superscriptπœ‡Ξ“β†’superscript𝐾plus-or-minusπ‘Žπ‘™π‘™B(K^{\pm}_{\pi\mu\mu})=\Gamma(K^{\pm}\rightarrow\pi^{\pm}\mu^{+}\mu^{-})/\Gamma(K^{\pm}\rightarrow all) the following formula was used:

B​(Kπ​μ​μ±)=NKπ​μ​μ±o​b​s200β‹…NKπ​3Β±o​b​s​AKπ​3Β±AKπ​μ​μ±​ϡKπ​3Β±Ο΅Kπ​μ​μ±​B​(Kπ​3Β±)ϡμ+β€‹ΞΌβˆ’β‹…Ο΅r​e​lt​r​i​g,𝐡subscriptsuperscript𝐾plus-or-minusπœ‹πœ‡πœ‡superscriptsubscript𝑁subscriptsuperscript𝐾plus-or-minusπœ‹πœ‡πœ‡π‘œπ‘π‘ β‹…200superscriptsubscript𝑁subscriptsuperscript𝐾plus-or-minusπœ‹3π‘œπ‘π‘ subscript𝐴subscriptsuperscript𝐾plus-or-minusπœ‹3subscript𝐴subscriptsuperscript𝐾plus-or-minusπœ‹πœ‡πœ‡subscriptitalic-Ο΅subscriptsuperscript𝐾plus-or-minusπœ‹3subscriptitalic-Ο΅subscriptsuperscript𝐾plus-or-minusπœ‹πœ‡πœ‡π΅subscriptsuperscript𝐾plus-or-minusπœ‹3β‹…subscriptitalic-Ο΅superscriptπœ‡superscriptπœ‡superscriptsubscriptitalic-Ο΅π‘Ÿπ‘’π‘™π‘‘π‘Ÿπ‘–π‘”\displaystyle B(K^{\pm}_{\pi\mu\mu})=\frac{N_{K^{\pm}_{\pi\mu\mu}}^{obs}}{200\cdot N_{K^{\pm}_{\pi 3}}^{obs}}\frac{A_{K^{\pm}_{\pi 3}}}{A_{K^{\pm}_{\pi\mu\mu}}}\frac{\epsilon_{K^{\pm}_{\pi 3}}}{\epsilon_{K^{\pm}_{\pi\mu\mu}}}\frac{B(K^{\pm}_{\pi 3})}{\epsilon_{\mu^{+}\mu^{-}}\cdot\epsilon_{rel}^{trig}}, (1)

where the Nio​b​ssubscriptsuperscriptπ‘π‘œπ‘π‘ π‘–N^{obs}_{i}’s are the numbers of observed events, the Aisubscript𝐴𝑖A_{i}’s are the geometrical acceptances, the Ο΅isubscriptitalic-ϡ𝑖\epsilon_{i}’s are the event-selection efficiencies, Ο΅r​e​lt​r​i​gsubscriptsuperscriptitalic-Ο΅π‘‘π‘Ÿπ‘–π‘”π‘Ÿπ‘’π‘™\epsilon^{trig}_{rel} is the relative trigger efficiency, and 200 is the prescale factor. The branching ratios B​(Kπ​3Β±)𝐡subscriptsuperscript𝐾plus-or-minusπœ‹3B(K^{\pm}_{\pi 3}) are (5.59Β±0.05)%percentplus-or-minus5.590.05(5.59\pm 0.05)\%Β [7]. Unbinned maximum-likelihood fits for the events in the region 470​M​e​V/c2<Mπ​μ​μ<520​M​e​V/c2470𝑀𝑒𝑉superscript𝑐2subscriptπ‘€πœ‹πœ‡πœ‡520𝑀𝑒𝑉superscript𝑐2470~{}MeV/c^{2}<M_{\pi\mu\mu}<520~{}MeV/c^{2} were used to estimate the numbers of Kπ​μ​μ±subscriptsuperscript𝐾plus-or-minusπœ‹πœ‡πœ‡K^{\pm}_{\pi\mu\mu} events, where the mass range for the fit was chosen to minimize the statistical error. Gaussian and linear functions were used to fit the signal and background respectively. The numbers of signal events from the fits were NKπ​μ​μ+o​b​s=65.3Β±8.2subscriptsuperscriptπ‘π‘œπ‘π‘ subscriptsuperscriptπΎπœ‹πœ‡πœ‡plus-or-minus65.38.2N^{obs}_{K^{+}_{\pi\mu\mu}}=65.3\pm{8.2} and NKΟ€β€‹ΞΌβ€‹ΞΌβˆ’o​b​s=35.2Β±6.6subscriptsuperscriptπ‘π‘œπ‘π‘ subscriptsuperscriptπΎπœ‹πœ‡πœ‡plus-or-minus35.26.6N^{obs}_{K^{-}_{\pi\mu\mu}}=35.2\pm{6.6}, where the errors are statistical. After background subtraction, the observed numbers of normalization events were NKπ​3+o​b​s=(4.446Β±0.010)Γ—105subscriptsuperscriptπ‘π‘œπ‘π‘ subscriptsuperscriptπΎπœ‹3plus-or-minus4.4460.010superscript105N^{obs}_{K^{+}_{\pi{3}}}=(4.446\pm 0.010){\times}10^{5} and NKπ​3βˆ’o​b​s=(2.318Β±0.008)Γ—105subscriptsuperscriptπ‘π‘œπ‘π‘ subscriptsuperscriptπΎπœ‹3plus-or-minus2.3180.008superscript105N^{obs}_{K^{-}_{\pi{3}}}=(2.318\pm 0.008){\times}10^{5}, where the errors are dominated by the background estimation.

Background contributions to the Kπ​μ​μ±subscriptsuperscript𝐾plus-or-minusπœ‹πœ‡πœ‡K^{\pm}_{\pi\mu\mu} samples from pion punch-through in the muon stations and in-flight decays of pions in Kπ​3Β±subscriptsuperscript𝐾plus-or-minusπœ‹3K^{\pm}_{{\pi}3} decays and from KΒ±β†’Ο€+β€‹Ο€βˆ’β€‹ΞΌΒ±β€‹Ξ½ΞΌβ†’superscript𝐾plus-or-minussuperscriptπœ‹superscriptπœ‹superscriptπœ‡plus-or-minussubscriptπœˆπœ‡K^{\pm}\rightarrow\pi^{+}\pi^{-}\mu^{\pm}\nu_{\mu} were negligible, mainly due to the good resolution of the spectrometer. Monte Carlo (MC) studies for these decays showed that the reconstructed masses with the Ο€β€‹ΞΌβ€‹ΞΌπœ‹πœ‡πœ‡\pi\mu\mu hypothesis of these modes were well below 480 MeV/c2superscript𝑐2c^{2}.

Many checks to verify the MC simulation were made. The kinematic parameters for KΒ±superscript𝐾plus-or-minusK^{\pm} production at the target were tuned separately for the Kπ​3+subscriptsuperscriptπΎπœ‹3K^{+}_{\pi 3} and Kπ​3βˆ’subscriptsuperscriptπΎπœ‹3K^{-}_{\pi 3} normalization samples. The PDG Dalitz parameters for Kπ​3Β±subscriptsuperscript𝐾plus-or-minusπœ‹3K^{\pm}_{\pi 3} decays [7] were used in the MC program to properly simulate this decay. The distributions for kaon momenta and vertex positions of Kπ​3Β±subscriptsuperscript𝐾plus-or-minusπœ‹3K^{\pm}_{{\pi}3} decays inside the decay pipe, hit positions of pions from the decays, and reconstructed masses were compared with data. They all showed good agreement.

In the simulation of Kπ​μ​μ±subscriptsuperscript𝐾plus-or-minusπœ‹πœ‡πœ‡K^{\pm}_{\pi\mu\mu} decays, we assumed a vector interaction, based on the results of previous experiments [6, 9], and so the angular distribution of ΞΌ+superscriptπœ‡\mu^{+} in the rest frame of the virtual photon was generated according to the expression (mΞΌ2+pΞΌ2​sin2⁑θ)superscriptsubscriptπ‘šπœ‡2superscriptsubscriptπ‘πœ‡2superscript2πœƒ(m_{\mu}^{2}+p_{\mu}^{2}\sin^{2}\theta), where mΞΌsubscriptπ‘šπœ‡m_{\mu} and pΞΌsubscriptπ‘πœ‡p_{\mu} are the mass and momentum of the muon, and ΞΈπœƒ\theta is the angle between the directions of the ΞΌ+superscriptπœ‡\mu^{+} and the pion in this frame. In addition, we employed a form factor as described below. The dilepton invariant mass (Ml​lsubscript𝑀𝑙𝑙M_{ll}) spectrum from the Kπ​l​lΒ±subscriptsuperscript𝐾plus-or-minusπœ‹π‘™π‘™K^{\pm}_{\pi ll} decays is described by the form factor ϕ​(Ml​l2)=Ο•0​(1+δ​Ml​l2/mK+2)italic-Ο•superscriptsubscript𝑀𝑙𝑙2subscriptitalic-Ο•01𝛿superscriptsubscript𝑀𝑙𝑙2superscriptsubscriptπ‘šsuperscript𝐾2\phi(M_{ll}^{2})=\phi_{0}(1+\delta M_{ll}^{2}/m_{K^{+}}^{2}) where δ𝛿\delta and Ο•0subscriptitalic-Ο•0\phi_{0} are a slope parameter and a constant, respectively, and mK+subscriptπ‘šsuperscript𝐾m_{K^{+}} is the mass of the charged kaon [5, 6]. To extract δ𝛿\delta, we averaged the measured values of the slope parameters determined by BNL E777 using Kπ​e​e+subscriptsuperscriptπΎπœ‹π‘’π‘’K^{+}_{\pi ee} decaysΒ [5] and by BNL E865 with Kπ​e​e+subscriptsuperscriptπΎπœ‹π‘’π‘’K^{+}_{\pi ee}Β [6] and Kπ​μ​μ+subscriptsuperscriptπΎπœ‹πœ‡πœ‡K^{+}_{\pi\mu\mu} eventsΒ [9]. We obtained Ξ΄=2.08Β±0.12𝛿plus-or-minus2.080.12\delta=2.08\pm 0.12, where the error is only statistical. FigureΒ 3 compares data for the dimuon invariant mass for Kπ​μ​μ±subscriptsuperscript𝐾plus-or-minusπœ‹πœ‡πœ‡K^{\pm}_{\pi\mu\mu} decays with simulation results for 3 values of δ𝛿\delta.

From the MC simulation the geometric acceptance for Kπ​3Β±subscriptsuperscript𝐾plus-or-minusπœ‹3K^{\pm}_{\pi 3} and Kπ​μ​μ±subscriptsuperscript𝐾plus-or-minusπœ‹πœ‡πœ‡K^{\pm}_{\pi\mu\mu} decays inside the vacuum decay region for positive (negative)-secondary-beam data were estimated to be 94.4% (94.2%) and 47.5% (47.7%), respectively, where we have taken into account pion decay in flight and pion punch-through to the muon stations. Analyses identical to those applied to the data were used for the simulated normalization and signal events that passed the trigger requirements. The event selection efficiencies for Kπ​3Β±subscriptsuperscript𝐾plus-or-minusπœ‹3K^{\pm}_{\pi 3} and Kπ​μ​μ±subscriptsuperscript𝐾plus-or-minusπœ‹πœ‡πœ‡K^{\pm}_{\pi\mu\mu} decays were 77.9% (76.0%) and 80.3% (78.3%) for positive (negative) secondary beam data respectively. The difference in efficiencies for K+superscript𝐾K^{+} and Kβˆ’superscript𝐾K^{-} events is primarily due to the slightly different momentum spectra for K+superscript𝐾K^{+} and Kβˆ’superscript𝐾K^{-} production. To estimate the trigger and dimuon selection efficiencies, the full data sample was used. Since the trigger for the normalization mode was common to that for the signal mode, we could determine the relative trigger efficiency for the signal mode with respect to the normalization mode. The relative trigger efficiency Ο΅r​e​lt​r​i​gsuperscriptsubscriptitalic-Ο΅π‘Ÿπ‘’π‘™π‘‘π‘Ÿπ‘–π‘”\epsilon_{rel}^{trig} was found to be (86.6Β±2.7)%percentplus-or-minus86.62.7(86.6\pm 2.7)\%. The dimuon selection efficiency ϡμ+β€‹ΞΌβˆ’subscriptitalic-Ο΅superscriptπœ‡superscriptπœ‡\epsilon_{\mu^{+}\mu^{-}} was (93.8Β±0.3)%percentplus-or-minus93.80.3(93.8\pm 0.3)\%.

Refer to caption

Figure 3: The ΞΌ+β€‹ΞΌβˆ’superscriptπœ‡superscriptπœ‡\mu^{+}\mu^{-} invariant mass after background subtraction for (a) positive- and (b) negative-secondary-beam data after cuts. Points are data. The solid, dashed and dotted lines represent the simulation result with Ξ΄=2.08𝛿2.08\delta=2.08, 1.721.721.72 and 2.442.442.44, respectively.

A summary of the systematic uncertainties is given in Table 1. Systematic uncertainties on the measured branching ratios were minimized by using the same cuts both for the signal and for the normalization modes, with the exception of the muon-identification cuts which were applied to the signal events only. The major systematic uncertainties were the background estimation for the signal events and the trigger efficiency. In order to estimate the uncertainties in the numbers of signal events, various mass ranges were used for the fits, and fits with constant and quadratic functions for the background were used. The variations of the beam position at the target and the magnetic field strength in the Hyperon and Analyzing magnets during the run were monitored. By varying the assumed beam position, magnetic fields, KΒ±superscript𝐾plus-or-minusK^{\pm} production parameters, and the decay parameters in the MC, we determined the sensitivity to these parameters of the relative acceptances and efficiencies for the signal and normalizing modes. Realistic ranges for these parameters were then used in computing the MC-dependent systematic uncertainties in Table 1. Finally, the effect of the uncertainty in the slope parameter δ𝛿\delta was estimated by varying it by three standard deviations (see Fig.Β 3), and found to be negligible.

Based on Eq. (1) we determined the branching ratios to be B​(Kπ​μ​μ+)=(9.7Β±1.2Β±0.4)Γ—10βˆ’8𝐡subscriptsuperscriptπΎπœ‹πœ‡πœ‡plus-or-minus9.71.20.4superscript108B(K^{+}_{\pi\mu\mu})=(9.7\pm 1.2\pm 0.4)\times 10^{-8} and B​(KΟ€β€‹ΞΌβ€‹ΞΌβˆ’)𝐡subscriptsuperscriptπΎπœ‹πœ‡πœ‡B(K^{-}_{\pi\mu\mu}) = (10.0Β±1.9Β±0.7)Γ—10βˆ’810.0\pm 1.9\pm 0.7)\times 10^{-8}, where the first and second errors are statistical and systematic respectively. In terms of the partial decay rates Γ​(Kπ​μ​μ±)Ξ“subscriptsuperscript𝐾plus-or-minusπœ‹πœ‡πœ‡\Gamma(K^{\pm}_{\pi\mu\mu}), the CP asymmetry in these modes is defined as

Δ​(Kπ​μ​μ±)Ξ”subscriptsuperscript𝐾plus-or-minusπœ‹πœ‡πœ‡\displaystyle\Delta(K^{\pm}_{\pi\mu\mu}) =\displaystyle= Γ​(Kπ​μ​μ+)βˆ’Ξ“β€‹(KΟ€β€‹ΞΌβ€‹ΞΌβˆ’)Γ​(Kπ​μ​μ+)+Γ​(KΟ€β€‹ΞΌβ€‹ΞΌβˆ’).Ξ“subscriptsuperscriptπΎπœ‹πœ‡πœ‡Ξ“subscriptsuperscriptπΎπœ‹πœ‡πœ‡Ξ“subscriptsuperscriptπΎπœ‹πœ‡πœ‡Ξ“subscriptsuperscriptπΎπœ‹πœ‡πœ‡\displaystyle\frac{\Gamma(K^{+}_{\pi\mu\mu})-\Gamma(K^{-}_{\pi\mu\mu})}{\Gamma(K^{+}_{\pi\mu\mu})+\Gamma(K^{-}_{\pi\mu\mu})}. (2)

From our measurements of B​(Kπ​μ​μ±)𝐡subscriptsuperscript𝐾plus-or-minusπœ‹πœ‡πœ‡B(K^{\pm}_{\pi\mu\mu}), we obtained Δ​(Kπ​μ​μ±)=βˆ’0.02Β±0.11​(stat)Β±0.04​(syst)Ξ”subscriptsuperscript𝐾plus-or-minusπœ‹πœ‡πœ‡plus-or-minus0.020.11stat0.04syst\Delta(K^{\pm}_{\pi\mu\mu})=-0.02\pm 0.11{\rm(stat)}\pm 0.04{\rm(syst)}.

In conclusion, we have observed both K+β†’Ο€+​μ+β€‹ΞΌβˆ’β†’superscript𝐾superscriptπœ‹superscriptπœ‡superscriptπœ‡K^{+}\rightarrow\pi^{+}\mu^{+}\mu^{-} and Kβˆ’β†’Ο€βˆ’β€‹ΞΌ+β€‹ΞΌβˆ’β†’superscript𝐾superscriptπœ‹superscriptπœ‡superscriptπœ‡K^{-}\rightarrow\pi^{-}\mu^{+}\mu^{-} decays and measured their branching ratios. This is the first observation of the Kβˆ’β†’Ο€βˆ’β€‹ΞΌ+β€‹ΞΌβˆ’β†’superscript𝐾superscriptπœ‹superscriptπœ‡superscriptπœ‡K^{-}\rightarrow\pi^{-}\mu^{+}\mu^{-} decay. The CP asymmetry parameter, Δ​(Kπ​μ​μ±)Ξ”subscriptsuperscript𝐾plus-or-minusπœ‹πœ‡πœ‡\Delta(K^{\pm}_{\pi\mu\mu}), has been extracted from these measurements. Our result is consistent with no CP violation. Assuming CP symmetry is valid, we can combine B​(Kπ​μ​μ+)𝐡subscriptsuperscriptπΎπœ‹πœ‡πœ‡B(K^{+}_{\pi\mu\mu}) and B​(KΟ€β€‹ΞΌβ€‹ΞΌβˆ’)𝐡subscriptsuperscriptπΎπœ‹πœ‡πœ‡B(K^{-}_{\pi\mu\mu}) to give a result of [9.8 Β±plus-or-minus\pm 1.0(stat) Β±plus-or-minus\pm 0.5(syst)]Γ—10βˆ’8absentsuperscript108\times 10^{-8}, which is 3.2 standard deviations higher than the BNL E787 measurement [8], but consistent with the BNL E865 result [9] and, using the PDG value for B​(Kπ​e​e+)𝐡subscriptsuperscriptπΎπœ‹π‘’π‘’B(K^{+}_{\pi ee}), is also consistent with the model-independent analysis for the β„›β„›\mathcal{R} valueΒ [2].

Source ΟƒB/Bsubscript𝜎𝐡𝐡\sigma_{B}/B (%percent\%) ΟƒB/B​(Kπ​μ​μ±)subscript𝜎𝐡𝐡subscriptsuperscript𝐾plus-or-minusπœ‹πœ‡πœ‡\sigma_{B}/B(K^{\pm}_{\pi\mu\mu}) (%percent\%)
Beam targeting 1.1 (0.9) 1.0
Magnetic field 0.5 (0.4) 0.5
Trigger efficiency 3.1 (3.1) 3.1
Muon identification 0.3 (0.3) 0.3
Background Estimation (Kπ​3Β±subscriptsuperscript𝐾plus-or-minusπœ‹3K^{\pm}_{\pi 3}) 0.2 (0.3) 0.2
Background Estimation (Kπ​μ​μ±subscriptsuperscript𝐾plus-or-minusπœ‹πœ‡πœ‡K^{\pm}_{\pi\mu\mu}) 2.4 (6.4) 3.6
Data and MC disagreement 0.4 (0.4) 0.4
Dalitz parameter 0.3 (0.3) 0.3
Slope parameter (δ𝛿\delta) 0.2 (0.3) 0.2
B​(K+β†’Ο€+​π+β€‹Ο€βˆ’)𝐡→superscript𝐾superscriptπœ‹superscriptπœ‹superscriptπœ‹B(K^{+}\rightarrow\pi^{+}\pi^{+}\pi^{-}) 0.9 (0.9) 0.9
Total 4.2 (7.3) 5.0
Table 1: Summary of estimated systematic uncertainties in the branching ratios of B​(Kπ​μ​μ+)𝐡subscriptsuperscriptπΎπœ‹πœ‡πœ‡B(K^{+}_{\pi\mu\mu}), and, in parentheses, B​(KΟ€β€‹ΞΌβ€‹ΞΌβˆ’)𝐡subscriptsuperscriptπΎπœ‹πœ‡πœ‡B(K^{-}_{\pi\mu\mu}). The last column gives the systematic errors for the combined branching ratio, B​(Kπ​μ​μ±)𝐡subscriptsuperscript𝐾plus-or-minusπœ‹πœ‡πœ‡B(K^{\pm}_{\pi\mu\mu}).
Acknowledgements.
The authors are indebted to the staffs of Fermilab and the participating institutions for their vital contributions. This work was supported by the U.S. Department of Energy and the National Science Council of Taiwan, R.O.C.

References

  • [1] G. Ecker, A. Pich and E. de Rafael, Nucl. Phys. B 291, 692 (1987).
  • [2] G. D’Ambrosio, G. Ecker, G. Isidori and J. PortolΓ©s, JHEP 8, 4 (1998).
  • [3] G. Ecker, A. Pich and E. de Rafael, Nucl. Phys. B 303, 665 (1988).
  • [4] P. Bloch et al., Phys. Lett. B 56, 201 (1975).
  • [5] C. Alliegro et al., Phys. Rev. Lett. 68, 278 (1992).
  • [6] R. Appel et al., Phys. Rev. Lett. 83, 4482 (1999).
  • [7] Particle Data Group, D.E. Groom et al., Eur. Phys. J. C 15, 1 (2000).
  • [8] S. Adler et al., Phys. Rev. Lett. 79, 4756 (1997).
  • [9] H. Ma et al., Phys. Rev. Lett. 84, 2580 (2000).
  • [10] Y.C. Chen et al., Nucl. Instrum. Methods A455, 424 (2000); W.S. Choong, Ph.D. thesis, University of California, Berkeley (2000).