DFUB 2001-09
Bologna,
ATMOSPHERIC NEUTRINO OSCILLATIONS IN MACRO
GIORGIO GIACOMELLI and MIRIAM GIORGINI
for the MACRO Collaboration111For the full list of the Collaboration see the last paper of ref. [9]
Dept. of Physics, University of Bologna,
V.le C. Berti Pichat 6/2
Bologna, I-40127, Italy
E-mail: giorgio.giacomelli@bo.infn.it , miriam.giorgini@bo.infn.it
Invited paper at NO-VE, Int. Workshop on Neutrino Oscillations in Venice,
Venice, Italy, 24-26 July 2001.
Abstract
In this paper we first give a short overview of the MACRO detector which was operational at the Gran Sasso Laboratory from 1989 till the end of 2000. Then we present and discuss the results on atmospheric muon neutrino oscillations, concerning medium ( GeV) and high ( GeV) energy data. Using the Multiple Coulomb Scattering of muons inside the lower part of the detector, estimates of neutrino energies were made for the high energy sample. The data on angular distributions, absolute flux and distributions favour oscillations with maximal mixing and eV2.
1 Introduction
MACRO was a large multipurpose underground detector designed primarely to search for rare particles in the penetrating cosmic radiation. Though it was optimized to search for the supermassive magnetic monopoles predicted by Grand Unified Theories (GUT) of the electroweak and strong interactions, the MACRO research program included a wide range of topics in areas of astrophysics, nuclear and particle physics and cosmic ray physics. In particular it planned to study atmospheric neutrinos via the detection of upgoing muons produced in charge current (CC) interactions of in the rock below the detector and inside its lower part.
A high energy primary cosmic ray, proton or nucleus, interacts in the upper atmosphere producing a large number of pions and kaons, which decay yielding muons and muon neutrinos; also the muons decay yielding muon and electron neutrinos, Fig: 1. The ratio of the numbers of muon to electron neutrinos is about 2, and . These neutrinos are produced in a spherical surface at about 20 km above ground and they proceed at high speed towards the Earth. An underground detector is “illuminated” by a flux of neutrinos from all directions.
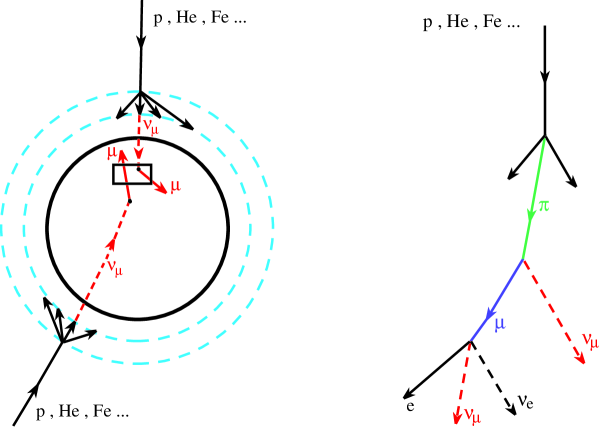
(a) (b)
At low energies, GeV, the numbers of atmospheric neutrinos predicted by different authors differ by about [1]; at higher energies, GeV, the predictions are more reliable, with an estimated systematic uncertainty of about [2], almost one half of the uncertainty at low energies. However the predicted relative rates of to and the shapes of the zenith angle distributions are affected by considerably lower systematic errors. Other sources of systematic uncertainties arise from the knowledge of the neutrino-nucleon cross sections and from the propagation of muons and electrons in different materials.
Several large underground detectors studied atmospheric neutrinos, mainly via charged current interactions, where a gives rise to a , and thus to a track, and a yields an and thus to an electromagnetic shower.
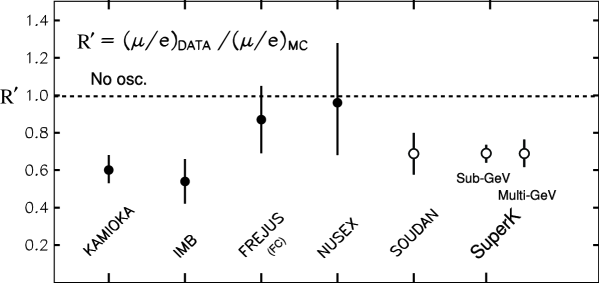
The early water Cherenkov detectors IMB [3] and Kamiokande [4] reported anomalies in the double ratio of muon to electron neutrinos integrated over all zenith angles, while the tracking calorimeters NUSEX [5] and Frejus [6], and the Baksan [7] scintillator detector did not find any deviation, see Fig: 2.
Later the Soudan 2 [8], MACRO [9] and SuperKamiokande [10] detectors reported a deficit in the flux with respect to the MC predictions and a distortion of the angular distributions, while the flux and angular distributions agree with MC. These features may be explained in terms of oscillations.
Atmospheric neutrinos are well suited for the study of neutrino oscillations, since they have energies from a fraction of a GeV up to more than 100 GeV and they may travel distances from few tens of km up to 13000 km; thus the values range from km/GeV to more than km/GeV.
In the following, we shall briefly recall neutrino oscillation formulae and the main features of the MACRO detector, then we shall discuss the main results of MACRO, including the ratio of vertical to horizontal muons which favour oscillations and the estimates of neutrino energies by multiple coulomb scattering of muons, which allows the study of the distribution. We shall conclude with a short discussion and by recalling briefly other neutrino studies by MACRO.
2 Neutrino oscillations
If neutrinos have non-zero masses, one has to consider the neutrino weak flavour eigenstates and the mass eigenstates . The weak flavour eigenstates are linear combinations of the mass eigenstates through the elements of the mixing matrix :
| (1) |
If the mixing angles are small, one would have , , . If the mixing angles are large, the flavour eigenstates are well separated from those of mass.
In the simple case of only two flavour eigenstate neutrinos which oscillate with two neutrino mass eigenstates one has
| (2) |
where is the mixing angle. In this case one may easily compute the following expression for the survival probability of a beam (disappearance experiment):
| (3) |
where , and is the distance travelled by the neutrino from production to the detection point. The probability for the initial to oscillate into a is (appearance experiment):
| (4) |
In a disappearance experiment one measures only as a function of and , or of . Only disappearance experiments have been performed until now. For atmospheric neutrinos the parameters and may be determined from the variation of as a function of the zenith angle , or from the variation in . In future appearance experiments, one would try to observe a neutrino, for example , not produced in decays.
3 The MACRO experiment
The MACRO detector was located in Hall B of the Gran Sasso Laboratory, under a minimum rock overburden of 3150 hg/cm2 which reduces the atmospheric muon flux by a factor . It was a large rectangular box, 76.6m12m9.3m, divided longitudinally in six supermodules and vertically in a lower part (4.8 m high) and an upper part (4.5 m high) [11] (Fig: 3a). It had three types of detectors which gave redundance of informations: liquid scintillation counters, limited streamer tubes and nuclear track detectors. This last detector was used only for new particle searches.
For muon and for neutrino physics and astrophysics studies, the streamer tubes were used for muon tracking and the liquid scintillation counters for fast timing. The lower part of the detector was filled with trays of crushed rock absorbers alternating with streamer tube planes; the upper part was open and contained the electronics.

(a) (b)
There were 10 horizontal planes of streamer tubes in the bottom half of the detector, and 4 planes at the top, all with wire and 27∘ stereo strip readouts. Six vertical planes of streamer tubes and one layer of scintillators covered each side of the detector. The scintillator system consisted of three layers of horizontal counters, and of the mentioned vertical layer along the sides of the detector. One thus had a closed box structure with openings only in the upper part of the front and back ends.
The time and space resolutions for muons in a scintillation counter were about 500 ps and 11 cm, respectively, while in the streamer tube system they were about 100 ns and 1 cm, respectively. The combination of the informations from the streamer tubes and from the scintillators allowed tracking with a precision of 1 cm over path lengths of several meters, and timing with a precision of 500 ps. The detector provided a total acceptance m2 sr for an isotropic flux of particles.
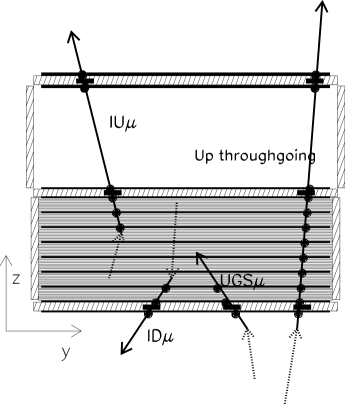
Fig: 3a is a vertical section of the detector; it shows a general view of the detector and gives also a sketch of the different topologies of detected neutrino-induced muon events used to study neutrino oscillations: Upthroughgoing muons, Internal Upgoing muons (IU), Upgoing Stopping muons (UGS) and Internal Downgoing muons (ID). Fig: 3b shows the parent neutrino energy distributions obtained from Monte Carlo calculations for the event topologies detectable in MACRO.

The Upthroughgoing muons (with GeV) come from interactions in the rock below the detector of muon neutrinos with an average energy GeV. The tracking is performed with streamer tubes hits; the time information, provided by scintillation counters, allows the determination of the direction (versus) by the time-of-flight (T.o.F.) method. If the atmospheric neutrino anomalies are due to neutrino oscillations, one expects a muon flux reduction depending on the zenith angle.
The semicontained upgoing muons (IU) come from interactions inside the lower apparatus. Since two scintillation counters are intercepted, the T.o.F. method is applied to identify the upward going muons. The average parent neutrino energy for these events is GeV. If the atmospheric neutrino anomalies are the results of oscillations with maximal mixing and eV2, one expects a reduction of about a factor of two in the flux of IU events, without any distortion in the shape of the angular distribution.
The up stopping muons (UGS) are due to interactions in the rock below the detector yielding upgoing muon tracks stopping in the detector; the semicontained downgoing muons (ID) are due to induced downgoing tracks with vertex in the lower MACRO. The events are found by means of topological criteria; the lack of time information prevents to distinguish between the two subsamples. An almost equal number of UGS and ID events is expected. In case of oscillations, a similar reduction in the flux of the up stopping events and of the semicontained upgoing muons is expected; no reduction is instead expected for the semicontained downgoing events (which come from neutrinos which travelled km).
4 High energy events
The data were collected during the running period from March 1989 to April 1994 with the detector under construction and during the runs with the complete detector from 1994 until December 2000 (livetime 5.52 yrs). Since the total livetime normalized to the full configuration is 6.16 yrs, the statistics is largely dominated by the full detector run. The analysis of a data sample of more than 40 million atmospheric downgoing muons achieved a rejection factor of which includes background caused by showering events and radioactivity in coincidence with muons.
We studied many sources of possible background: (i) low energy upgoing particles (mainly pions) induced by undetected downgoing muons in the rock surrounding the detector [12]. This source of background is reduced to 1% requiring that more than 200 gr/cm2 of material be crossed in the lower part of MACRO; (ii) we excluded a region in the azimuthal angle from to for nearly horizontal upgoing muons due to insufficient rock overburden; (iii) for muons crossing 3 scintillation counters a linear fit of the times as a function of the path length is performed and a cut is applied on the ; (iv) further minor cuts are applied to events crossing 2 counters.
(a) (b)
Muons traveling downwards have , upwardgoing muons have . The distribution for the sample collected with the full detector is shown in Fig: 4. We selected upwardgoing muons requiring ; we found 863 events, of which 809 events remain after subtracting the background.
In the upgoing muon simulation the neutrino flux computed by the Bartol group [13] was used. The cross sections for the neutrino interactions was calculated using the deep inelastic parton distributions [14]. The muon propagation to the detector was computed using the energy loss calculation in standard rock [15].
The systematic uncertainty arising from the neutrino flux, cross section and muon propagation on the expected flux of upthroughgoing muons was estimated to be 17%. This systematic uncertainty is mainly a scale error that doesn’t affect the shape of the angular distribution. The same cuts applied to the data were used for the simulated events: they selected 1122 MC events, assuming no oscillations.
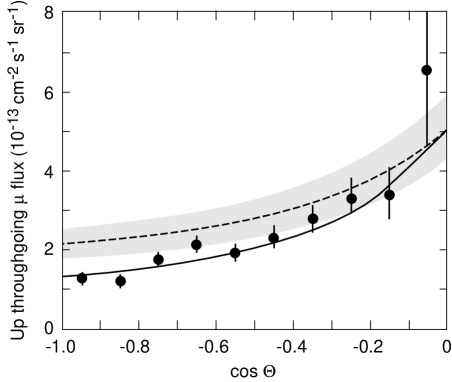
Fig: 5a shows the zenith angle ) distribution of the measured flux of upthroughgoing muons of energy GeV (black points); the MC expectation for no oscillations is indicated by the dashed line with the shaded scale error band. A deficit of events in the region around the vertical can be noticed. The ratio of the observed number of events to the expectation without oscillations in ( is the zenith angle) is .
We tested the shape of the angular distribution with the hypothesis of no oscillations normalizing the prediction to the data. The corresponds to a probability of 0.2%. In the hypothesis of only oscillations, the minimum in the physical region is 9.7/9 (%) for maximal mixing and eV2. An independent test was made on the number of the events.
Combining the probabilities from the two independent tests on the zenith angle shape of the flux and on the total number of events, the maximal probability is 66% for maximum mixing and eV2. The result of the fit is the solid line in Fig: 5a.
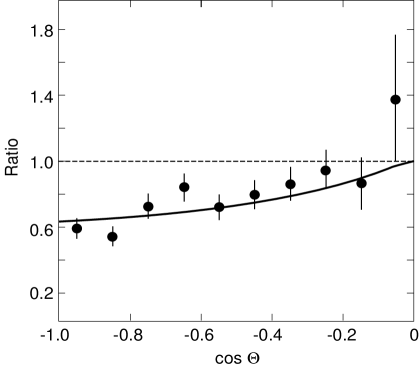
For each bin of Fig: 5a we computed the ratio (measured muon flux)/(expected muon flux in the non oscillation hypothesis). The result is shown in Fig: 5b (black points). The solid line is the ratio for maximal mixing and eV2; the dashed line is the same ratio expected for no oscillations.
The MACRO upthroughgoing muons are very sensitive to oscillations because of the energy range covered. The MACRO 90% C.L. allowed region in the plane, computed using the Feldman-Cousins method [16], is smaller than the SuperKamiokande (SK) one for upthroughgoing muons due to the different energy thresholds ( GeV for MACRO and GeV for SK) and for the median energies ( GeV for MACRO, GeV for SK).
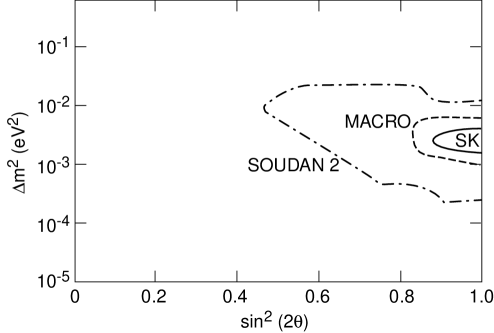
The MACRO 90% C.L. allowed region for oscillations is compared in Fig: 6 with those obtained by the SK and Soudan 2 experiments.
5 Matter effects. against
Matter effects due to the difference between the weak interaction effective potential for muon neutrinos with respect to sterile neutrinos (which have null potential) would produce a different total number and a different zenith distribution of upgoing muons.
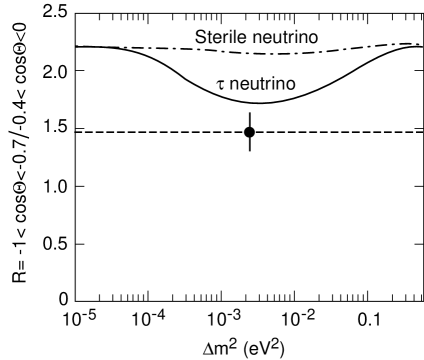
In Fig: 7 the measured ratio between the events with and the events with is shown by the black point. In this ratio most of the theoretical uncertainties on neutrino flux and cross sections cancel. The remaining theoretical error, estimated at %, has a 3% contribution due to uncertainties on the kaon/pion fraction produced in atmospheric showers, a 2% contribution from uncertainties in the cross sections of almost vertical and almost horizontal events and a 2.5% contribution from the seasonal variations of the ratio. The systematic experimental error on the ratio, due to analysis cuts and detector efficiencies, is 4.6%. Combining the experimental and theoretical errors in quadrature, a global extimate of 7% is obtained. MACRO measured 305 events with and 206 with ; the ratio is . For eV2 and maximal mixing, the minimum expected value of the ratio for oscillations is ; for oscillations one expects . The maximum probabilities to find a value of and of smaller than are 9.4% and 0.06% respectively. Hence the ratio of the maximum probabilities is , so that oscillations (with any mixing) are excluded at 99% C.L. compared to the channel with maximal mixing and eV2.
6 Low energy events
The data concern only the running period with the detector in the full configuration from April 1994 to December 2000. During this period more than 40 million downgoing muons were collected. Because of the difference between the topologies of the low energy events, two separate analyses were performed.
The IU sample corresponds to an effective livetime of 5.8 yrs. The basic request is the presence of a streamer tube track reconstructed in space matching at least two hits in two different scintillators in the upper part of the apparatus. The measured muon velocity was evaluated with the sign convention that upgoing (downgoing) muons have . After background subtraction, we had 154 upgoing partially contained events.
The identification of ID+UGS events was based on topological criteria. The candidates had a track starting (ending) in the lower apparatus and crossing the bottom detector face. The track has also to be located or oriented in such a way that it could not have entered (exited) undetected through insensitive regions of the apparatus. For this analysis the effective livetime was 5.6 yrs. After background subtraction, we had 262 ID+UGS events.
The MC simulations for the low energy data use the Bartol neutrino flux [13] and the low energy neutrino cross sections [17]. We estimated a total theoretical scale uncertainty on the predicted number of muons of the order of 25% (it is very probably overestimated).
| Events | MC | (Data/MC | |
|---|---|---|---|
| Upthroughgoing | 809 | ||
| IU | 154 | ||
| ID+UGS | 262 |
With the full MC simulation, the prediction for IU events was , while the observed number of events was . The ratio was (Data/MC). For this sample, the average value of is 3.2, in good agreement with the hypothesis of neutrino oscillations.
The prediction for ID+UGS events was , while the observed number of events was . The ratio was (Data/MC).
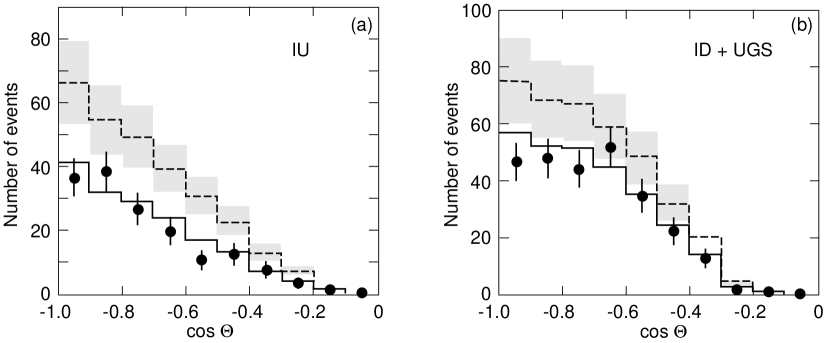
The numbers of low energy events are compared with the predictions in Table: 1; the angular distributions are shown in Fig: 8. The data show a uniform deficit of the measured number of events over the whole angular distribution with respect to the predictions without oscillations. The two data sets are consistent with neutrino oscillations with the parameters found in the analysis of the high energy sample. Upgoing neutrinos which induce IU and UGS events, travelling thousands of kilometers, are reduced by 50%, while no reduction is expected for downgoing partially contained muons. As a rough prediction, we expect a rate reduced by 50% for IU and by 25% for ID+UGS.
The measured data are in good agreement with the predicted angular distributions based on oscillations with the parameters obtained from the upthroughgoing muon sample (full histogram in Fig: 8).
7 energy estimates by Multiple Coulomb Scattering of upthroughgoing muons
Since MACRO was not equipped with a magnet, the only way to experimentally estimate the muon energy is through Multiple Coulomb Scattering (MCS) of muons in the absorbers in the lower part of MACRO, see Fig: 3a. The r.m.s. of the projected displacement of a relativistic muon with momentum travelling for a distance can be written as:
| (5) |
where (GeV/c) is the muon momentum and is the amount of crossed material in units of radiation lengths. A muon crossing the whole apparatus on the vertical has (cm)/(GeV). The muon energy estimate can be performed up to a saturation point, occurring when is comparable with the detector space resolution.
Two analyses were performed.
The first analysis was made studying the deflection of upthroughgoing muons in MACRO with the streamer tubes in digital mode. Using MC methods to estimate the muon energy from its scattering angle, the data were divided into 3 subsamples with different average energies, in 2 samples in zenith angle and finally in 5 subsamples with different average values of . This method could reach a spatial resolution of cm. This analysis yielded an distribution quite compatible with neutrino oscillations with the parameters found in Section 4.
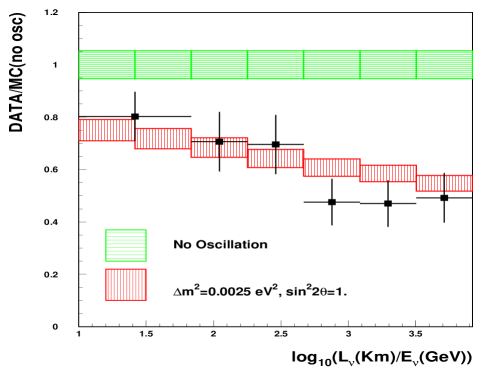
As the interesting energy region for atmospheric neutrino oscillations spans from GeV to some tens of GeV, it is important to improve the spatial resolution of the detector to push the saturation point as high as possible. For this purpose, a second analysis was performed using the streamer tubes in “drift mode” [18] using the TDC’s included in the QTP system, originally designed for the search for magnetic monopoles. To check the electronics and the feasibility of the analysis, two “test beams” were performed at the CERN PS-T9 and SPS-X7 beams. For each triggered tube, the arrival time of the signal multiplied by the drift velocity, measured at the test beam, gives the radius of the drift circle. The upthroughgoing muon tracks were reconstructed as the best fit of the drift circles referring to the triggered streamer tubes. The space resolution achieved is mm, a factor of 3.5 better than in the previous analysis. For each muon, 7 MCS sensitive variables were given in input to a Neural Network (NN) which was previously trained with MC events of known input energy crossing the detector at different zenith angles. The NN output allows to separate the whole sample of upthroughgoing muons in 4 subsamples with average energies of 12, 20, 50 and 102 GeV, respectively. The comparison of the zenith angle distributions of the 4 energy subsamples with the predictions of no oscillations MC shows a strong disagreement at low energies (where there is a deficit of vertical events), while the agreement is restored at higher neutrino energies. The corresponding probabilities for the no oscillation hypothesis in these energy windows are 1.8%, 16.8%, 26.9% and 87.7%, respectively.
The distribution of the ratios Data/MC obtained by the second method is plotted in Fig: 9 as a function of . The points with error bars are the data; the vertical extent of the shaded areas represents the global uncertainties on the MC predictions for oscillations with maximal mixing and eV2 and for no oscillations.
The 90% C.L. allowed region from this analysis seems to be consistent with the MACRO region plotted in Fig: 6.
8 Conclusions
We presented and discussed the MACRO results on atmospheric neutrinos. The measured and expected numbers of events are summarized in Table: 1. The observed zenith angle distributions and the numbers of neutrino-induced muons (Fig: 5 and Fig: 8) disagree with the predictions of the no oscillation hypothesis. The muon angular distribution and flux are in agreement with the hypothesis of two flavour oscillations, with maximal mixing and eV2. The hypothesis of oscillations is disfavoured at the 99% C.L. The MACRO 90% C.L. contours in the plane are compared in Fig. 6 with those obtained by the Soudan 2 and SuperKamiokande experiments: they overlap closely. The data from the three experiments strongly favour oscillations, though other possible interpretations have been suggested, see for example ref. [19].
Other MACRO results in the field of neutrino physics and astrophysics concern: (i) the search for cosmic point sources of high energy muon neutrinos: the flux upper limits for many sources, like Vela P, are at the level of cm-2 s-1 [20]; (ii) the search for dark matter WIMPs annihilating and yielding muon neutrinos from the earth core and from the Sun: the measured flux upper limits exclude ranges of parameters of supersymmetric models [21]; (iii) the search for low energy from stellar gravitational collapses: from 1989 till 2000 no type II supernovae exploded in our galaxy [22].
9 Acknowledgements
We acknowledge the cooperation of many members of the MACRO Collaboration, in particular of D. Bakari, G. Battistoni, Y. Becherini, P. Bernardini, T. Montaruli, F. Ronga, E. Scapparone, M. Sioli, M. Spurio, A. Surdo.
References
- [1] G. Barr et al., Phys. Rev. D39 (1989) 3532; M. Honda et al., Phys. Lett. B248 (1990) 193; H. Lee and Y.S. Koh, Nuovo Cimento 105B (1990) 883.
- [2] L.V. Volkova, Sov. J. Nucl. Phys. 31 (1980) 784; K. Mitsui et al., Nuovo Cimento 9C (1986) 995; A.V. Butkevich et al., Sov. J. Nucl. Phys. 50 (1989) 90.
- [3] IMB Coll., R. Becker-Szendy et al., Phys. Rev. D46 (1992) 3720.
- [4] Kamiokande Coll., Y. Fukuda et al., Phys. Lett. B335 (1994) 237.
- [5] NUSEX Coll., M. Aglietta et al., 23rd ICRC Proc., Calgary, Canada, Vol. 4 (1993) 446.
- [6] Frejus Coll., K. Daum et al., Z. Phys. C66 (1995) 417.
- [7] Baksan Coll., S. Mikheyev, 5th TAUP Workshop Proc., Gran Sasso, Italy, 1997.
- [8] Soudan 2 Coll., W.W.M. Allison et al., Phys. Lett. B391 (1997) 491; Phys. Lett. B449 (1999) 137; W. Anthony Mann, hep-ex/0007031.
- [9] MACRO Coll., S. Ahlen et al., Phys. Lett. B357(1995) 481. MACRO Coll., M. Ambrosio et al., Phys. Lett. B434 (1998) 451; Phys. Lett. B478 (2000) 5; Phys. Lett. B517 (2001) 59.
- [10] SuperKamiokande Coll., Y.Fukuda et al., Phys. Rev. Lett. 81 (1998) 1562; Phys. Lett. B433 (1998) 9; Phys. Rev. Lett. 85 (2000) 3999; Nucl Phys. B Proc. Suppl. 91 (2001) 127; T. Toshito, hep-ex/0105023 (2001).
- [11] MACRO Coll., M. Ambrosio et al., The MACRO detector at Gran Sasso, accepted for publication on Nucl. Instr. Meth. A.
- [12] MACRO Coll., M. Ambrosio et al., Astrop. Phys. 9 (1998) 123.
- [13] V. Agrawal et al., Phys. Rev. D53 (1996) 1314.
- [14] M. Gluck et al., Z. Phys. C67 (1995) 433.
- [15] W. Lohmann et al., Energy loss of muons in the energy range 1-GeV to 10000-GeV., CERN-EP/85-03 (1985).
- [16] G.J. Feldman and R.D. Cousins, Phys. Rev. D57 (1998) 3873.
- [17] P. Lipari et al., Phys. Rev. Lett. 74 (1995) 4384.
- [18] G. Battistoni et al., Neutrino induced upgoing muon energy estimation by multiple scattering with MACRO, Cosmic Radiations: From Astronomy to Particle Physics, NATO Science Series II, Vol. 42, p. 141 (2001).
- [19] V. Popa and M. Rujoiu, “Exotic” neutrino oscillations, Cosmic Radiations: From Astronomy to Particle Physics, NATO Science Series II, Vol. 42, p. 181 (2001).
- [20] MACRO Coll., M. Ambrosio et al., ApJ. 546 (2001) 1038.
- [21] MACRO Coll., M. Ambrosio et al., Phys. Rev. D60 (1999) 082002.
- [22] MACRO Coll., M. Ambrosio et al., Astrop. Phys. 8 (1998) 123.