| NuMI-B-781 |
Neutrino Spectrum at the Far Detector
Systematic Errors
Version 2.2
M. Szleper, Northwestern University
A. Para, Fermilab
Neutrino oscillation experiments often employ two identical detectors to minimize errors due to inadequately known neutrino beam. We examine various systematics effects related to the prediction of the neutrino spectrum in the ‘far’ detector on the basis of the spectrum observed at the ‘near’ detector. We propose a novel method of the derivation of the far detector spectrum. This method is less sensitive to the details of the understanding of the neutrino beam line and the hadron production spectra than the usually used ‘double ratio’ method thus allowing to reduce the systematic errors.
1 Introduction
Neutrino oscillations experiments can be divided into two classes:
-
•
disappearance experiments
In these experiments one measures a deficit of the observed rate of neutrino interactions with respect to the rate expected from the knowledge of the neutrino beam.
-
•
appearance experiments
In these experiments one detects interactions of the neutrino flavor not present in the neutrino beam at its source
A positive result of an appearance experiment constitutes an undisputable proof of the existence of the neutrino oscillations and it is fairly independent of the detailed understanding of the neutrino beam. This is often contrasted with the disappearance experiments, where the uncertainty of the neutrino flux at the position of the detector usually dominates the systematic error.
Further steps of the determination of the oscillation parameters involve a quantitative estimate of the rate of appearance or disappearance and their dependence on the neutrino energy. At this stage the understanding of the neutrino flux at the position of the detector constitutes a major source of the systematic error.
Absolute prediction of the neutrino fluxes is difficult, as the saga of measuring of the total cross sections teaches us. Modern tools of detailed simulations make the predictions somewhat more reliable, but accuracy of these predictions is limited by the scarcity of the data constraining the shower simulation code.
A powerful method of improving the knowledge of the neutrino flux at the position of the detector consists using two detectors in the same beam line:
-
•
a ‘near’ detector positioned near the neutrino source to establish the beam characteristics and to enable a reliable prediction of the neutrino flux at the ’far’ detector
-
•
a ‘far’ detector positioned at the distance where oscillation effects are expected to be present.
This technique was pioneered by the CCFR[1] collaboration at Fermilab and then subsequently used by CDHSW[2] and CHARM[3] experiments at CERN. Recently the two detector approach was employed by the K2K[4] experiment in Japan.
High statistics of the neutrino interactions expected at MINOS offer a potential for precise determination of the oscillations parameters. This, in turn, requires a very good understanding of the neutrino flux.
This note describes contributions to the systematic errors of the neutrino flux prediction and proposes a novel method of predicting the neutrino flux with reduced sensitivity to various systematic effects.
2 Neutrino Beam
Neutrino beam is produced in three steps:
-
•
pions and kaons are produced in the target
-
•
(optional, but necessary to attain high beam intensities) produced particles are focused directed towards the detector
-
•
pions and kaons decay inside the decay volume producing neutrinos
We examine these steps at some level of details to indicate the possible sources of systematic errors of the neutrino flux predictions.
2.1 Particle production in the target
Primary protons strike the target and produce pions and kaons. For low energy beams and long baseline experiments (hence neutrinos produced at small angles) pions produce the main contribution to the neutrino flux.
Production spectra of pions produced by protons are known rather poorly. Surprisingly large uncertainties exist in the knowledge of the inclusive cross sections, , even for the elementary reaction. Situation is further complicated by the fact that the neutrino beams utilize extended targets, where the absorption and re-interaction of the particles produced in the first interaction play a significant role.
Uncertainty in the production spectra is a direct consequence of a scarcity of the relevant experimental data. The primary source of the experimental information is the measurement of the particles yields in collisions at 400 and 450 GeV/c performed at CERN as a tool for understanding the CERN NBB and WBB neutrino beams[5, 6, 7]. Extrapolation to different target materials is guided by the measurement of Barton et al.[8]
There are two approaches to predictions of the particle fluxes for the neutrino beam:
-
•
use the existing data to constrain and tune complete shower simulation codes.
-
•
parameterize the existing data with an ad-hoc analytical formula and use it as a particles source function. Some physics-driven scaling laws must be employed to enable extrapolation of the data to different targets, proton energies and phase space regions of the produced particles.
This approach is represented by Malensek[11] and BMPT[12] ‘models’. The BMPT parameterization covers a complete phase space of the produced particles. It is based on much more complete data set and it is developed for predictions of neutrino beam produced by different energy protons. Malensek formula is an interpolation of the Atherton[5] data derived for a specific case of the Fermilab NBB. Use of this formula outside the region covered by the data points used is ill justified. We use it here, anyway, as an example of rather extreme variation of the production spectra.
The primary difference between various production models is the absolute flux predictions. A typical range of the variation is of the order of . Whereas this is an important practical factor, it is not important for the prediction of the shape of the spectrum observed at the far detector.
A potential source of the systematic error on the shape of the far detector spectrum is related to the shape of the distribution of the produced particles. The shape of the determines the angular divergence of the hadron beam after the focusing elements and consequently the distribution of the decay points of pions along the decay volume.
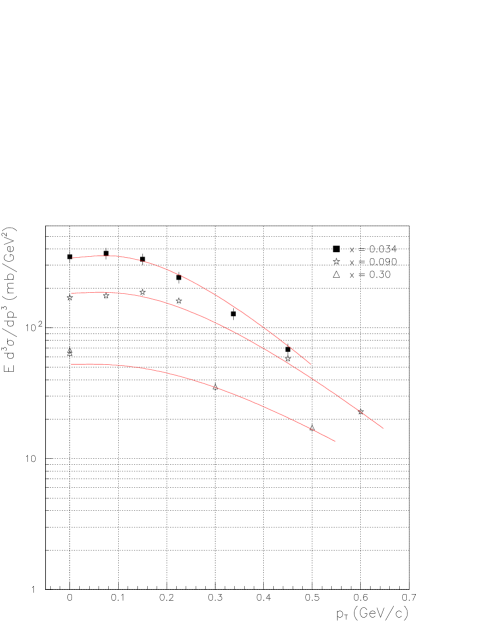
Figs.1 and 2 compare the shape of the spectra predicted by the BMPT and MARS models [13]. They show that a considerable uncertainty exists in the shape: physics-inspired general models tend to have an exponential fall-off with , whereas the experimental parameterization follows the experimental data better.
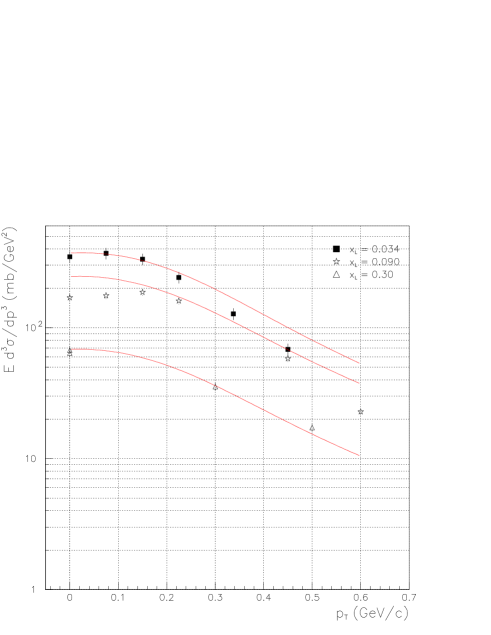
A relationship between the distribution of produced pions and the neutrino spectra is illustrated in Fig.LABEL:enu_pt by showing the distributions of of pions responsible for neutrinos of different energies, as predicted by different production models.
2.2 Focusing Elements
A system of parabolic magnetic horns focuses the secondary particles by giving them a kick proportional to the radius at which particle traverses the horn. In case of a pointlike source such a system focuses all particles produced with a particular momentum. Finite radial sizes of the horns lead to a finite momentum byte of the secondary particles which are focused. The central momentum of the focused particles depends on the relative distance of the target and the horn.
The hadron beam does have a significant angular divergence due to several effects:
-
•
particles produced at small angles pass through the opening of the magnetic horns and enter the decay volume with the angular divergence characteristic for the bare target beam. This component is defined by the aperture of the horn opening and the distance of the target from the horn. These particles produce a high energy tail of the neutrino beam. This component produces also the main contribution of the background.
-
•
finite size of the primary proton beam
-
•
the finite size of the production target. Particles produced upstream of the focal point the the first horn will be overfocused whereas particles produced downstream of the focus will be underfocused, thus producing a divergent beam.
An overall angular distribution of hadrons after the focusing system is shown in the Fig.3.

2.3 Finite target length
The target length is typically comparable to the distance between the target and the first horn. As the result, different parts of the parent momentum spectrum will fall into acceptance of the horn for different sections of the target: higher momentum particles from the the beginning of the target and lower momentum particles from the end of the target will be focused. This will result in the difference in the spectra of the resulting neutrinos, as shown in the Fig.4. The three effects are readily apparent:
-
•
A number of pions (and hence a number of neutrinos) produced decreases along the target. This is due to the attenuation of the primary proton along the target.
-
•
Spectrum of pions (and neutrinos) is shifted towards lower energies along the target. This is the effect of the finite acceptance of the horn focusing system.
-
•
Relative contribution of the high energy tail increases along the target. This tail is due to the small angle particles which pass through the opening in the horn. The angular acceptance is much smaller for particles produced in the front section of the target. The attenuation of small angle particles traversing the target contributes another suppression factor.

Figure 4: Neutrino spectra from decays of particles produced in different sections of the target.
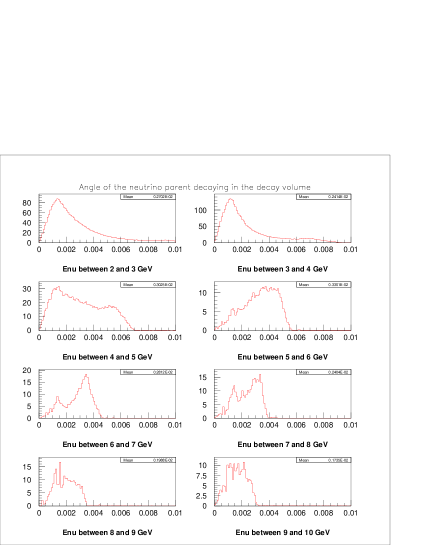
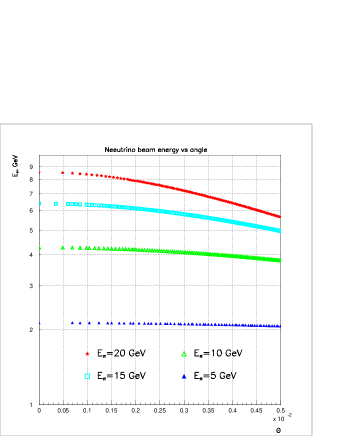
The long production target in conjunction with the two-horn focusing system will produce the pion/kaon (neutrino) beam with characteristics dependent upon the hadron energy. Fig.5 shows the distribution of the angle of the neutrino parents after the focusing system. Low energy part of the spectrum comes from well focused beam. Neutrinos in the range 5 to 7 Gev are produced by pions which are increasingly less and less focused, whereas the high energy tail are produced from pions produced at very low angles and passing through the opening of the magnetic horns.
2.4 Decay Volume
Pion and kaon beam formed by the horns decays in the decay volume consisting of the last section of the target cave and the decay pipe. Neutrinos are produced in two-body decay . Energy and the flux of the produced neutrino depend on the decay angle as:
| (1) |
| (2) |
where
-
•
is the Loretnz boost factor of a pion
-
•
is a decay angle, i.e. the angle between the pion and the produced neutrino directions
-
•
is the area of the detector and is the distance between the decay point and the detector.
Finite transverse size of the decay volume, while important to maximize the overall neutrino flux, causes a systematic difference between the neutrino spectra observed at the near and far detectors. This is due to the fact that the decay angle (i.e. the angle between the parent pion and resulting neutrino directions) necessary to reach the near and the far detectors are different for decays occurring at finite radii as shown in Fig.6. (A necessary element of a rigorous proof is the approximate azimuthal symmetry of the hadron beam and the fact that for the majority of the focused particles.)
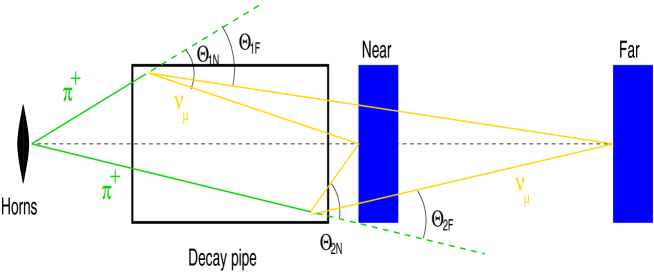
Fig.7 illustrates the dependence of the produced neutrinos and Fig.8 shows the neutrino flux as a function of the decay angle. This dependence is very strong for high energy pions, say . At the energies relevant to the main component of the low energy beam, neutrino energy is very weakly dependent on the decay angle for .
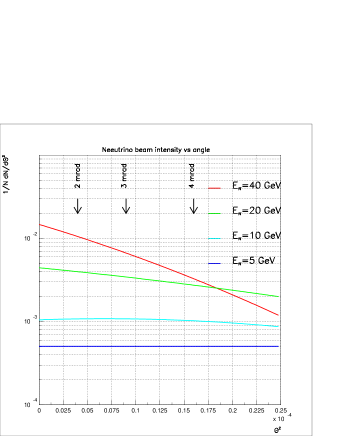
Hadron beam produced by the focusing system has an angular divergence of the order of few miliradians. Such a divergence produces a hadron beam much larger than the radius of the decay volume, therefore most of the particles will hit the walls of the decay pipe, unless they decay earlier. Dependence of the angular distribution of pions on the pion energy (Fig. 5) will therefore lead to a correlation between the resulting neutrino energy and the average decay point of the parent pions as shown in Fig.9. This effect is contributing to a difference between neutrino spectra observed with the near and far detectors. The neutrino flux observed by the detector varies with as , where is the average position of the decaying pion. This reduction of the flux due to the angular divergence is independent of the neutrino energy, as the variation of is negligible compared to . In case of the near detector, though, the variation of of the attenuation of the flux with the neutrino energy is significant.

Finite transverse size of the decay volume, in conjunction with the angular divergence of the pion beam leads to another contribution between the neutrino spectra observed in the near and far detectors. For a pion decaying at some radius R inside the decay volume the decay angle pointing to the near detector is larger than the decay angle necessary for neutrino to reach the far detector, see Fig.10.

As a consequence of the dependence of the neutrino energy on the decay angle (Fig.7) the neutrino energies detected at the near detector will by systematicly lower in the near detector even if both neutrino fluxes are produced by the same parent hadron beam, Fig.11.

2.5 Near and far neutrino fluxes
Hadron beam produced at the target and focused by the horns gives rise to the neutrino beam. Neutrino fluxes detected by the near and far detectors are highly correlated, as they are produced by the same hadron beam. They are not identical though. The difference of the spectra at the far and near detectors are primarily due to two effects:
-
•
a solid angle subtended by the unit area at the near detector varies considerably between the beginning and the end of the decay volume. This effect is very small for the near detector. This effect is shown in Figs.12 and 13
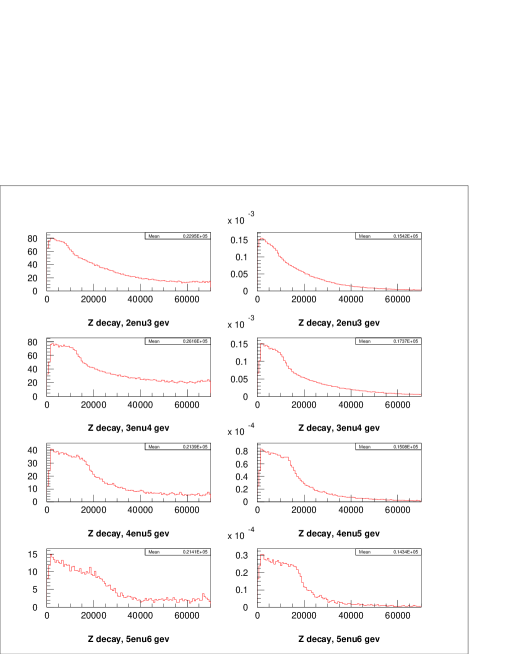
Figure 12: Decay point of the neutrino parent for different neutrino energies. On the left are decays yielding neutrino in the near detector, on the right there are decays yielding neutrino in the far detector 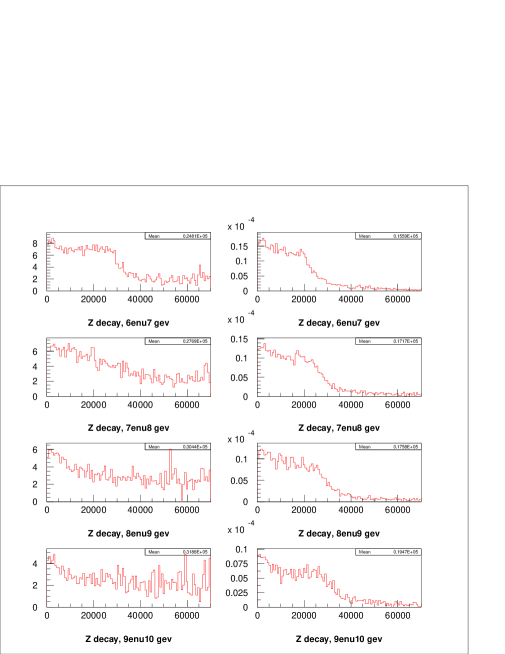
Figure 13: Decay point of the neutrino parent for different neutrino energies. On the left are decays yielding neutrino in the near detector, on the right there are decays yielding neutrino in the far detector As the result, the neutrinos produced towards the end of the decay pipe constitute much larger fraction of the neutrino flux detected at the near detector in comparison with the far detector. As the distribution of the decay points along the decay pipe varies with the hadron momentum, the resulting energy distributions at both detectors will be somewhat different, leading to a variation of the ratio as a function of neutrino energy. Thus the prediction of the far detector spectrum from the spectrum measured at the near detector relies on the proper modeling of the longitudinal distribution of the decay points. The shape of longitudinal distribution of decay points is primarily determined by the width of the decay volume and the angular divergence of the hadron beam. At low hadron momenta a finite lifetime of pions and kaons has a significant contribution.
-
•
angular divergence of the hadron beam spreads particles throughout the volume of the decay pipe. Neutrinos from decays at large radii will be produced at different decay angles to reach the near and the far detectors. As the result, the energy of neutrinos observed at these two detectors will differ, with the energy at the far detector being in general higher, as shown in Fig.14.
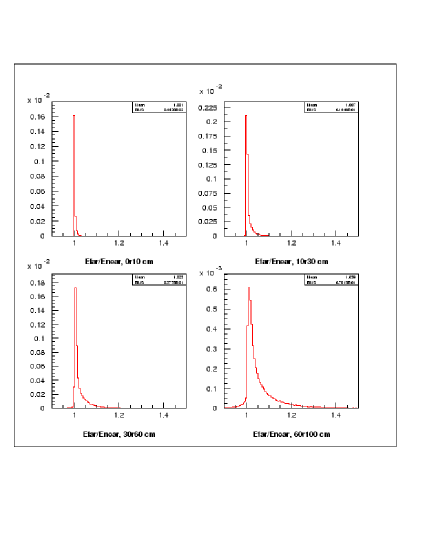
Figure 14: Ratio of the energy observed in the far and near detectors for neutrinos produced at different radii in the decay volume
3 A method to derive the Far Detector spectrum
A neutrino spectrum observed at the far(near) detector can be derived from the knowledge of the secondary hadron distribution (after the focusing elements) and the geometry of the decay volume:
| (3) |
and
| (4) |
where:
-
•
is the radial, angular () and momentum distribution of pions(kaons) after the focusing elements. This function is a convolution of the production cross section, horn acceptance and horn focusing.
-
•
is a probability that a pion(kaon) with momentum , radial position and the angle will decay at the position along the decay volume. The radial position of the decay will be . For simplicity we have set at the end of the focusing system. This function depends solely on the geometry of the decay volume
-
•
is a probability that a pion(kaon) with momentum and the angle decaying at the position along the decay volume at the radius will produce neutrino with energy at the center of the respective detector. This function is determined purely by two-body kinematics.
For simplicity of the presentation we have assumed an axial symmetry of the problem. In practice the integral is over a six-dimensional space of . A complete treatment must also include neutrinos produced before the end of the focusing system.
3.1 First Approximation: Pencil-like Beam
In case of a pencil-like hadron beam, i.e. a beam with no angular divergence, directed towards the far and near detectors the relation between the near and far neutrino spectra is simplified. The decay angle and the neutrinos detected at both detectors have the same energy . Thus the measured neutrino flux at the near detector provides a direct measurement of the energy distribution of the parent pion beam.
The neutrino spectra observed at the near and far detectors are not identical, though. They differ, because of the differences in the acceptances of the near and far detector. The acceptance is a function of the distance from the decay point to the detector. This distance is practically the same for all neutrino energies in the case of the far detector, but it is a function of energy, due to the finite pion life-time, at the near detector position. Thus the neutrino spectrum at the far detector can be derived from the spectrum observed at the near detector as:
| (5) |
The transfer function , in this simple case, is in fact calculable from the known pion life-time, the length of the decay region and the position of the near and far detectors.
3.2 Second Approximation: Small Aperture Beam and ’Double Ratio’ Method
Focusing of particles with large momentum spread and produced in an extended target into a parallel beam is not possible. A realistic beam has a very sizeable angular divergence ( see Fig.5) which is different for pions of different energies. This effect determines the effective distribution of the decay points along the length of the decay volume, as shown in Figs.12 and 13. Derivation of the transfer function requires, in this case, a Monte Carlo simulation of the production and focusing of the pions and kaons. The transfer function is just a ratio of integrals 4 and 3 and its shape is shown in Fig.15

The mean value of the function, , is given by the square of ratio of the far and near detector distances from the neutrino source. The shape of this function is related to the variation of the longitudinal distribution of the decay points along the beam line as shown in Figs.12 and 13. The structures observed in this function are reflections of the acceptance of the focusing elements. A sharp rise around is a related to the fact that the pions with start missing the first horn and loose benefit of the focusing. As a result their angular distribution broadens, and they hit walls of the decay volume before they decay. The average distance from the decay point to the near detector increases (in comparison with the focused pions of lower energy) and the flux observed at the near detector is reduced thus producing a rise in the ratio. An analogous mechanism, involving the horn 2 is responsible for the rise of the ratio around .
The transfer function will depend, somewhat, on the assumed production spectra in the target, but its overall value and the detailed shape is chiefly determined by the geometry of the beam line.
For a beam of a very small radial aperture, such that decay angles leading to the near and far detectors are very similar, the energy of neutrinos observed at the both detectors will be very close (see Fig.14) and the dependence on the production cross sections will cancel, to a first order, in a ratio
This method of predicting the far detector spectrum, often referred to as a ‘double ratio’ method is widely used to estimate the systematic errors in the disappearance experiments. Owing to a smooth behavior of the underlying production cross sections, acceptances and focusing, this is a quite robust method of predicting the far detector flux.
Shortcoming of this method comes to light when some instrumental effects modify the neutrino (or pion) spectra in a very limited energy range. An example of such an effect is a small displacement of focusing elements (horns) whereby some small part of the phase space of the produced particles becomes focused and produces neutrinos of some energy, at the expense of particles in a neighboring part of the phase space, being moved out of the horns acceptance and hence producing significantly fewer neutrinos. As a result of the extended transverse size of the decay volume these ’gained’ and ’lost’ neutrinos will have somewhat different energies in the near and far detectors, thus leading to a characteristic bipolar shape of the predicted far detector spectrum fluctuating around the real observed spectrum.
The limitation of the ‘double ratio’ method becomes apparent when one attempts to predict a spectrum of the far detector in the ’off-axis’ position, where the spectrum of the observed neutrinos is completely different then that in the near detector.
3.3 A Far-to-Near Correlation Matrix Method
Neutrino spectra in the far and near detectors are correlated, as they result from the decays of the same parent hadron beam. Thus, every neutrino with energy observed at the near detector implies a certain flux of neutrinos with energy distribution given by
| (6) |
This flux, implied for the far detector, depends on the position of the decay point as well as on the momentum vector of the parent hadron. Integration over all decays yields a matrix, which correlates the spectra at both locations. The matrix element is given by
| (7) |
where the integrals are over the bin sizes and , respectively. In order to relate the observed event spectra (rather than the neutrino spectra) at both detectors the weight functions should be replaced in the integral (7) by .
Given a vector containing the observed event spectrum in the near detector, the predicted far detector spectrum can be derived as:
| (8) |
We have computed the correlation matrix for the event spectra in bins using a set of Ntuples generated using GNUMI simulation program and corresponding to protons on target [16]. Uppermost fragment of the matrix, thus showing the correlation between far and near detector event spectra below is shown in (9). Columns of the matrix are related to the energy observed in the far detector, rows to the energy in the near detector.
| (9) |
The matrix provides a very good representation how the far detector spectrum relates to the near one. Column , for example, states that event observed in the near detector in the energy bin between and implies (modulo an overall factor ) that the far detector should register event with energy between and , events between and , events between and etc.
The matrix is computed for all the simulated CC events, regardless of the actual neutrino parent. To a good approximation, no background from interactions of other neutrino types (including ) needs to be included, as the detection of a uniquely identifies a charged current event. For the present studies, smearing was ignored, i.e., matrix elements were calculated from generated near and far detector energies.
For the analysis purposes the correlation matrix should be computed for the spectra with smearing and acceptance cuts properly included.
4 Systematic Errors: Sensitivity of the Prediction to the Details of the Parent Hadron Beam
When the near-to-far correlation matrix is computed in the same model as the near and the far detector spectra, the predicted far spectrum using the equation 8 matches exactly the actual far spectrum. It implies that the far detector spectrum would be known exactly, should the beam simulation program describe the real beam in all details. In practice, the understanding of the beam is somewhat limited, hence leading to systematic errors on the far spectrum prediction. In general, these errors will be due to the differences of the spatial and momentum distribution of pions decaying within the decay volume.
4.1 How Small the Systematic Errors Should be?
Clearly, smaller the systematic errors are - the better. In practice there is always a threshold below which a further reduction of the systematic error of the experiment has no impact on the physics results.
A judgment of the impact of the systematic errors on the physics result is fairly complicated. It depends on several aspects of the experiment, like:
-
•
how large the measured effects are with respect to the systematic errors?
-
•
what is a type of a measurement? For example a fairly small, but systematic distortion of a spectrum may have a significant influence on the determined shape parameters.
-
•
what are the experimental smearing effects?
-
•
what are the statistical errors? etc…
Neutrino disappearance experiment, like MINOS, is expected to detect and measure a very dramatic effect of disappearance at a particular neutrino energy. It is very difficult to imagine systematic errors related to the understanding of the neutrino beam which could create false effects of this magnitude or could significantly distort the observed effect of full disappearance.
On the other hand a detailed shape of a disappearance curve has a significant physics interest. In the least interesting case it will provide yet another proof of the underlying physics mechanism. In a more interesting case it may provide a clue for physics phenomena beyond the current orthodox picture.
Statistical errors of the experiment provide a reasonable yardstick for the systematics error. The expected statistical errors of the observed neutrino flux at the far detector and an exposure corresponding to protons on NuMI target are shown in Fig.16 for the case of bins. These error refer to the ’no-oscillation’ case.

In reality the reduction of the statistics induced by the neutrino disappearance as well as the experimental smearing effects will tend to further reduce the importance of the systematic errors.
4.2 Dependence on the Particle Production Model
The extent, to which the distributions of particles in the integral (7) defining the correlation matrix change with different production models, and, as a result, the matrix elements change, contributes to the systematic error.
Dependence of the predicted far detector flux can be evaluated by applying the same correlation matrix to the near detector spectra, as derived in various production models, and comparing the predicted far detector spectra computed from Eq.8 with the actual ones.
There are no GEANT interfaces to the production models other than FLUKA. Different production models can be studied by re-weighting the neutrinos according to the production cross section of its parent. Such a weighting procedure, developed by Mark Messier[17], exists only for the parent .
The correlation matrix was re-computed for the neutrinos produced by the pions only and leaving aside the neutrinos produced from kaon and muon decays as well as neutrinos produced in proton-induced showers in the final absorber. This matrix was subsequently applied to the near detector spectrum, re-weighted for different models and the results were compared with the far detector spectrum in these models. Results are shown in Fig.17.

Far detector spectrum is predicted with the accuracy of the order of for the component of the neutrino beam produced by the focused part of the hadron beam. The prediction is accurate to for neutrinos energies up to , the sensitivity of the method to the production spectra somewhat reduced in comparison with the ’double ratio’ method.
4.3 Production Model Dependence: Medium Energy Beam
The procedure described in the section4.2 was repeated for the case of the medium energy beam. The results are shown in Fig.18.

As before, the prediction is good to for the entire region of peak intensity and it remains good to for energies up to . The sensitivity to the production model details is, again, reduced in comparison with the ’double ratio’ method.
4.4 Sensitivity to the Details of Modeling of the Neutrino Beam
Functions and used to compute the correlation matrix matrix depend on the momentum and spatial distribution of hadron in the decay volume, hence they depend on the geometry and focusing characteristics of the beam forming elements. How sensitive is the resulting matrix to the details of the understanding of the beam line?
Two programs are currently in use to simulate the neutrino fluxes:
-
•
GNUMI is a GEANT-based full simulation of the production and focusing of particles. It includes scattering and re-interactions of the produced hadrons.
-
•
PBEAM is a much faster, albeit somewhat simplified, intended for optimization of the beam line design.
We have used these two programs corresponding to somewhat different beamline configurations: geometry of the target cave, details of the magnetic field in the horn, thick window of the decay volume are among the known differences between them. It is not surprising, therefore, that the shape of the neutrino spectrum resulting from these two programs are not identical, as shown in Fig.19. In a similar fashion these two programs yield different spectra for the far detector.

From the spectrum at the near detector the far detector spectrum can be calculated using the Eq.8. A comparison of this prediction with the actual far detector, PBEAM-calculated, spectrum is shown in Fig. LABEL:pbeam_reconstructed together with the similar comparison for the ’double ratio’ method. Despite the major differences in the simulation programs and the resulting difference in the predicted neutrino spectra between the program used to derive the correlation matrix and the program used to ’analyze’ the data the prediction is good to a level or better. Again, the ’double ratio’ is more sensitive to the differences between the program than the matrix method.
4.5 Distribution of Pions in the Decay Volume
As shown in previous sections, the difference between the near and far detector spectra is directly related to the finite decay pipe size and to the distribution of decay vertices inside the decay volume.
A robustness of the prediction of the far spectrum can be investigated by artificially enforcing major deviations from the spatial distributions produced by the beam simulation programs. While such a procedure does not correspond, probably, to any realistic imperfections of the beam line, it nevertheless offers an insight into a sensitivity of the method.
A radial beam profile can be modified by applying a weight factor of the form
| (10) |
where cm corresponds to a half-radius of the decay pipe and is the magnitude of the distortion.
Application of the standard transformation to the near detector neutrino spectrum corresponding to the shrunk down or blown-up hadron beam leads to a prediction of the far detector spectrum with the accuracy shown in Fig.20.

Prediction of the shape of the neutrino spectrum in the far detector is not very sensitive to the details of the transverse beam profile. Shrinking and expanding the transverse profile of the hadron beam by affects the predicted far detector spectrum by or less. Even more drastic change of the profile by leads to a modest change in the predicted spectrum.
Variation of the distribution of the decay vertices along the beam axis is potentially more serious source of the systematic error, given the proximity of the near detector. A sensitivity to the knowledge of this distribution can be evaluated in a similar manner by re-weighting the decay points with
| (11) |
where m and is variable parameter, as before.

Results, shown in Fig.21, indicate that the knowledge of the longitudinal distribution of the decay points to is needed to keep the systematic error within the bounds of the statistical accuracy. It is not clear what effects in the beam line may cause such a significant re-shuffling of the decay points. One possible source of such an effect would be an additional component of the hadron beam consisting of well collimated pions thus traveling much longer distance along the decay volume. Such a component can be created, for example, by a proton beam scraping inside of the collimators upstream of the target. High energy pions created in such interactions and focused by magnetic horn would have small angular divergence (owing to the large longitudinal momentum component) and hence they would produce disproportionally large neutrino flux in the near detector.
To keep the systematic errors under control it is therefore very important to minimize the amount of materials which can be intercepted by the proton beam upstream of the target. It is perhaps possible to constrain the actual distribution of the hadron in the decay pipe , and thus reduce the systematic error,by monitoring the energy deposition along the length of the decay volume.
4.6 Horn Current
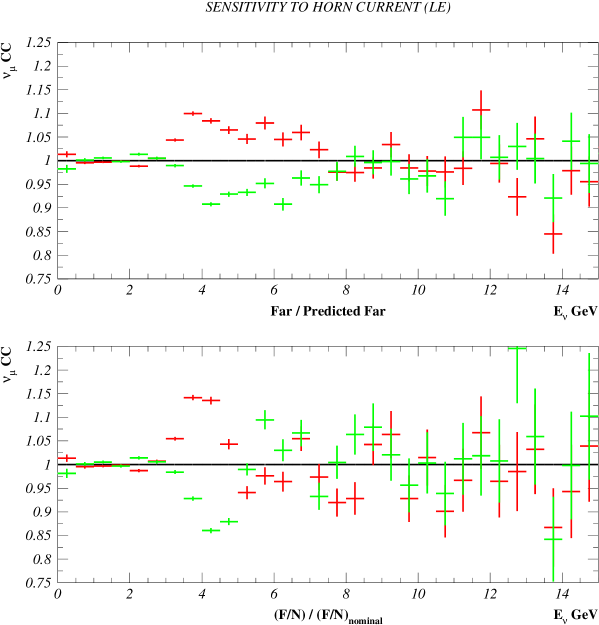
The event rates and their energy distribution in the far and near detectors, as well as the far/near ratio depends on the strength of the focusing elements. These effect was investigated using samples of events generated with GNuMI the horns current changed from the nominal value of to the values of and . The near detector spectra were used to compute the far detector spectra using the matrix corresponding to the nominal horn current.
Fig.22 shows that to maintain the neutrino flux prediction with the accuracy below it is necessary to monitor the horn current to as well. In addition to the monitoring of the peak current for the horn, the timing of the current pulse must be monitored as well. In a particular case of the NuMI horn with pulse it is required that the timing of the pulse is monitored to better than to maintain the required level of the systematic error.
4.7 Horn Displacements
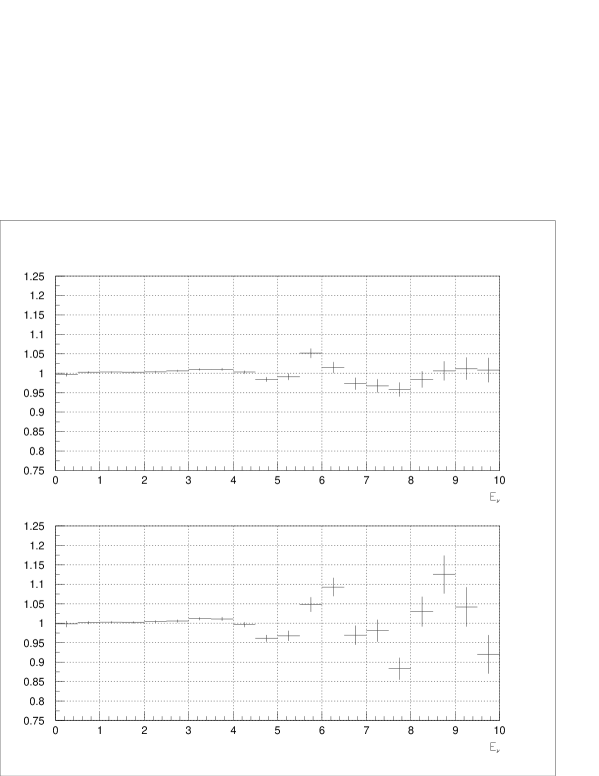
Position of the magnetic horns defines edges of the beam acceptance and the position (in the phase space of the produced particles) of the boundary between the focused beam and the bare target beam. Small displacement of the horn causes some bin of high momentum pions to be focused and increase significantly their contribution to the neutrino flux, at the expense of the small fraction of neutrinos at slightly lower energy. Displacement of the first horn will produce also change of the phase space of particles focused by the second horn, too. The resulting change of the event spectra observed in the near and far detectors is shown in Fig.23.

Due to the finite radial extent of the decay volume the additional component of the neutrino flux shows up at slightly different energies in the near and far detectors. As a result, the sensitivity of the ’double ratio’ method to the horn displacement is somewhat enhanced.
The far detector spectrum predicted with the help of the correlation matrix , Eq.8 is much less sensitive to the horn displacements, as illustrated in Fig.24.
5 Further Improvements: Large Near Detector
The correlation matrix defined in Eq.7 relates the near and far detector spectra averaged over the detectors volume. The far detector, in all practical cases, is located so far from the neutrino source that there is no variation of the neutrino spectrum over the area of the detector.
The transverse size of the MINOS near detector is small compared to the typical beam size of the low energy beam, hence the near detector spectrum is practically identical over the entire fiducial volume.
In case of a near detector large enough to detect spatial variation of the neutrino flux the correlation matrix can be further refined to take advantage of the additional information. This might be the case, for example, for the K2K experiment.
A correlation matrix can be calculated by carrying out the integral 7 using the weighting function describing the probability that a pion(kaon) with momentum and the angle decaying at the position along the decay volume at the radius will produce neutrino with energy inside the detector area in the near detector.
The far detector spectrum can be computed by integration over the near detector area of the predicted contributions, as implied by the spectrum of events detected in the area elements :
| (12) |
where the vector is the spectrum of the events detected in the area of the near detector.
6 Conclusions
A prediction of the neutrino flux in the far detector from the one observed in the near detector is very robust. This prediction is primarily determined by the geometry of the beam line and the properties of the focusing elements.
The overall event rate can be predicted with an accuracy better than . Systematic error on the shape of the energy distribution of neutrinos are of the order of for the main part of the flux (corresponding to the beam created by the well focused fraction of the hadron beam) and of the order in the tails.
The sensitivity of the far detector flux prediction is maximal in the energy regions corresponding to the edges of the acceptance of the magnetic horns. In a particular case of the low energy NuMI beam it is a region around and , corresponding to the acceptance edges of the horn 1 and horn 2, respectively.
An improved prediction method, utilizing the correlation of the energy spectra, reduces the sensitivity of the far detector spectrum prediction, especially to the effects producing localized distortions of the spectrum. This method enables a reliable prediction of a neutrino flux at different distant locations, based on the same near detector measurement.
7 Acknowledgments
Numerous discussions with our collegues from NuMI/MINOS have helped us to understand the issues presented in this paper. We are particularily grateful to A. Byon, J. Hylen and A. Marchionni for their critical review of this paper.
This work was supported in part by grants from the Illinois Board of Higher Education, the Illinois Department of Commerce and Community Affairs, the National Science Foundation, and the U.S. Department of Energy.
References
- [1] I.E. Stockdale et al., Phys. Rev. Lett. 52, 1384 (1984)
- [2] F. Dydak et al., Phys. Lett. B134, 281, (1984)
- [3] F. Bergsma at. al., Phys. Lett. B142, 103, (1984)
- [4] K2K Collaboration, to be published in Phys. Lett. B(2001); K. Nishikawa et al., KEK-PS proposal (E362) (1995)
- [5] H.W. Atherton et al., CERN 80-07, 1980
- [6] G. Ambrosini et al., Phys. Lett. B420, 225, (1998); G. Ambrosini et al., Phys. Lett. B425, 208, (1998)
- [7] G. Ambrosini et al., Eur. Phys. J. C10, 605, (1999)
- [8] D.S. Barton et al., Phys. Rev. D35, 35, (1987)
- [9] P.A. Aarnio et al., CERN TIS-RP-190 (1987)
- [10] N.V. Mokhov and S.I. Striganov, AIP Coinf. Proc. 435, 543 (1997)
- [11] A.J. Malensek, Fermilab Report FN-341 (1981)
- [12] M. Bonesini, A. Marchionni, F. Pietropaolo, T. Tabarelli de Fatis, Eur. Phys. J. C20, 13-27, (2001)
- [13] Alberto Marchionni, private communication.
- [14] M. Messier et al., “Neutrino Fluxes, Hadron Production, and the Hadronic Hose” (NuMI-B-700);
- [15] M. Szleper, “Study of Hadron Production Models with Hadron Monitors” (NuMI-B-762).
- [16] The Ntuples were generated at Nortwestern University by Gokhan Unel. They correspond to a version of GNUMI as of spring 2001.
- [17] M. Messier, Harvard University, private information