Design and Performance of the Level 1 Calorimeter Trigger for the BaBar Detector ††thanks: Manuscript first received November 2, 2000. This work was funded by the Particle Physics and Astronomy Research Council, UK.
Abstract
Since May 1999 the BaBar detector has been taking data at the PEP-II asymmetric electron-positron collider at the Stanford Linear Accelerator Center, California. This experiment requires a very large data sample and the PEP-II accelerator uses intense beams to deliver the high collision rates needed. This poses a severe challenge to the BaBar trigger system, which must reject the large rate of background signals resulting from the high beam currents whilst accepting the collisions of interest with very high efficiency. One of the systems that performs this task is the Level 1 Calorimeter Trigger, which identifies energy deposits left by particles in the BaBar calorimeter. It is a digital, custom, fixed latency system which makes heavy use of high-speed FPGA devices to allow flexibility in the choice of data filtering algorithms. Results from several intermediate processing stages are read out, allowing the selection algorithm to be fully analysed and optimized offline. In addition, the trigger is monitored in real time by sampling these data and cross-checking each stage of the trigger calculation against a software model. The design, implementation, construction and performance of the Level 1 Calorimeter Trigger during the first year of BaBar operation are presented.
I PEP-II and BaBar
The BaBar experiment [1], [2] has been built to study -violation in the decays of mesons. These are produced in the decays of mesons created in collisions at the PEP-II collider at the Stanford Linear Accelerator Center in California, USA. -violating effects are expected to be subtle, and so these measurements require very large statistical samples of mesons. This means that the PEP-II machine must deliver unprecedentedly high luminosity, and indeed it has already set a new world record luminosity of greater than cms-1 during the first year of operation, enabling BaBar to record a data sample of approximately 20 million meson decays.
The high luminosity of PEP-II has been obtained by using very high beam currents, of order 1 A. The PEP-II machine design achieves this by filling the machine with 1658 bunches in each beam, with a bunch collision rate of 238 MHz. A serious consequence of this high current is that the machine-induced backgrounds have been very significant. This has provided a major challenge for the BaBar trigger and data acquisition system, as this unwanted background must be rejected without losing the meson decays of interest. Since high statistics are vital for this experiment, the trigger design emphasized the need for high efficiency.
II The Level 1 Trigger Requirements
The BaBar trigger has two levels, a hardware Level 1 and a software Level 3 trigger. This article describes one of the two main sections of the Level 1 trigger, the ElectroMagnetic calorimeter Trigger (EMT). The other main section, the Drift Chamber Trigger (DCT), has been described previously [3]. A third component, the Instrumented Flux return Trigger (IFT) is used to collect events with muon particles which are used for calibration purposes. This part of the trigger is not primarily designed to be efficient for mesons.
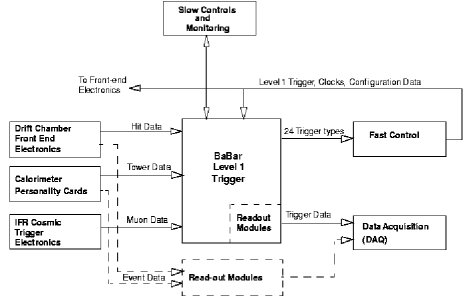
These two main subsystems work independently and in parallel, processing data from the calorimeter and drift chamber detectors respectively, and seek characteristics of particles coming from meson decays to identify signals. These signals, termed trigger “primitives”, are then passed to a third system, the Global Level 1 Trigger (GLT). Here the individual primitives are combined to form a picture of the whole particle collision, and the GLT then decides whether or not to accept this collision. This trigger decision is passed to the fast control system where it is distributed to the whole detector. Fig. 1 shows the systems with which the Level 1 trigger interacts.
The technical requirements for the Level 1 trigger system as a whole are set by the data acquisition [4] and other electronics systems of BaBar. To ensure maximum redundancy, the EMT and DCT subsystems were each designed to satisfy these requirements independently.
All the front-end electronics systems of the BaBar detector buffer their data for 12 s, which defines the latency allowed for the Level 1 trigger decision. The collision rate of 238 MHz is effectively continuous as far as the time resolution of the drift chamber and calorimeter detectors are concerned, and so the Level 1 trigger has the task of determining the time of the collision of interest to within 1 s. Each system in BaBar then reads out data in a window of at least 1 s, in order to ensure that the data from the triggered collision are fully collected.
The data acquisition system is designed to accept a maximum Level 1 output rate of 2 kHz. This is much higher than the rate of physics collisions, which totals around 120 Hz. The Level 1 trigger is designed to be as unbiased as this maximum output rate allows, and to accept all physics events without preselection. The challenge is to provide such a trigger whilst still rejecting sufficient background to keep the total rate below 2 kHz.
A number of other requirements must be satisfied in addition to high efficiency. The efficiency must be measurable accurately, the trigger must be stable and robust to varying background levels, and it must be flexible enough to be adaptable to unexpected operating conditions. The first of these is ensured by the redundancy of the EMT and DCT triggers. The remainder were satisfied by designing the trigger to be able to operate at up to ten times the expected level of background. The EMT design described below has been shown to fulfill all the requirements.
III The EMT Data Interfaces and Algorithm
The EMT receives its data from the electromagnetic calorimeter. There are 6580 channels in the electromagnetic calorimeter, each giving a 16-bit energy value at 3.7 MHz. These data are extracted continuously (without triggering) from the front-end electronics via 280 fibre-optic links [5]. In order to reduce the EMT input data rate, the data are summed over typically 24 channels before being sent to the EMT, since a physical energy deposit is usually spread over multiple calorimeter channels. This reduces the input rate to 2.1 GBytes/s, which are transmitted as serial 59.5 MHz differential ECL signals. To compensate for differing cable lengths and component time delays, the data are resynchronised to the 59.5 MHz clock when they are received by the EMT.
The technique used by the EMT to identify particle energy deposits relies on the fact that the probability of multiple particles arriving close together in time in the same region of the calorimeter is low. This is true even in the high background conditions of PEP-II. This means energy deposits may be summed over azimuthal () slices of the calorimeter, yielding 40 so-called “ strips”, without significantly increasing the probability of pile-up. This considerably simplifies the trigger logic, and the EMT processing now becomes a one-dimensional, rather than two-dimensional, problem. Each strip corresponds to 165 crystals; these are added in overlapping pairs to form 40 “ sums” in order to fully contain energy deposits which extend into a neighbouring region.
An overview of the algorithm applied to the sums is shown in Fig. 2.

The data from each sum are used in two ways: to find the time at which the energy was deposited, and to compare the total energy against several thresholds.
The time is determined using a digital 8-tap finite impulse response (FIR) filter which operates on the summed energy signal from each sum at a frequency of 3.7 MHz. Before digitisation, the calorimeter signal is shaped by a three stage differentiator-integrator-integrator (CR-RC-RC) circuit with time constants of 0.8 s, 0.25 s, 0.25 s respectively. The EMT FIR weights are chosen such that this shaped signal drives the filter output from positive to negative at a fixed time interval after the particle arrives. This is illustrated in Fig. 3. It is this “zero-crossing” which is detected and used as the basic time estimate. To increase the accuracy of this determination, the EMT also performs a linear interpolation between consecutive FIR output values to approximate the output at 7.4 MHz.

In parallel, the energy values of the sums are compared against three threshold values. These configurable thresholds are typically set to values around 120 MeV, 300 MeV and 800 MeV. The first is designed to be efficient for minimum ionising particles, which on average deposit 180 MeV in the calorimeter. Typical GLT triggers would require four non-neighbouring sums above this lowest threshold, or three sums with a minimum angle separation between at least one pair of them of . The other thresholds are set as low as possible, consistent with reasonable background trigger rates. These data are typically used in the GLT for triggers requiring two sums, such as two sums above the 300 MeV threshold with a minimum angle separation of , or two non-neighbouring sums above the 800 MeV threshold with no further angle requirement.
Each of the three thresholds from each sum has a corresponding output bit. The bits from pairs of sums are put through an OR so as to reduce the number of bits for the whole range of from 40 to 20; this is necessary as the GLT does not have the input bandwidth for a 40-bit wide array. The degradation on the trigger performance because of this OR has been checked to be negligible. These bits together form the EMT primitives. The number and position of these bits are used in the GLT to determine if a valid trigger condition existed, such as the ones outlined above. The time determination from the FIR filter is used to gate the threshold bits so that they are only set on around the time of a valid energy deposit. The bits are transmitted to the GLT as differential PECL at a rate of 7.4 MHz, giving a total data rate for these data of 450 Mbits/s.
IV Implementation of the EMT
The algorithm outlined above was implemented so that data from each sum are processed by a single “Algorithm” Xilinx 4020E FPGA clocked at 59.5 MHz. All 40 such components operate in parallel. They are distributed over ten Trigger Processor Boards (TPB), each containing four such FPGA’s, all with identical firmware. Each FPGA, and TPB, runs independently of the others, so the data cannot be considered at a “global” event level until they reach the GLT. An overview of the whole EMT system is shown in Fig. 4.

The TPB’s are housed in a 9U VME crate with a standard J1 backplane and three custom backplanes covering J2 and J3. The EMT was built to operate with the same protocol as every front-end system in BaBar, in order to minimise the need for system-specific readout software. This protocol is implemented via a TX/RX fibre-optic connection [5] from a BaBar ReadOut Module (ROM) [4], which is common to every system in the detector. A split J2 and J3 backplane divides the crate into two independent sections, one occupied by the ROM and a related fast control and timing module, the other containing the EMT cards.
The whole EMT is timed and controlled via the fibre-optic connection from the ROM. The fundamental 59.5 MHz clock signal and all configuration and control commands are sent along this fibre and distributed across the custom backplane to the TPB’s via an optical-to-electrical converter TRansition Board (TRB) in the centre of the crate. Because of the high clock speed, all the custom backplane signals were implemented as differential 100 ECL point-to-point connections. In addition, care was taken to route the differential lines on the custom backplane as closely as possible and equalise the signal return delay times between the TRB and each TPB. The command protocol is decoded on the TPB by a “Fast Control” Xilinx 4013E FPGA, which also performs all control functions on the board. All output data from the TPB’s are sent via the backplane to the TRB where they are converted to optical signals. Hence, the fibre-optic connection back to the ROM is used to transmit the event data and to read back configuration data, as standard in BaBar.
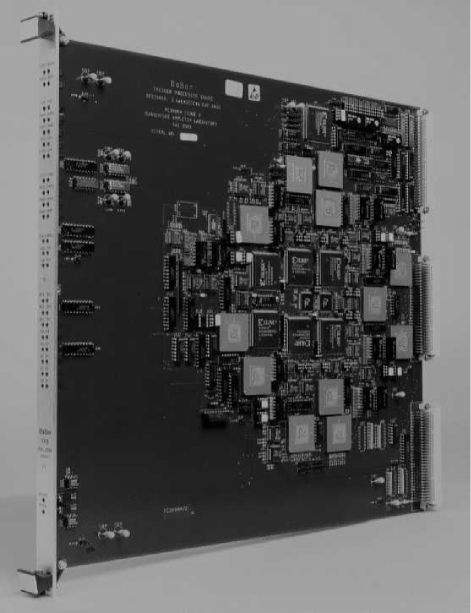
The major components on the TPB are shown in Fig. 5 and a photograph of a production board is shown in Fig. 6. Besides the algorithm calculation itself, the TPB performs several other functions that are described in the following paragraphs.

The data associated with the triggered event are read from the EMT whenever there is a Level 1 trigger and are buffered in the TPB for the 12 s latency. They are then stored in one of four event buffers until a readout request is sent from the ROM. Each event buffer can store up to s of data around the event time, this length being a configurable parameter. The latency and event buffers are configured and controlled by a “Formatter” Xilinx 4013E FPGA. These data are used offline for detailed checks on the trigger performance and for tuning the algorithm configuration parameters.
The TPB’s have large memory arrays which can be loaded with arbitrary data patterns via the ROM. These come in two sets; the “front-end” and “back-end” playback buffers. These can be configured to inject the stored data to the front of the algorithm processor, instead of the input data from the calorimeter, or to inject the stored data to the EMT output, instead of the normal output data to the GLT. Around 140 s of data can be stored. Any chosen data values can be clocked through the entire EMT chain. This functionality proved invaluable while testing the boards after production.
In addition to the standard BaBar control path, a read-only VME interface was built into the TPB. This allows several on-board “spy” memories to be read at a low rate while the trigger is active. These spy memories are filled with data from several locations in the trigger algorithm data path, namely the raw input data, the results of a number of intermediate processing stages and the final output to the GLT. The memories allow around 140 s of data to be stored at a time. This allows detailed, bit-level validation that the EMT is functioning correctly by comparing the spy data with a software model. The combination of the spy and the playback memories significantly reduced the time taken in the prototype and production testing cycles.
V Performance of the EMT
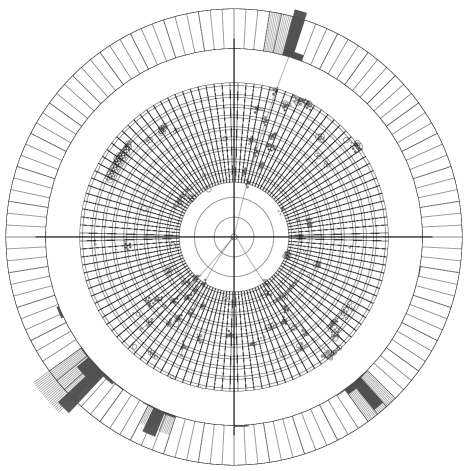
The EMT was fully installed for the start of BaBar data-taking in May 1999 and has operated successfully thereafter. Fig. 7 shows a typical event from the perspective of the Level 1 trigger. The detector is drawn end-on, with the calorimeter information being shown in the outermost layer. The solid blocks give the offline reconstructed calorimeter information, the hashed blocks the EMT data. Four significant energy deposits were identified, which together caused a trigger. In addition, four tracks were found in the DCT and these are shown as the lines in Fig. 7; they are clearly correlated with the calorimeter deposits. The other DCT information, shown in the inner part of Fig. 7, indicates the track hits detected (the small circles) overlayed on the drift chamber cell geometry. This event in fact satisfied several redundant triggers, which is typical of the physics processes of interest. Such events allow cross-checks of the EMT and DCT trigger systems against each other.
No major components have needed to be replaced. The only minor hardware concern has been the pin housing of the calorimeter-to-EMT cables which was damaged through removal of misplaced pins during the cable assembly. The faulty housings have been replaced.
The EMT satisfied the technical requirements for latency and time jitter without any tuning of the FIR filter weights beyond the values found from a simulation study during the design phase. Fig. 8 shows the distribution of times determined in the EMT for individual energy deposits, compared to a very much more accurate offline estimate using the drift chamber data. This demonstrates the time of each deposit is usually determined to much better than 1 s. The overall requirement for the Level 1 trigger of 1 s applies to the whole event. This event time is determined in the GLT from all the primitives, potentially including those from the DCT, and is effectively a weighted average. The time resolution of the event is therefore significantly better than that of each individual energy deposit.

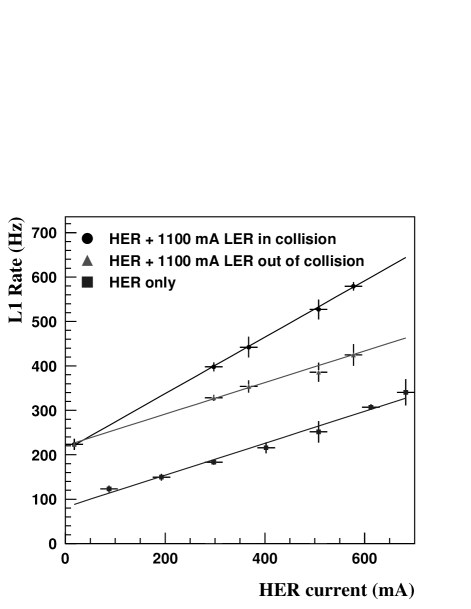
Typical Level 1 trigger rates are below 1 kHz, well within the 2 kHz limit. Fig. 9 shows the overall rate for DCT and EMT triggers combined as a function of the PEP-II beam currents. These rates were achieved despite a factor of twenty times higher backgrounds than expected levels, showing the importance of designing for high background rates from the outset. The GLT uses a combination of EMT-only triggers, DCT-only triggers and EMT-DCT combined triggers. In addition, an event often has multiple trigger conditions satisfied simultaneously. It is therefore not possible to give an unambiguous value for a trigger rate due to the EMT; the rate of events which only trigger because of the EMT is around 14% of the total, while removing the EMT completely from the Level 1 trigger would make the rate fall by around 50%.
The EMT efficiency for finding individual energy deposits above threshold is above 99%, except in regions with noisy channels which had to be excluded from the trigger (see below). Fig. 10 shows this efficiency as a function of the deposited energy around the lowest threshold used of 120 MeV. This threshold is designed to give a good efficiency for minimum ionising particles, which deposit an average of 180 MeV. It is seen that the trigger is at full efficiency by this energy.

During the initial data-taking period, several faulty channels were found which sporadically became noisy. Whenever this occurred, it was necessary to modify a configurable mask to exclude these noisy regions from the trigger. Some were due to isolated calorimeter channels which were then disabled individually within the calorimeter electronics, allowing the others in the 24 channel sum to continue to be used. However, some noisy regions were due to faults downstream of the sum, in which case the input from all 24 had to be disabled. The average number of input channels masked out over the first year was 1.5%. Simulation studies indicate that these dead regions caused a negligible loss of efficiency for meson decays.
The high efficiency per energy deposit translates directly into high efficiencies for physics processes. The EMT efficiency for Bhabha events, with both outgoing particles falling within the calorimeter acceptance, has been measured to be at least 97%, with some of the apparent inefficiency being due to muon pairs contaminating the sample used to measure the efficiency. The EMT efficiency for meson final states is more than 99%, where the high figure is achieved through multiple redundancy; typically the GLT requires four of the sums to be above the 120 MeV threshold, but hadronic events have around ten such deposits on average.
VI Conclusions
The EMT has performed well during the first year of BaBar data-taking. The hardware has had no significant problems and the high-speed FPGA design has functioned correctly throughout this period. The trigger has proven to be robust against backgrounds that were significantly higher than expected, has been flexible enough to deal with changing conditions, and has maintained a very high efficiency for all physics collisions of interest.
VII Acknowledgment
The authors would like to thank Su Dong for his help in the preparation of this paper.
References
- [1] BaBar Collaboration, D. Boutigny, Y. Karyotakis, S. Lees-Rosier, P. Petitpas, C. Evangelista, A. Palano, et al., “BaBar technical design report,” SLAC-R-95-457, March 1995.
- [2] BaBar Collaboration, B. Aubert, A. Boucham, D. Boutigny, I. De Bonis, J. Favier, J.-M. Gaillard, et al., “The first year of the BaBar experiment at PEP-II,” submitted to the XXXth International Conference on High Energy Physics, July 27-Aug 2 2000, Osaka, Japan.
- [3] A. Berenyi, H. K. Chen, K. Dao, S. F. Dow, S. K. Gehrig, M. S. Gill, et al., “Design and implementation of the level 1 charged particle trigger for the BaBar detector” and references therein, IEEE Trans. Nucl. Sci., vol. 46, no. 6, pp. 2006-2010, Dec. 1999.
- [4] R. T. Hamilton, R. Claus, P. Grosso, M. E. Huffer, C. O’Grady, I. Scott, et al., “The BaBar data acquisition system,” presented at 11th IEEE NPSS Real Time Conference, June 14-18 1999, Santa Fe, New Mexico.
- [5] HDMP-1012 and HDMP-1014 high speed serialiser and deserialiser from Agilent Technology, www.agilent.com. FTR-8510 electrical-optical transceivers from Finisar Corp., www.finisar.com.