Observation of
Large Violation in the Neutral Meson System
K. Abe9 K. Abe37 R. Abe27 I. Adachi9 Byoung Sup Ahn16 H. Aihara39 M. Akatsu20 G. Alimonti8 K. Asai21 M. Asai10 Y. Asano44 T. Aso43 V. Aulchenko2 T. Aushev14 A. M. Bakich35 E. Banas25 S. Behari9 P. K. Behera45 D. Beiline2 A. Bondar2 A. Bozek25 T. E. Browder8 B. C. K. Casey8 P. Chang24 Y. Chao24 K.-F. Chen24 B. G. Cheon34 R. Chistov14 S.-K. Choi7 Y. Choi34 L. Y. Dong12 J. Dragic19 A. Drutskoy14 S. Eidelman2 V. Eiges14 Y. Enari20 R. Enomoto9 C. W. Everton19 F. Fang8 H. Fujii9 C. Fukunaga41 M. Fukushima11 N. Gabyshev9 A. Garmash2,9 T. J. Gershon9 A. Gordon19 K. Gotow46 H. Guler8 R. Guo22 J. Haba9 H. Hamasaki9 K. Hanagaki31 F. Handa38 K. Hara29 T. Hara29 N. C. Hastings19 H. Hayashii21 M. Hazumi29 E. M. Heenan19 Y. Higasino20 I. Higuchi38 T. Higuchi39 T. Hirai40 H. Hirano42 T. Hojo29 T. Hokuue20 Y. Hoshi37 K. Hoshina42 S. R. Hou24 W.-S. Hou24 S.-C. Hsu24 H.-C. Huang24 Y. Igarashi9 T. Iijima9 H. Ikeda9 K. Ikeda21 K. Inami20 A. Ishikawa20 H. Ishino40 R. Itoh9 G. Iwai27 H. Iwasaki9 Y. Iwasaki9 D. J. Jackson29 P. Jalocha25 H. K. Jang33 M. Jones8 R. Kagan14 H. Kakuno40 J. Kaneko40 J. H. Kang48 J. S. Kang16 P. Kapusta25 N. Katayama9 H. Kawai3 H. Kawai39 Y. Kawakami20 N. Kawamura1 T. Kawasaki27 H. Kichimi9 D. W. Kim34 Heejong Kim48 H. J. Kim48 Hyunwoo Kim16 S. K. Kim33 T. H. Kim48 K. Kinoshita5 S. Kobayashi32 S. Koishi40 H. Konishi42 K. Korotushenko31 P. Krokovny2 R. Kulasiri5 S. Kumar30 T. Kuniya32 E. Kurihara3 A. Kuzmin2 Y.-J. Kwon48 J. S. Lange6 G. Leder13 M. H. Lee9 S. H. Lee33 C. Leonidopoulos31 Y.-S. Lin24 D. Liventsev14 R.-S. Lu24 J. MacNaughton13 D. Marlow31 T. Matsubara39 S. Matsui20 S. Matsumoto4 T. Matsumoto20 Y. Mikami38 K. Misono20 K. Miyabayashi21 H. Miyake29 H. Miyata27 L. C. Moffitt19 G. R. Moloney19 G. F. Moorhead19 S. Mori44 T. Mori4 A. Murakami32 T. Nagamine38 Y. Nagasaka10 Y. Nagashima29 T. Nakadaira39 T. Nakamura40 E. Nakano28 M. Nakao9 H. Nakazawa4 J. W. Nam34 Z. Natkaniec25 K. Neichi37 S. Nishida17 O. Nitoh42 S. Noguchi21 T. Nozaki9 S. Ogawa36 T. Ohshima20 Y. Ohshima40 T. Okabe20 T. Okazaki21 S. Okuno15 S. L. Olsen8 H. Ozaki9 P. Pakhlov14 H. Palka25 C. S. Park33 C. W. Park16 H. Park18 L. S. Peak35 M. Peters8 L. E. Piilonen46 E. Prebys31 J. L. Rodriguez8 N. Root2 M. Rozanska25 K. Rybicki25 J. Ryuko29 H. Sagawa9 Y. Sakai9 H. Sakamoto17 M. Satapathy45 A. Satpathy9,5 S. Schrenk5 S. Semenov14 K. Senyo20 Y. Settai4 M. E. Sevior19 H. Shibuya36 B. Shwartz2 A. Sidorov2 S. Stanič44 A. Sugi20 A. Sugiyama20 K. Sumisawa9 T. Sumiyoshi9 J.-I. Suzuki9 K. Suzuki3 S. Suzuki47 S. Y. Suzuki9 S. K. Swain8 H. Tajima39 T. Takahashi28 F. Takasaki9 M. Takita29 K. Tamai9 N. Tamura27 J. Tanaka39 M. Tanaka9 G. N. Taylor19 Y. Teramoto28 M. Tomoto9 T. Tomura39 S. N. Tovey19 K. Trabelsi8 T. Tsuboyama9 T. Tsukamoto9 S. Uehara9 K. Ueno24 Y. Unno3 S. Uno9 Y. Ushiroda9 S. E. Vahsen31 K. E. Varvell35 C. C. Wang24 C. H. Wang23 J. G. Wang46 M.-Z. Wang24 Y. Watanabe40 E. Won33 B. D. Yabsley9 Y. Yamada9 M. Yamaga38 A. Yamaguchi38 H. Yamamoto8 T. Yamanaka29 Y. Yamashita26 M. Yamauchi9 S. Yanaka40 J. Yashima9 M. Yokoyama39 K. Yoshida20 Y. Yusa38 H. Yuta1 C. C. Zhang12 J. Zhang44 H. W. Zhao9 Y. Zheng8 V. Zhilich2 and
D. Žontar44 Belle Collaboration1Aomori University, Aomori
2Budker Institute of Nuclear Physics, Novosibirsk
3Chiba University, Chiba
4Chuo University, Tokyo
5University of Cincinnati, Cincinnati OH
6University of Frankfurt, Frankfurt
7Gyeongsang National University, Chinju
8University of Hawaii, Honolulu HI
9High Energy Accelerator Research Organization (KEK), Tsukuba
10Hiroshima Institute of Technology, Hiroshima
11Institute for Cosmic Ray Research, University of Tokyo, Tokyo
12Institute of High Energy Physics, Chinese Academy of Sciences,
Beijing
13Institute of High Energy Physics, Vienna
14Institute for Theoretical and Experimental Physics, Moscow
15Kanagawa University, Yokohama
16Korea University, Seoul
17Kyoto University, Kyoto
18Kyungpook National University, Taegu
19University of Melbourne, Victoria
20Nagoya University, Nagoya
21Nara Women’s University, Nara
22National Kaohsiung Normal University, Kaohsiung
23National Lien-Ho Institute of Technology, Miao Li
24National Taiwan University, Taipei
25H. Niewodniczanski Institute of Nuclear Physics, Krakow
26Nihon Dental College, Niigata
27Niigata University, Niigata
28Osaka City University, Osaka
29Osaka University, Osaka
30Panjab University, Chandigarh
31Princeton University, Princeton NJ
32Saga University, Saga
33Seoul National University, Seoul
34Sungkyunkwan University, Suwon
35University of Sydney, Sydney NSW
36Toho University, Funabashi
37Tohoku Gakuin University, Tagajo
38Tohoku University, Sendai
39University of Tokyo, Tokyo
40Tokyo Institute of Technology, Tokyo
41Tokyo Metropolitan University, Tokyo
42Tokyo University of Agriculture and Technology, Tokyo
43Toyama National College of Maritime Technology, Toyama
44University of Tsukuba, Tsukuba
45Utkal University, Bhubaneswer
46Virginia Polytechnic Institute and State University, Blacksburg VA
47Yokkaichi University, Yokkaichi
48Yonsei University, Seoul
Abstract
We present a measurement of the
Standard Model violation parameter
based on
a data sample collected at the resonance
with the Belle detector at the KEKB asymmetric-energy collider.
One neutral meson
is fully reconstructed as a
, , , ,
or
decay and
the flavor of the accompanying meson is identified
from its
decay products.
From the asymmetry in the
distribution of the time intervals between the two meson decay points,
we determine
We conclude that we have observed
violation in the neutral meson system.
Kobayashi and Maskawa (KM) proposed, in 1973, a model
where violation is
incorporated as an irreducible complex phase in the
weak-interaction quark mixing matrix [1].
The idea, which was presented at a time when only the , and
quarks were known to exist, was remarkable because
it required the existence of six quarks.
The subsequent
discoveries of the , and quarks, and the compatibility
of the model with the violation observed in the neutral meson
system led to the incorporation of the KM mechanism into the Standard Model,
even though it had not been conclusively tested
experimentally.
In 1981, Sanda, Bigi and Carter [2] pointed out that the KM
model predicted large violation in
certain decays of mesons for a range of quark mixing
parameters. Subsequent measurements of the meson lifetime [3]
and the discovery of mixing [4]
indicated that the parameters lie within such a range.
Thus, measurements of
violation in meson decays provide important tests of the KM model.
The model predicts
a violating asymmetry in the time-dependent
rates for initial and
decays to a common eigenstate, [2].
In the case where , the asymmetry
is given by
where
is the decay rate
for
to at a proper time after production,
is the -eigenvalue of ,
is the mass difference
between the two mass eigenstates, and
is one of the three internal
angles of the Unitarity Triangle, defined as
[5].
For the ( decays, both the ambiguity
due to strong interactions and the contribution from direct
violation are expected to be small [5].
Our previous determination, using a data sample taken in
1999-2000,
found
[6],
which is consistent with the KM model constraints
from indirect measurements [7].
Although the combination of this result with other
measurements of
[8] strongly
indicates violation of symmetry in meson decays,
the published results are still not conclusive.
In this Letter we report a new measurement of
that uses improved reconstruction
algorithms and incorporates data taken in 2001
to achieve a
four-fold increase in the size of the event sample.
The result reported here includes the earlier data
and supersedes the previous value. All data samples have been
analyzed and reconstructed with the same consistent
procedure.
We use a data sample,
which contains 31.3 million pairs,
collected with
the Belle detector at the KEKB asymmetric-energy
(3.5 on 8 GeV) collider [9].
KEKB operates at the resonance
( GeV) with
a peak luminosity that exceeds
.
The Belle detector is a large-solid-angle magnetic
spectrometer that
consists of a three-layer silicon vertex detector (SVD),
a 50-layer central drift chamber (CDC), a mosaic of
aerogel threshold Čerenkov counters (ACC), time-of-flight
scintillation counters (TOF), and an array of CsI(Tl) crystals
(ECL) located inside
a superconducting solenoid coil that provides a 1.5 T
magnetic field. An iron flux-return located outside of
the coil is instrumented to detect mesons and to identify
muons (KLM). The detector
is described in detail elsewhere [10].
We measure
using meson pairs
produced at the resonance.
The two mesons remain in a coherent
-wave state until one of them decays.
The decay of one of the mesons at time
to a final state, , which distinguishes between
and , projects the accompanying meson
onto the opposite -flavor at ; this meson
decays to at time .
violation manifests itself as an asymmetry
,
where is the proper time interval .
At KEKB, the is produced
with a Lorentz boost of nearly along
the electron beamline ().
Since the and mesons are nearly at
rest in the center of mass system (cms),
can be determined from the displacement in
between the and decay vertices—i.e.
.
The measurement requires the reconstruction of
decays, the determination of the -flavor of the accompanying (tagging)
meson, the measurement of ,
and a fit of the expected distribution to
the measured distribution using a likelihood method.
We reconstruct decays to the following eigenstates [11]:
, , , for and
for .
We also use decays where
.
Here the final state is a mixture of even
and odd , depending on the relative orbital angular momentum of the
and .
The content is determined from a fit to the full angular
distribution of all decay modes other
than .
We find that the final state is primarily ;
the fraction is [12].
and mesons are reconstructed via their decays to
.
The is also reconstructed via ,
and the via . The
is detected in the and
modes.
For the mode, we use and
decays; for other modes we only use .
The , and selection has been
described elsewhere [6].
For decays, we select
decays, rejecting ’s that are
consistent with
decays, and use the requirement
.
For decays, we distinguish kaons from pions
using a combination of CDC energy loss measurements, flight times
measured in the TOF, and the response of the ACC.
Candidate
decays are selected
with a mass requirement that
takes into account the natural width of the .
For decays, we use combinations
that have an invariant mass
within 75 MeV/ of the nominal mass.
We reduce background from low-momentum ’s by
requiring , where is
the angle between the momentum vector
and the flight direction calculated in the rest frame.
We identify
decays using
the energy difference
and the beam-energy constrained
mass ,
where is the cms beam energy,
and and are the cms energy and momentum
of the candidate.
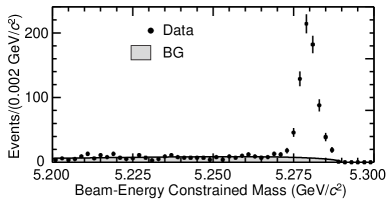
Figure 1 shows the combined
distribution for
all channels other than after
a mode-dependent requirement on .
The meson signal region is defined as
.
Table I lists
the numbers of observed candidates () and
the background () determined by
extrapolating the rate in the
non-signal vs. region
into the signal region.
Candidate decays are selected by requiring
ECL and/or KLM hit patterns that are consistent with the
presence of
a shower induced by a neutral hadron.
The centroid of the shower is required to be in a 45∘ cone
centered on the direction that is inferred from two-body decay
kinematics and the measured four-momentum of the .
We reduce the background by means of a likelihood ratio
that depends on the cms momentum,
the angle between the and its nearest-neighbor charged track,
the charged track multiplicity of the event, the extent to which the event is
consistent with a hypothesis,
and the polar angle with respect to the direction
of the reconstructed meson in the cms.
In addition, we remove events that are reconstructed as
, ,
, or ,
decays. Finally, clusters with positions that match photons
from reconstructed ’s are also rejected.
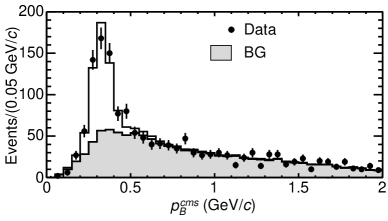
Figure 2 shows the distribution,
calculated with the two-body decay hypothesis.
The histograms are the results of a fit to the signal
and background distributions. The shapes are
derived from Monte Carlo simulations (MC) [13],
and the normalization and peak position of the signal
are allowed to vary.
There are 397 entries in the
signal region with KLM clusters.
There are 172 entries in the
range with clusters in the ECL only.
The fit finds a total of signal events,
and a signal purity of 61%.
Leptons, charged pions, and kaons
that are not associated with a reconstructed
eigenstate decay are used to identify
the flavor of the accompanying meson.
Initially,
the -flavor determination is performed at the track level.
Several categories of well measured tracks
that distinguish the -flavor by the track’s charge are selected:
high momentum leptons
from ,
lower momentum leptons from ,
charged kaons and baryons from ,
high momentum pions that originate from decays of the type
, , and
slow pions from .
We use the MC to determine a category-dependent variable
that indicates whether
a track originates from a or .
The values of this variable range from
for a reliably identified
to for a reliably identified and depend
on the tagging particle’s charge,
cms momentum, polar angle and
particle-identification probability, as well as other kinematic and
event shape quantities.
The results from the separate
track categories are then combined to
take into account correlations
in the case of multiple track-level tags.
This stage determines two event-level parameters, and .
The first, , has the discrete values when the tag-side meson
is more likely to be a and when it is more likely to be a
.
The parameter is an event-by-event flavor-tagging dilution factor which
ranges from for no flavor discrimination to for
unambiguous flavor assignment.
It is used only to sort data into six intervals of , according to
flavor purity;
the wrong-tag probabilities for the final fit are determined from data.
The probabilities of an
incorrect flavor assignment, ,
are determined directly from the data for the six intervals
using exclusively reconstructed, self-tagged
, ,
and decays.
The -flavor of the accompanying meson
is assigned according to the flavor-tagging algorithm described above.
The exclusive decay and tag vertices are reconstructed
using the same vertexing algorithm that is used in
the analysis to measure asymmetry.
The values of
are obtained from the amplitudes of the
time-dependent mixing oscillations:
.
Here and are the numbers of opposite and same
flavor events.
We fix at the world average value [14].
Table II lists the resulting values
together with the fraction of the events ()
in each interval.
The total effective tagging efficiency is
.
The vertex positions for the and decays are
reconstructed using tracks
that have at least one
three-dimensional coordinate determined from
associated - and
hits in the same SVD layer
along with one or more additional hits in the other layers.
Each vertex position is required to be
consistent with the interaction point profile smeared in the
- plane by the meson decay length.
The vertex is determined using
lepton tracks from
or decays, or prompt tracks from decays.
The vertex
is determined from well reconstructed tracks not assigned to .
Tracks that form a are not used.
The MC indicates that the typical vertex-finding efficiency and
vertex resolution (rms) for () are
and , respectively.
The proper-time interval resolution for the signal, ,
is obtained by convolving a sum of
two Gaussians (a main component
due to the SVD vertex resolution and charmed meson lifetimes,
plus a tail component caused by poorly reconstructed tracks)
with a function that takes into account
the cms motion of the mesons.
The fraction in the main Gaussian
is determined to be from a
study of , , ,
, and
, events.
The means
(, )
and widths
(, )
of the Gaussians are
calculated event-by-event from the
and vertex fit error matrices
and the values of the fit;
typical values are ,
and
, .
The background resolution has the same functional
form but the parameters are obtained from a sideband region
in and .
We obtain lifetimes for the neutral and charged mesons
using the same procedure;
the results [15] agree well with the world average values.
After vertexing we find 560 events with flavor tags and
577 events with .
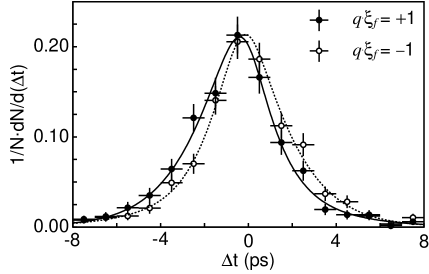
Figure 3 shows the
observed distributions
for the
(solid points) and
(open points) event samples.
There is a clear asymmetry between the two distributions; this
demonstrates that symmetry is violated.
We determine
by performing an
unbinned maximum-likelihood fit of a violating
probability density function (pdf) to the observed distributions.
For modes other than
the pdf expected for the signal is
where we fix and at their world average
values [14].
The pdf used for the background distribution is
where is the fraction of the background component
with an effective lifetime and is the Dirac delta
function.
For all modes other than ,
a study using events in background-dominated
regions of vs. shows
that is negligibly small.
For these modes,
.
The background is dominated
by decays where
some final states are eigenstates.
We estimate the fractions of the background components with and
without
a true cluster by fitting the distribution
to the expected
shapes determined from the MC. We also use the MC
to determine the fraction of events with
definite content within each
component.
The result is a background that is 71% non- modes
with .
For the -mode backgrounds we use the signal pdf given
above with the appropriate values.
For , which is of the background,
we use the content determined from
the full sample.
The remaining backgrounds are
states () including ,
and states () including
, and .
For the mode, we include
the and
transversity angle [16]
distributions in the likelihood [12].
We use the content
determined from the full angular analysis.
Each pdf is convolved with the appropriate to determine
the likelihood value for each event as a function of :
where is the probability that the event is signal,
calculated as a function of for and
of and for other modes.
The only free parameter is , which is
determined by maximizing
the likelihood function
, where the product is over all
events.
The result of the fit is
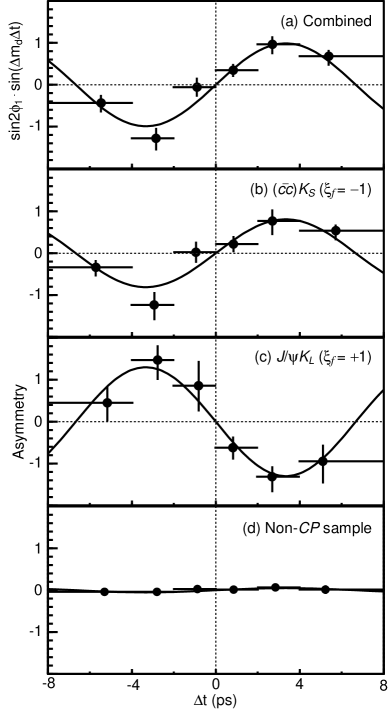
In Fig. 4(a) we show the
asymmetries for the combined data sample
that are obtained by applying the fit to the events in each
bin separately. The smooth curve is the result
of the global unbinned fit.
Figures 4(b) and (c) show the
corresponding asymmetries
for the ()
and the () modes separately.
The observed
asymmetries for the different states are opposite,
as expected.
The curves are the results of unbinned fits
applied separately to the two samples; the resultant
values are
(stat) and (stat), respectively.
The systematic error is dominated by
uncertainties due to effects of the tails of the vertex
distributions, which contribute .
Other significant contributions come from uncertainties (a) in ;
(b) in the resolution function parameters (); and
(c) in the background fraction ().
The errors introduced by uncertainties in
and
are or less.
We performed a number of checks on the measurement.
Table III lists the results obtained by applying the
same analysis to various subsamples.
All values are statistically consistent with each other.
The result is unchanged if we use the ’s determined
separately for and .
Fitting
to the non- eigenstate self-tagged modes
, , and ,
where no asymmetry is expected,
yields . The asymmetry distribution for
this control sample is shown in Fig. 4(d).
As a further check, we used three independent fitting programs and
two different algorithms for the vertexing and found
no discrepancy.
We conclude that there is large
violation in the neutral meson system.
A zero value for
is ruled out at a level greater than .
Our result is consistent
with the higher range of values allowed
by the constraints of the KM model as well as with our previous
measurement.
We wish to thank the KEKB accelerator group
for the excellent
operation of the KEKB accelerator.
We acknowledge support from the Ministry of Education, Culture, Sports, Science and
Technology of Japan and
the Japan Society for the Promotion of Science;
the Australian Research Council and the Australian Department of Industry,
Science and Resources;
the Department of Science and Technology of India;
the BK21 program of the Ministry of Education of Korea and
the Center for High Energy Physics sponsored by the KOSEF;
the Polish State Committee for Scientific Research
under contract No.2P03B 17017;
the Ministry of Science and Technology of Russian Federation;
the National Science Council and the Ministry of Education of Taiwan;
and the U.S. Department of Energy.
REFERENCES
[1]
M. Kobayashi and T. Maskawa, Prog. Theor. Phys. 49, 652 (1973).
[2]
A.B. Carter and A.I. Sanda, Phys. Rev. D23, 1567 (1981);
I.I. Bigi and A.I. Sanda, Nucl. Phys. B193, 85 (1981).
[3]
E. Fernandez et al. (MAC Collab.), Phys. Rev. Lett. 51,
1022 (1983); N. Lockyer et al. (Mark II Collab.),
Phys. Rev. Lett. 51, 1316 (1983).
[4] H. Albrecht et al. (ARGUS Collab.),
Phys. Lett. B192, 245 (1987).
[5]
H. Quinn and A.I. Sanda, Eur. Phys. Jour. C15, 626 (2000).
(This angle is also known as .)
[6]
A. Abashian et al. (Belle Collab.), Phys. Rev. Lett. 86, 2509 (2001).
[7]
For example: M. Ciuchini et al., hep-ph/0012308, submitted
for publication to JHEP.
[8]
B. Aubert et al. (BaBar Collab.), Phys. Rev. Lett. 86, 2515
(2001) reports ;
T. Affolder et al. (CDF Collab.), Phys. Rev. D61,
072005 (2000) reports ;
R. Barate et al. (ALEPH Collab.), Phys. Lett. B492, 259
(2000) reports ; and
K. Ackerstaff et al. (OPAL Collab.), Eur. Phys. Jour. C5, 379
(1998) reports .
[10]
K. Abe et al. (Belle Collab.),
The Belle Detector, KEK Report 2000-4, to be published
in Nucl. Instrum. Methods.
[11]
Throughout this Letter, whenever a mode is quoted the inclusion
of the charge conjugate mode is implied.
[12]
K. Abe et al. (Belle Collab.),
Measurements of Polarization and Asymmetry
in decays, paper submitted to LP01,
Rome, July 2001; BELLE-CONF-0105.
[13]
We use the QQ meson decay event
generator developed by the CLEO Collaboration
(http://www.lns.cornell.edu/public/CLEO/soft/QQ)
and GEANT3 for the detector simulation;
CERN Program Library Long Writeup W5013, CERN, 1993.
[14]
D.E. Groom et al. (Particle Data Group),
Eur. Phys. J. C15, 1 (2000).
[15] The measured
-lifetimes are: ps and
ps (statistical errors only).
[16]
is defined as the angle
between the direction in the rest frame and the
-axis,
where the -axis is defined as the direction of motion of the
in the
rest frame. The - plane is defined by the decay
products in the rest frame.
TABLE I.: The numbers of observed
events () and the estimated
background ()
in the signal region for each mode.
Mode
457
11.9
76
9.4
39
1.2
46
2.1
24
2.4
23
11.3
41
13.6
41
6.7
Sub-total
747
58.6
569
223
TABLE II.:
The event fractions ()
and incorrect flavor assignment probabilities ()
for each interval. The errors include both statistical
and systematic uncertainties.
1
2
3
4
5
6
TABLE III.:
The values of
for various subsamples
(statistical errors only).
Sample
()
()
except
All
FIG. 1.: The beam-energy constrained mass distribution for
all decay modes combined other than .
The shaded area is the estimated background.
The signal region is the range GeV/.FIG. 2.: The distribution for candidates
with the results of the fit.
The solid line is the signal plus background;
the shaded area is background only.
The signal region for KLM (ECL-only) clusters
is .FIG. 3.:
distributions
for the events with (solid
points) and (open points). The
results of the global fit (with )
are shown as solid and dashed curves, respectively.
FIG. 4.: (a) The asymmetry obtained
from separate fits to each bin for
the full data sample; the curve is the result of
the global fit. The
corresponding plots for the (b) (), (c)
(), and (d) control samples
are also shown. The curves
are the results of the fit applied separately to the
individual data samples.