Mixing and CP Violation in the Decay of
Neutral D Mesons at CLEO.
Abstract
We present preliminary results of several analyses searching for the effects of CP violation and mixing in the decay of mesons. We find no evidence of CP asymmetry in five different two-body decay modes of the to pairs of light pseudo-scalar mesons: , , , and . We present the first measurement of the rate of wrong-sign decay: . Finally, we describe a measurement of the mixing parameter by searching for a lifetime difference between the CP neutral final state and the CP even and final states. Under the assumption that CP is conserved we find .
D. Cronin-Hennessy,1 A.L. Lyon,1 E. H. Thorndike,1 T. E. Coan,2 V. Fadeyev,2 Y. S. Gao,2 Y. Maravin,2 I. Narsky,2 R. Stroynowski,2 J. Ye,2 T. Wlodek,2 M. Artuso,3 C. Boulahouache,3 K. Bukin,3 E. Dambasuren,3 G. Majumder,3 R. Mountain,3 S. Schuh,3 T. Skwarnicki,3 S. Stone,3 J.C. Wang,3 A. Wolf,3 J. Wu,3 S. Kopp,4 M. Kostin,4 A. H. Mahmood,5 S. E. Csorna,6 I. Danko,6 K. W. McLean,6 Z. Xu,6 R. Godang,7 G. Bonvicini,8 D. Cinabro,8 M. Dubrovin,8 S. McGee,8 G. J. Zhou,8 A. Bornheim,9 E. Lipeles,9 S. P. Pappas,9 A. Shapiro,9 W. M. Sun,9 A. J. Weinstein,9 D. E. Jaffe,10 R. Mahapatra,10 G. Masek,10 H. P. Paar,10 D. M. Asner,11 A. Eppich,11 T. S. Hill,11 R. J. Morrison,11 R. A. Briere,12 G. P. Chen,12 T. Ferguson,12 H. Vogel,12 A. Gritsan,13 J. P. Alexander,14 R. Baker,14 C. Bebek,14 B. E. Berger,14 K. Berkelman,14 F. Blanc,14 V. Boisvert,14 D. G. Cassel,14 P. S. Drell,14 J. E. Duboscq,14 K. M. Ecklund,14 R. Ehrlich,14 P. Gaidarev,14 L. Gibbons,14 B. Gittelman,14 S. W. Gray,14 D. L. Hartill,14 B. K. Heltsley,14 P. I. Hopman,14 L. Hsu,14 C. D. Jones,14 J. Kandaswamy,14 D. L. Kreinick,14 M. Lohner,14 A. Magerkurth,14 T. O. Meyer,14 N. B. Mistry,14 E. Nordberg,14 M. Palmer,14 J. R. Patterson,14 D. Peterson,14 D. Riley,14 A. Romano,14 H. Schwarthoff,14 J. G. Thayer,14 D. Urner,14 B. Valant-Spaight,14 G. Viehhauser,14 A. Warburton,14 P. Avery,15 C. Prescott,15 A. I. Rubiera,15 H. Stoeck,15 J. Yelton,15 G. Brandenburg,16 A. Ershov,16 D. Y.-J. Kim,16 R. Wilson,16 T. Bergfeld,17 B. I. Eisenstein,17 J. Ernst,17 G. E. Gladding,17 G. D. Gollin,17 R. M. Hans,17 E. Johnson,17 I. Karliner,17 M. A. Marsh,17 C. Plager,17 C. Sedlack,17 M. Selen,17 J. J. Thaler,17 J. Williams,17 K. W. Edwards,18 R. Janicek,19 P. M. Patel,19 A. J. Sadoff,20 R. Ammar,21 A. Bean,21 D. Besson,21 X. Zhao,21 S. Anderson,22 V. V. Frolov,22 Y. Kubota,22 S. J. Lee,22 J. J. O’Neill,22 R. Poling,22 A. Smith,22 C. J. Stepaniak,22 J. Urheim,22 S. Ahmed,23 M. S. Alam,23 S. B. Athar,23 L. Jian,23 L. Ling,23 M. Saleem,23 S. Timm,23 F. Wappler,23 A. Anastassov,24 E. Eckhart,24 K. K. Gan,24 C. Gwon,24 T. Hart,24 K. Honscheid,24 D. Hufnagel,24 H. Kagan,24 R. Kass,24 T. K. Pedlar,24 J. B. Thayer,24 E. von Toerne,24 M. M. Zoeller,24 S. J. Richichi,25 H. Severini,25 P. Skubic,25 A. Undrus,25 V. Savinov,26 S. Chen,27 J. Fast,27 J. W. Hinson,27 J. Lee,27 D. H. Miller,27 E. I. Shibata,27 I. P. J. Shipsey,27 and V. Pavlunin27
1University of Rochester, Rochester, New York 14627
2Southern Methodist University, Dallas, Texas 75275
3Syracuse University, Syracuse, New York 13244
4University of Texas, Austin, Texas 78712
5University of Texas - Pan American, Edinburg, Texas 78539
6Vanderbilt University, Nashville, Tennessee 37235
7Virginia Polytechnic Institute and State University, Blacksburg, Virginia 24061
8Wayne State University, Detroit, Michigan 48202
9California Institute of Technology, Pasadena, California 91125
10University of California, San Diego, La Jolla, California 92093
11University of California, Santa Barbara, California 93106
12Carnegie Mellon University, Pittsburgh, Pennsylvania 15213
13University of Colorado, Boulder, Colorado 80309-0390
14Cornell University, Ithaca, New York 14853
15University of Florida, Gainesville, Florida 32611
16Harvard University, Cambridge, Massachusetts 02138
17University of Illinois, Urbana-Champaign, Illinois 61801
18Carleton University, Ottawa, Ontario, Canada K1S 5B6
and the Institute of Particle Physics, Canada
19McGill University, Montréal, Québec, Canada H3A 2T8
and the Institute of Particle Physics, Canada
20Ithaca College, Ithaca, New York 14850
21University of Kansas, Lawrence, Kansas 66045
22University of Minnesota, Minneapolis, Minnesota 55455
23State University of New York at Albany, Albany, New York 12222
24Ohio State University, Columbus, Ohio 43210
25University of Oklahoma, Norman, Oklahoma 73019
26University of Pittsburgh, Pittsburgh, Pennsylvania 15260
27Purdue University, West Lafayette, Indiana 47907
I Introduction and Motivation
The study of mixing in the and sectors has provided a wealth of information to guide the form and content of the Standard Model. In the framework of the Standard Model, mixing in the charm meson sector is predicted to be small [1], making this an excellent place to search for non-Standard Model effects. Similarly, measurable CP violation (CPV) phenomena in strange [2, 3] and beauty [4, 5, 6] mesons are the impetus for many current and future experiments [7, 8, 9, 10]. The Standard Model predictions for CPV for charm mesons are of the order of [11], with one recent conjecture of nearly [12]. Observation of CPV in charm mesons exceeding the percent level would be strong evidence for non-Standard Model processes.
A can evolve into a through “ordinary” on-shell intermediate states, or through off-shell intermediate states such as as those that might be present due to new physics. We denote the amplitude through the former (latter) states by , in units of [13]. The Standard Model contributions to are suppressed to and the Glashow-Illiopolous-Maiani [14] cancelation could further suppress down to . Many non-Standard Model processes could lead to . Contributions to at this level could result from the presence of new particles with masses as high as 100 – 1000 TeV [15]. Signatures of new physics include and CP violating interference between and or between and a direct decay amplitude.
Wrong sign (WS) processes, such as , can proceed directly through doubly Cabbibo-suppressed decay (DCSD) or through mixing and subsequent Cabbibo favored decay (CFD). Both DCSD and mixing followed by CFD can contribute to the time integrated WS rate, and the inclusive CP asymmetry , where , is the charge conjugated quantity, and is a wrong-sign final state, such as .
The different contributions to and can be separated by studying the proper decay time dependence of WS final states, as we have done in [16], and has been done by FOCUS in [17]. The differential WS rate relative to the right-sign (RS) process, in time units of the mean lifetime, [18], is [19], where and , where is the relative rate of DCSD and is the strong phase between the DCSD and CFD amplitudes. There are theoretical arguments that should be small [20], although this should not be taken for granted. The coefficient of the term quadratic in is proportional to the relative rate of mixing, .
II General Experimental Method
All of the analyses discussed herein, unless otherwise stated, use the same data set and reconstruction techniques described below. The data set was accumulated between February 1996 and February 1999 and corresponds to of collision data at GeV provided by the Cornell Electron Storage Ring (CESR). The data were recorded by the CLEO II detector [21] upgraded with the installation of a silicon vertex detector (SVX) [22] and by changing the drift chamber gas from an argon-ethane mixture to a helium-propane mixture [23]. The upgraded configuration is referred to as CLEO II.V.
The Monte Carlo simulation of the CLEO II.V detector was based upon GEANT [24], and simulated events were processed in the same manner as the data.
The candidates are reconstructed through the decay sequence [25]. The charge of the slow pion () tags the flavor of the candidate at production. The charged daughters of the are required to leave hits in the SVX and these tracks are constrained to come from a common vertex in three dimensions. The trajectory of the is projected back to its intersection with the CESR luminous region to obtain the production point. The is refit with the requirement that it come from the production point, and the confidence level of the of this refit is used to reject background.
The energy release in the decay, , obtained from the above technique is observed to have a width of keV [26], which is a combination of the intrinsic width and our resolution, where and are the reconstructed masses of the and candidates respectively, and is the charged pion mass. The reconstruction technique discussed above has also been used by CLEO to measure the intrinsic width, keV (preliminary) [27]. In the mixing analyses described below, the distribution of candidates in the vs plane are fit to determine both right-sign and wrong-sign yields.
We calculate using only the vertical component of the candidate flight distance. This is effective because the vertical extent of the CESR luminous region has m [28]. The resolution on the decay point (, , ) is typically m in each dimension. We measure the centroid of the CESR luminous region (, , ) using () events from sets of data with integrated luminosity of several pb-1, obtaining a resolution on the centroid of less than m. We express as , where is the vertical component of the total momentum of the candidate. The error in , , is typically (in lifetimes), although when the direction is near the horizontal plane can be large.
III CP violation in decay
CP Violation in charm meson decay is expected to be small in the Standard Model, which makes charm meson decay a good place to look for non-Standard Model effects. Cabbibo suppressed charm meson decays have all the necessary ingredients for CP violation – multiple paths to the same final state and a weak phase. However, in order to get sizable CP violation, the final state interactions need to contribute non-trivial phase shifts between the amplitudes. Large final state interactions are a likely reason why the prediction for the ratio of branching ratios of yields a value roughly half of the observed value [18], hence these may provide a good hunting ground for CP violation.
Previous searches for mixing-induced [16] or direct [29, 18] CP violation in the neutral charm meson system have set limits of or a few percent, respectively. We present results of searches for direct CP violation in neutral charm meson decay to pairs of light pseudo-scalar mesons: , , , and .
A Search for CP violation in and decay
The asymmetry we want to measure,
can be obtained from the asymmetry
The slow pion and are produced by the CP-conserving strong decay of the , so the slow pion serves as an unbiased flavor tag of the . The decay asymmetry can be obtained from the apparent production asymmetry shown above because the production of is CP-conserving.
The asymmetry result is obtained by fitting the energy release () spectrum of the events. The mass spectra are fit as a check. The background-subtracted spectrum is fit with a signal shape obtained from data and a background shape determined using Monte Carlo. Figure 1 shows our fits to both and distributions found in data, for both signs of the slow pion flavor tag.
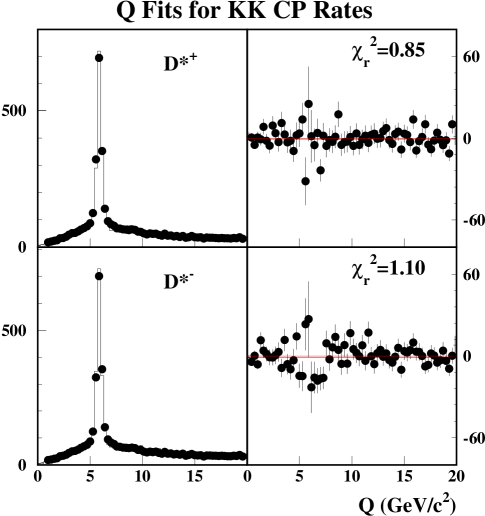
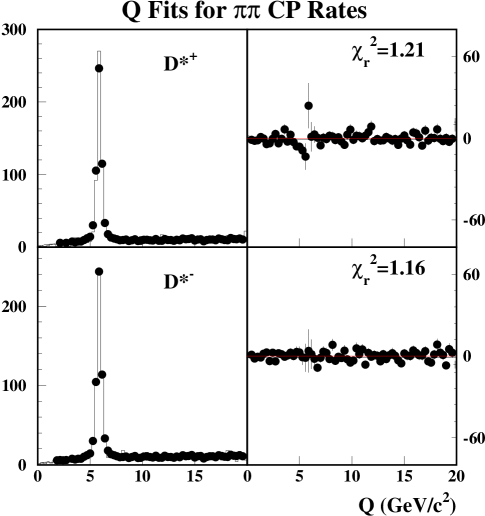
The parameters of the slow pion dominate the distribution, so all modes have the same shape. We do the fits in bins of momentum to eliminate any biases due to differences in the momentum spectra between the data and the MC. The preliminary results are and .
We use many different variations of the fit shapes, both empirical and analytical, to assess the systematic uncertainties due to the fitting procedure (0.69%). We also consider biases due to the detector material (0.07%), the reconstruction software (0.48%), and forward–backward acceptance variations ( pairs are not produced symmetrically in the forward/backward directions in collisions at GeV, and the collision point was not centered exactly in the middle of the detector) (0.014%).
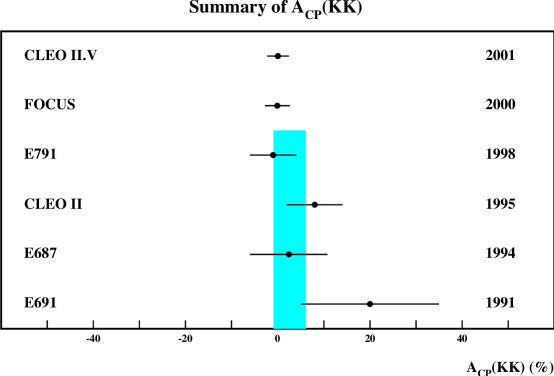
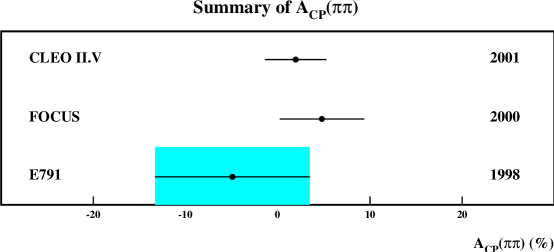
The measured asymmetries are consistent with zero, and no CP violation is seen. These results compared to previous measurements [29, 30] are shown in Figures 2 and 3.
B Search for CP Violation in , and decay
This analysis [31] differs from the other analyses presented in this paper in some of its reconstruction techniques and in the data set used. The and final states do not provide sufficiently precise directional information about their parent to use the intersection of the projection and the CESR luminous region to refit the slow pion as described in the general experimental technique section. The final state is treated the same for consistency. This analysis uses the data from both the CLEO II and CLEO II.V configurations of the detector, totaling 13.7 of collision data at GeV.
The and candidates are constructed using only good quality tracks and showers. The tracks (showers) whose combined invariant mass is close to the () mass are kinematically constrained to the () mass, improving the mass resolution. The tracks used to form candidates are required to satisfy criteria designed to reduce background from decays and combinatorics. Candidate events with reconstructed masses close to the known mass are selected to determine the asymmetry, . The distributions of the candidates in the three decay modes are shown in Figures 4, 5, and 6. A prominent peak indicative of decay is observed in all three distributions.
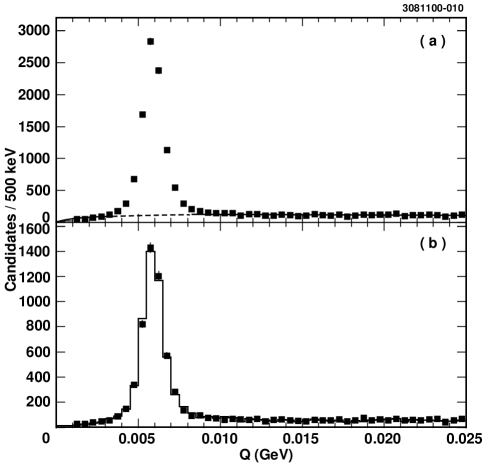
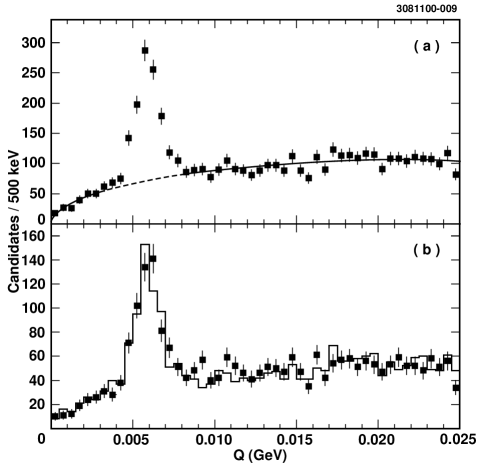
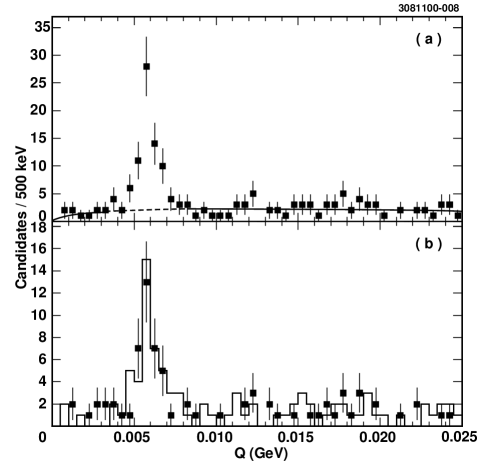
The total number of and candidates for a given final state is determined as follows. We fit the distribution outside of the signal region and interpolate the fit under the signal peak to determine the background in the signal region. We subtract the background in the signal region from the total number of events there to determine the total number of signal events. The background shape is approximated as a non-relativistic threshold function with first and second order relativistic corrections .
After background subtraction, we obtain candidates, candidates, and candidates.
The difference in the number of and to a given final state is determined by taking the difference of the number of events in the signal region, and the asymmetry is obtained by dividing by the number of candidates determined above. This method of determining the asymmetry implicitly assumes that the background is symmetric.
We have searched for any sources of false asymmetries: from the finding (0.19%), from the fitting (0.5%), and from the backgrounds (0.35% , 0% and 12% ). We find no significant biases, but apply the measured corrections and add their uncertainties to the total. We obtain the results , and where the uncertainties contain the combined statistical and systematic uncertainties. All systematic uncertainties, except for the 0.5% uncertainty assigned for possible bias in the fitting method, are determined from data and would be reduced in future higher luminosity samples.
All measured asymmetries are consistent with zero and no indication of significant CP violation is observed. This measurement of is a significant improvement over previous results, and the other two asymmetries reported are first measurements.
IV First Observation of Wrong-Sign Decay
candidates are reconstructed using the selection criteria described in Section II, with additional requirements specific to this analysis. In particular, candidates with momenta greater than 340 MV/ are reconstructed from pairs of photons detected in the CsI crystal calorimeter. Backgrounds are reduced by requiring specific ionization of the pion and kaon candidates to be consistent with their respective hypotheses.
The RS mode was recently studied by CLEO[32] and found to have a rich Dalitz structure consisting of , , , , , , and resonances and non-resonant contributions. Recent theoretical predictions based on U-spin symmetry arguments[33] suggest that the wrong sign (WS) channel will have a different resonant substructure than the right sign (RS). This analysis allows for different average WS and RS efficiencies resulting from different WS and RS kinematic distributions in the calculation of the WS rate:
| (1) |
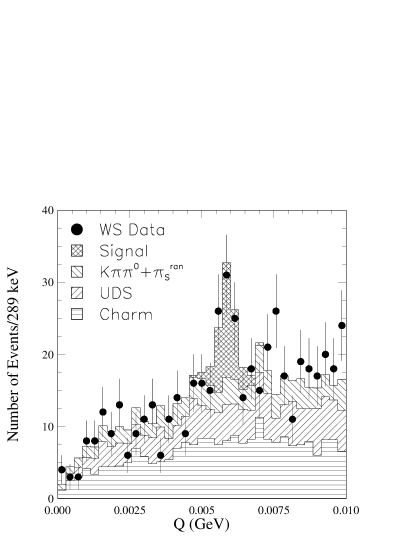
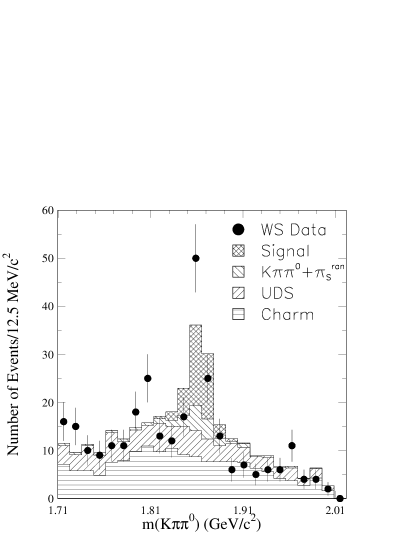
The ratio of yields in Eq. (1) is measured by performing a maximum likelihood fit to the two-dimensional distribution in and . The signal distribution in these variables is taken from the RS data. The backgrounds are broken down into three categories: 1) RS decay combined with an uncorrelated , 2) combinations from , , and , and 3) combinations from charm particle decays other than the RS or WS signal modes. The background distributions are determined using a large Monte Carlo sample, which corresponds to approximately eight times the integrated luminosity of the data sample. The – fit yields a WS signal of events and a ratio . Projections of the data and fit results in slices through the signal region in each variable are shown in Fig. 7. The statistical significance of this signal is found to be 4.9 standard deviations.
The average efficiency ratio in Eq. (1) is determined using a fit to the Dalitz plot variables and in the WS data. In this fit, the amplitudes and phases are initialized to the RS values, and those corresponding to the and resonances are floated relative to the dominant and other minor contributions. Combining the square of the fitted amplitude function with a parameterization of the efficiency determined using a large non-resonant Monte Carlo sample, we measure an average efficiency ratio of . Studies are under way to examine the extent and the significance of this surprising similarity between the RS and WS Dalitz plots.
The dominant systematic errors in this analysis come from the uncertainty in the Monte Carlo background distributions (14%), uncertainty in the amplitudes and phases that are fixed in the fit (8%), and uncertainty in the background Dalitz plot distributions (3%).
Several powerful checks of the – and Dalitz plot fits are performed in order to verify the validity of these results. Fits using specific background regions of the – plane test the sensitivity to the Monte Carlo background distributions. The WS Dalitz plot is also fit using hypotheses which include one of the , , or resonances, in order to provide an upper limit on the error due to this fit. Only the hypothesis leads to an efficiency ratio that differs significantly from one, but this hypothesis is strongly disfavored by the data.
We measure the wrong sign rate to be
| (2) |
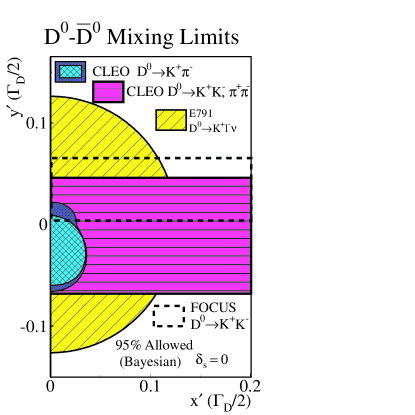
This result is consistent with the CLEO II.V[16] and FOCUS [17] measurements. This measurement of can be used to obtain limits on as a function of within the limits on set by CLEO, as shown in Figure 8. Work is in progress to use the lifetime distribution of this sample to yield independent limits on , , and .

V Search for dependent lifetime differences due to Mixing
In the limit of no violation in the neutral system we can write the time dependent rate for , where is a CP eigenstate, as
| (3) |
where is the average width, is the eigenvalue for , and
| (4) |
where is the width difference between the physical eigenstates of the neutral . In the limit that CP is conserved in charm decays, , where is the mixing parameter defined in Section I. With the asymmetry for and consistent with zero as discussed in Section III, this limit is well motivated and we will simply use for the rest of this section. We can then express as
| (5) |
where is the lifetime of a neutral state, such as , and is the lifetime of a even state, such as and . Thus to measure we simply take the ratio of the lifetimes of to and . Since the final states are very similar, our backgrounds are small and cross-feed among the final states is negligible many of the sources of uncertainty cancel in the ratio. A similar analysis has recently been published by FOCUS comparing the and final states[35].
The left-most plots in Figures 9, 10, and 11 show the candidate masses for the three samples selected as described in Section II. Selecting events in a narrow region around the mass, we fit their proper time distributions with an unbinned maximum likelihood fit. The proper time is measured as described in Section II.
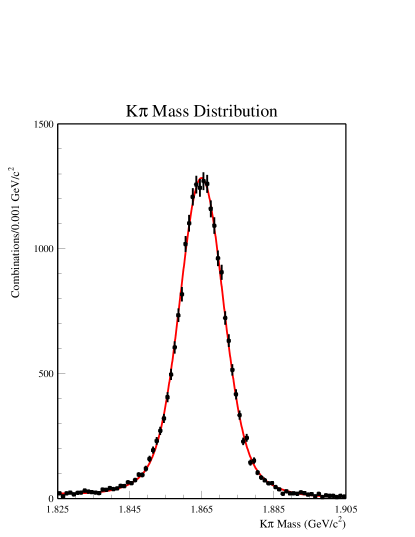
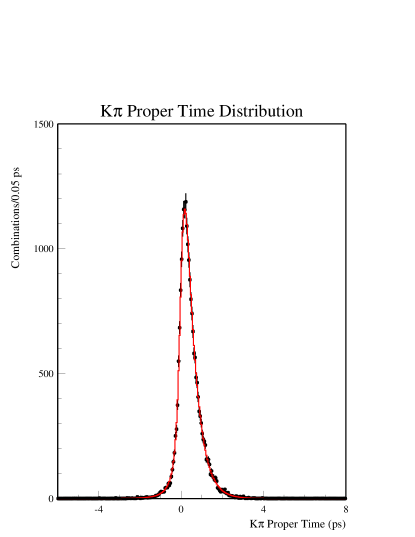
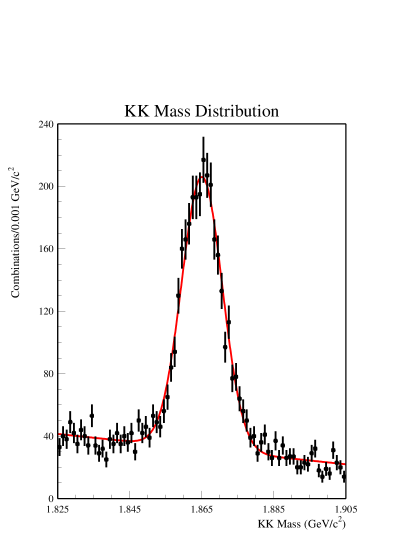

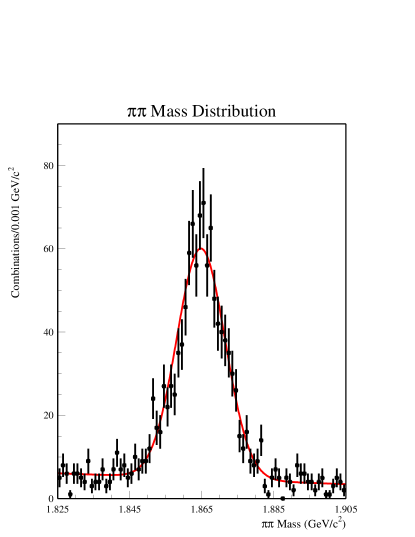
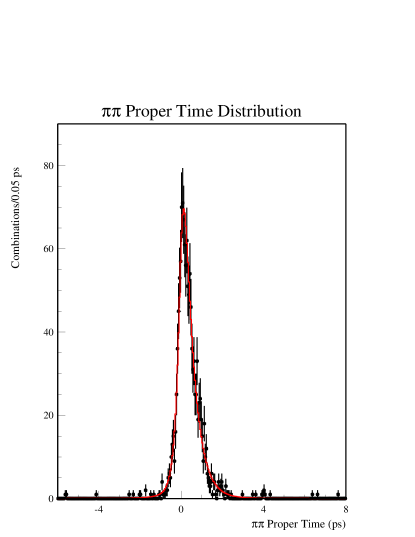
The signal likelihood function is an exponential convolved with three resolution Gaussians. The width of the primary Gaussian is due to the propagation of errors from the track fit to the flight distance and momentum for each candidate. The second and third Gaussians represent candidates that have been mismeasured by the addition of spurious tracking hits or due to hard non-Gaussian scatters in the material of the detector. The first of these has its width determined in the fit to the copious sample while the second is fixed to a large value, 8 ps. The relative contribution of the two mismeasured signal resolutions is determined using the data sample and fixed for the and samples. According to our simulation, the fraction of the second Gaussian is about 4% of the well measured signal and the third Gaussian is less than 0.1% of the signal. The probability for a candidate to be signal is determined by its measured mass, and is based on the fit to the mass distributions.
Background is considered to have contributions with both zero and non-zero lifetimes. All parameters that describe the background are allowed to float in the fits except for the width of the widest Gaussian which is fixed to 8 ps.
The right-most plots in Figures 9, 10, and 11 show the lifetime fits to the three samples and the results are summarized in Table I.
| Parameter | |||
|---|---|---|---|
| Number of Signal | |||
| (ps) | |||
| Background Frac (%) | |||
| Background Life Frac (%) | |||
| (ps) | |||
| % | Fixed | Fixed | |
| (ps) | Fixed | Fixed |
Note that the background in all the samples has a large component that has a lifetime consistent with the lifetime. This agrees with the prediction of our simulation that the background with lifetime is dominated by misreconstructed fragments of charm decays.
We calculate separately for the and samples. Systematic uncertainties are dominated by the statistical uncertainty in a Monte Carlo study used to determine small corrections, consistent with zero, that are applied to the measured result to account for differences between measured and generated values of the lifetimes (). Additional significant systematic uncertainties come from variations in description of the background (), uncertainties in our model of the proper time resolution (), and details of the fit procedure (), where the listed values are the contribution to the average result. Our preliminary results are
| (6) |
and
| (7) |
We form a weighted average of the two to get
| (8) |
This result is consistent with zero. It is also consistent with our previous result from wrong sign [16], the FOCUS results from wrong sign [17], and the FOCUS results from versus [35]. This result is shown along with some of the previous measurements in Figure 12.
VI Summary
We present preliminary results of several analyses searching for the effects of CP violation and mixing in the decay of mesons. We find no evidence of CP asymmetry in five different two-body decay modes of the to pairs of light pseudo-scalar mesons: , , , and . We present the first measurement of the rate of wrong-sign decay: . Finally, we describe a measurement of the mixing parameter by searching for a lifetime difference between the CP neutral and the CP even and final states. Under the assumption that CP is conserved we find .
VII Acknowledgments
We gratefully acknowledge the effort of the CESR staff in providing us with excellent luminosity and running conditions. M. Selen thanks the PFF program of the NSF and the Research Corporation, and A.H. Mahmood thanks the Texas Advanced Research Program. This work was supported by the National Science Foundation, the U.S. Department of Energy, and the Natural Sciences and Engineering Research Council of Canada.
REFERENCES
- [1] H.N. Nelson, hep-ex/9908021.
- [2] KTeV Collaboration, A. Alavi-Harati et al., Phys. Rev. Lett. 83, 22 (1999).
- [3] NA48 Collaboration, V. Fanti et al., Phys. Lett. B 465, 335 (1999).
- [4] BaBar Collaboration, B. Aubert et al., “A study of time- dependent CP-asymmetries in and decays”, BABAR-CONF-00/01, SLAC-PUB-8640, hep-ex/0008048.
- [5] Belle Collaboration, H. Aihara, “A measurement of CP violation in meson decays with Belle”, To be published in the proceedings of the 30th International Conference on High-Energy Physics (ICHEP 2000), Osaka, Japan, 27 Jul-2 Aug 2000, hep-ex/0010008.
- [6] CDF Collaboration, F. Abe et al., Phys. Rev. Lett. 81, 5513 (1998); T. Affolder et al. (CDF Collaboration), Phys. Rev. D 61, 072005 (2000).
- [7] I.-H. Chiang et al., AGS Experiment Proposal 926 (1996).
- [8] KAMI Collaboration, E. Cheu et al., “An expression of interest to detect and measure the direct CP violating decay and other rare decays at Fermilab using the Main Injector”, 22 September 1997, hep-ex/9709026.
- [9] “Proposal for an Experiment to Measure Mixing, CP Violation and Rare Decays in Charm and Beauty Particle Decays at the Fermilab Collider -BTeV”, 15 may 2000, http://www-btev.fnal.gov/ public_documents/btev_proposal/.
- [10] LHCb Collaboration, “Technical Proposal A Large Hadron Collider Beauty Experiment for Precision Measurements of CP Violation and Rare Decays”, Printed at CERN, Geneva, Switzerland, ISBN 92-9083-123-5.
- [11] F. Bucella et al., Phys. Rev. D 51, 3478 (1995).
- [12] I.I. Bigi, “Flavor dynamics - central mysteries of the Standard Model”, To be published in the Proceedings of the 30th International Conference on High-Energy Physics (ICHEP 2000), Osaka, Japan, 27 Jul - 2 Aug 2000, hep-ex/0009021.
- [13] T.D. Lee, R. Oehme, and C.N. Yang, Phys. Rev. 106, 340 (1957); A. Pais and S.B. Treiman, Phys. Rev. D 12, 2744 (1975). Our and are in terms of mixing amplitudes, while Pais and Treiman use the eigenvalues of the mixing Hamiltonian; both definitions agree in the limit of CP conservation. In our convention, implies the real intermediate states with CP , such as , make the larger contribution to .
- [14] S.L. Glashow, J. Illiopolous, and L. Maiani, Phys. Rev. D 2, 1285 (1970).
- [15] M. Leurer, Y. Nir, and N. Seiberg, Nucl. Phys. B 420, 468 (1994); N. Arkani-Hamed et al., hep-ph/9909326.
- [16] CLEO Collaboration, R. Godang et al., Phys. Rev. Lett. 84, 5038 (2000). , 95% CL and .
- [17] FOCUS Collaboration, J.M. Link et al., hep-ex/0012048.
- [18] C. Caso et al. (Particle Data Group), Eur. Phys. J. C 3, 1 (1998).
- [19] S.B. Treiman and R.G. Sachs, Phys. Rev. 103, 1545 (1956).
- [20] L. Wolfenstein, Phys. Rev. Lett. 75, 2460 (1995); T.E. Browder and S. Pakvasa, Phys. Lett. B 383, 475 (1996); A.F. Falk, Y. Nir, and A.A. Petrov, J. High Energy Phys. 9912, 019 (1999).
- [21] Y. Kubota et al., Nucl. Instrum. Methods Phys. Res. A 320, 66 (1992).
- [22] T.S. Hill, Nucl. Instrum. Methods Phys. Res. A 418, 32 (1998).
- [23] D. Peterson, Nucl. Phys. B (Proc. Suppl.) 54B, 31 (1997).
- [24] R. Brun et al., GEANT3 Users Guide, CERN DD/EE/84-1.
- [25] Charge conjugation is implied throughout, except where the charge conjugate states are explicitly shown, such as in an asymmetry definition.
- [26] This result is for the mode. Other modes have similar widths since the uncertainty on the slow pion dominates the width of the distribution.
- [27] First Measurement of , CLEO-CONF 01-02.
- [28] D. Cinabro et al., Phys. Rev. E 57, 1193 (1998).
- [29] CLEO Collaboration, J. Bartelt et al., Phys. Rev. D 52, 4860 (1995).
- [30] FOCUS Collaboration, J.M Link et al., Phys. Lett. B 491, 232 (2000); Erratum-ibid. 495, 443 (200); E791 Collaboration, E.M. Aitala et al., Phys. Lett. B 421, 405 (1998); E687 Collaboration, P.L. Frabetti et al. , Phys. Rev. D 50, 2953 (1994); E691 Collaboration, J.C. Anjos et al., Phys. Rev. D 44, 3371 (1991).
- [31] CLEO Collaboration, G. Bonvicini et al., to be published in Phys. Rev. D Rap. Comm., CLNS 00/1708, hep-ex/0012054.
- [32] CLEO Collaboration, S. Kopp et al., hep-ex/0011065, submitted to Phys. Rev. D, November 2000.
- [33] M. Gronau, J. L. Rosner, hep-ph/0010237 (2000), submitted to Phys. Lett. B.
- [34] CLEO Collaboration, G. Bonvicini et al., Phys. Rev. Lett. 82, 4586 (1999).
- [35] FOCUS Collaboration, J.M. Link et al., Phys. Lett. B 485, 62 (2000).