Using 15.1 of data collected by CMD-2
in the -meson energy range, the branching ratio of the conversion
decay has been measured for the first time:
1 Introduction
Conversion decays of a vector meson into a pseudoscalar meson
and a lepton pair (,
where ) are closely related to the corresponding radiative
decays of into and a photon ().
In conversion decays a squared invariant mass of a lepton pair
or a squared mass of the virtual radiated
photon is not equal to zero as for usual radiative decays.
By studying spectra one can determine a
so called transition form factor of
pseudoscalar mesons as a function of .
Various theoretical models, from standard vector meson dominance
(VMD) to calculations on the lattice, predict the transition form factor
and the resulting branching ratio of the decay
[1, 2, 3, 4].
Precise values of the branching ratios of conversion decays are
also important while studying the yield of direct
lepton pairs in heavy ion collisions. As it was noted long ago,
an observation of the anomalously large yield could
indicate the existence of the quark-gluon plasma [5].
In general, both the yield of dileptons and their mass spectra are
of interest while studying the change of the meson properties
in medium [6].
Recent experiments studying dileptons in heavy ion collisions at
CERN reported on an excess of the number of [7]
and pairs [8] over the expectations from usual
hadron decays (, ,
, ,
,
as well as similar decays into muon pairs). Its explanation requires
the accurate calculation of the production rate of pseudoscalar and
vector mesons as well as good knowledge of both the invariant mass
spectra and the branching ratios of their decays into lepton pairs.
The experimental information on such decays is rather scarce [9].
While for the meson both possible decays into were
observed, [10] and
[11],
only few events of the decay were
detected [12].
A large data sample of the mesons collected by two detectors
at VEPP-2M allowed reliable detection of the decay mode
by both CMD-2 [13] and SND [14]
groups. CMD-2 has also reported on the first observation of the
decay [13].
This work is devoted to the determination of the branching ratio for the
conversion decay using the complete data sample available at
CMD-2.
2 Experiment
The general purpose detector CMD-2 installed at the
collider VEPP-2M [15] has been described in
detail elsewhere [16].
It consists of a cylindrical drift chamber (DC) and double-layer
multi-wire proportional Z-chamber, both also used for the trigger, and
both inside a thin (0.38 ) superconducting solenoid with a field
of 1T.
The momentum resolution of the DC is equal to
.
The accuracy in the measurement of polar and azimuthal angles is
and radians respectively.
The barrel calorimeter with a thickness of 8.1 is placed outside
the solenoid and consists of 892 CsI crystals.
The energy resolution for photons is about 9% in the energy range
from 50 to 600 MeV.
The angular resolution is of the order of 0.02 radians.
The end-cap calorimeter placed inside the solenoid consists of 680 BGO
crystals.
The thickness of the calorimeter for normally incident particles is
equal to 13.4.
The energy and angular resolution varies from 8% to 4% and from 0.03
to 0.02 radians respectively for the photon energy in the range
100 to 700 MeV.
Both barrel and end-cap calorimeters cover a solid angle of
0.92 steradians.
The experiment was performed in the meson energy range
(985-1060 MeV). The integrated luminosity collected
during the runs of 1993 (PHI93), 1996 (PHI96) and 1998 (PHI98)
was 1.5, 2.1 and 11.5 respectively, so that our
analysis is based on the data sample corresponding to
15.1 .
3 Data analysis
3.1 General approach
A search for events of the decay used
the final state with two charged particles and two photons from
the decay . For the process under study
the invariant mass of the two photons
should be equal to
the -mass within the resolution.
Event selection was performed using kinematical reconstruction taking
into account energy-momentum conservation.
The number of detected events is given by:
(1)
where is the total number of the produced mesons
and is the corresponding detection
efficiency.
One of the most important backgrounds to our process comes from events
of the decay followed by the -quantum conversion
at the wall of the beam pipe.
Since the DC space resolution is not sufficient to separate events
with the conversion at the beam pipe from those due to conversion decays
at the interaction point, the contribution of
this background was calculated from the simulation:
(2)
where is the detection efficiency of the
decay with the conversion in the material.
Another significant source of background is the decay mode .
In this case the kinematical
reconstruction assuming that charged tracks are electrons,
gives about 150 MeV, i.e.
only slightly different from the -mass, and
is not sufficient to separate this process from
(1).
Therefore, to suppress this background, the procedure of
separation by the energy loss of charged particles in the calorimeter
was developed (see the next subsection and [17]) allowing
determination of the expected number
of such events.
Other sources of background are the quantum electrodynamical (QED)
process , and the decay mode followed by
the Dalitz decay or the conversion of
from the decay.
All these background processes can be separated from the
decay under study by their wide and smooth distribution of
.
The total number of observed events is a sum of the three
contributions above:
(3)
The following selection criteria were used for the decay :
•
the impact parameter of the tracks to
reject events with the decay in DC;
•
the angle between two tracks to
suppress the process (for conversion decays the angle
between and is small);
•
the number of photons ;
•
the photon energy to suppress
the process ;
•
for calorimeter noise suppression;
•
for suppression of the conversion
decay .
To determine the total number of the produced mesons,
events of the process have been used.
Since this process also contains two charged particles and two photons in
the final state, normalization to it allows to cancel some
possible systematic errors.
The number of events of this process is given by the following formula:
(4)
For the normalization process the selection criteria are:
•
to suppress
events;
•
;
•
MeV for
suppression of events;
•
to reject events with the decay in DC.
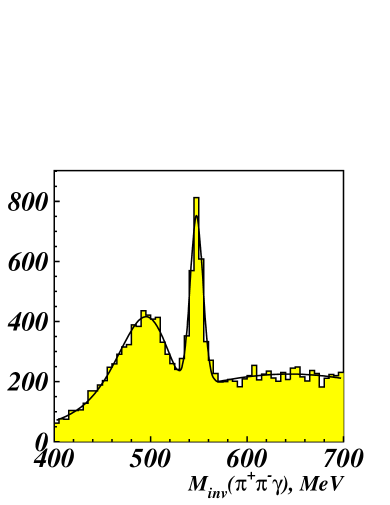
Figure 1 shows the distribution of the invariant
mass for thus selected experimental events.
A clear signal from the process , is observed at the
-meson mass. It can be fit with a Gaussian whose
variance is taken from simulation.
The background mainly comes from events of the process , with a lost photon (the wide signal in the 500 MeV region can be
fit with the logarithmic Gaussian [18]), the decay and the QED process
(another wide background fit with the Gaussian).
Figure 1: Invariant mass for ,
Eliminating from the relations (1), (2) and (4), the following
expression for the branching ratio of the decay can be obtained from (3):
(5)
Here is the expected number of the events of the
decay obtained from the procedure of
separation.
3.2 -separation
Since simulation can not completely reproduce interactions of charged
particles with the calorimeter, the procedure of -separation is
based on the experimental data.
Energy losses of and were studied
using “clean” samples of events of
the processes and , respectively.
The QED process with small angles between
the tracks was chosen as the closest to .
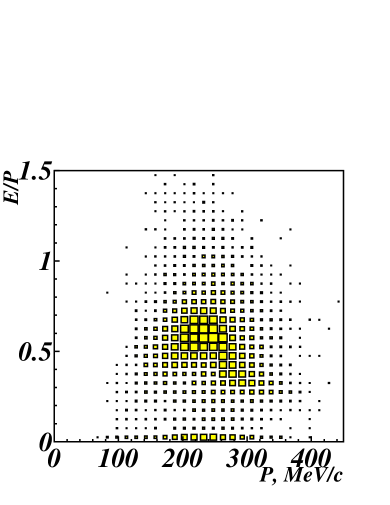
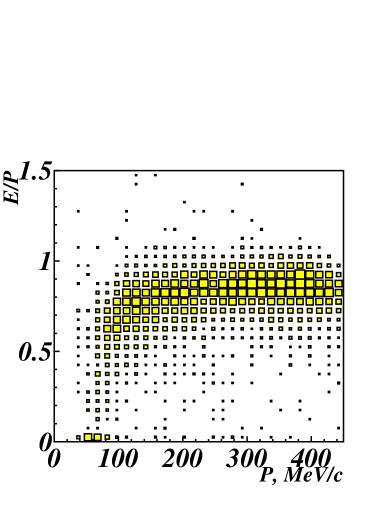
From the distributions of (the energy loss
of a charged particle in the calorimeter divided by its momentum in DC)
versus shown in Fig. 2 for pions from
the decay and in Fig. 2 for electrons
from the it can be seen that can be separated well.
Figure 2: Distribution of vs :
for ; for
The whole region of momenta from 0 to 500 MeV was divided to bins 50 MeV
wide and for each bin the distributions were plotted.
These spectra were fit by: for – the logarithmic Gaussian
function, for – a sum of two standard Gaussian functions.
A probability to penetrate the detector without any energy loss and a
probability to lose some energy in the calorimeter were defined
as a ratio of the number of events with and with to
the total number of events respectively.
Then the probability density functions for each sort of the particles
depend on the momentum in DC and energy loss in
the calorimeter.
The probability for one track to be or :
(6)
The probability for one track to be or :
(7)
Similarly, one can construct the probability for both tracks in the
event to be or :
(8)
Finally, we can determine the detection efficiencies
and
which respectively give the probability to detect an and
pair as an one. They are calculated as the
ratio of the number of events with to the total
number of sample events of the processes and respectively. Here is some boundary value chosen from the
analysis of the distribution.
3.3 Selection of events
The main selection criteria for the process under study were listed above.
Figure 3 shows
the scatter plot of the probability
for both tracks to be electrons
versus the invariant mass of the photons
for the PHI98 data after these cuts.
Figure 3: Scatter plot of versus
Events with an -pair have while for those
with pions .
Events in the region and
MeV come from the decay .
To suppress it, the additional cut based on the -separation
was applied:
•
, the probability that an event
has an -pair.
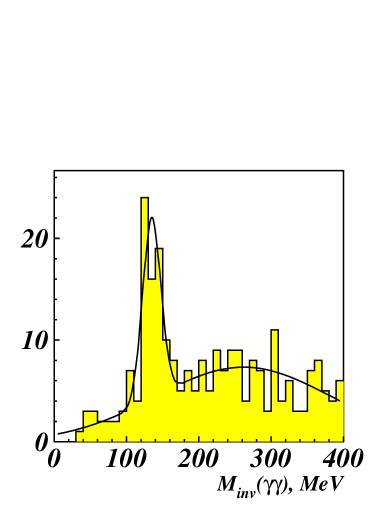
Figure 4 shows the distribution of the
invariant mass for the data after this selection.
A clear signal is observed at the -meson mass which
can be fit with a Gaussian (its variance is taken from simulation).
The wide background can be also fit with a Gaussian.
If instead the cut one applies the complementary cut
•
, to enhance the probability that the
event has a pair,
the expected number can be determined.
Figure 4: The invariant mass for ,
Detection efficiencies were determined from the Monte Carlo simulation
(MC) [19]
taking into account the efficiencies of separation
and
a correction
for the reconstruction of events with a small opening angle,
for brevity referred to as the small angle correction.
The reconstruction
of such events can not be completely reproduced by the simulation
and was therefore specially studied using experimental events of the
process , which also have a small angle between an
electron and positron.
4 Results
Figure 5 shows the
energy dependence of the visible cross section of
the process , for the run PHI98.
It is compatible with that expected for the
meson, but a small non-resonant background can not be excluded.
In fact, one should expect such a background coming from the
”tail” of the decay. To determine
the number of events coming from the meson decay, a fit
of the visible cross section was performed which included
a Breit-Wigner signal of the meson and a possible
non-resonant background. The fit with the meson
mass and width fixed at their world average values gave
the following
ratio of the non-resonant background cross section
to that at the peak
compatible with the VMD estimate.
From this value as well as from the integrated luminosity one
can determine the corrected number of events for the process under
study:
Similar analysis was performed for the data of PHI93 and PHI96 runs.
Figure 5: The visible cross section of , versus the total energy
Table 1 presents the final results
of the data processing: the number of selected
events, the expected number of events of ,
and determined by the described procedure,
the detection efficiencies and branching ratios
of the decay in various runs.
Also presented in the Table are the data for the normalization process.
The differences of the efficiencies from run to run are
caused by varying conditions of data taking.
The total detected number of the candidates is
with an expected background of events.
The error in the estimated number of background events
is determined by the procedure described above.
Table 1: Branching ratio of decay
Run
PHI93
PHI96
PHI98
Total
Expected
Expected
Total expected
background
Expected
As already noted, since the number of events of the process under
study is normalized to that of the process
, with a similar
final state, some of the systematic uncertainties cancel (trigger,
detection efficiencies etc.).
The main sources of the remaining systematic errors are listed below,
their magnitude given for the most statistically significant run
PHI98:
•
A limited sample of simulated events used to determine detection
efficiencies - 2.7%
•
Statistical errors of the parameters in the small angle
correction - 3.9%
•
Parameters of the separation procedure - 2.5%
•
The shape of the invariant mass
distributions used in the fits - 11.9%
•
Inaccurate knowledge of the thickness of
material in front of the DC (the beryllium beam pipe and
the DC inner wall made of aluminized mylar) - 2.2%
•
The shape of the distributions used in the fits to determine the
parameters of the small angle correction - 6.8%
•
Errors of the world average values for the branching ratios
of intermediate decays from [9] - 4.9%
•
Dependence on the transition form factor model. The form factor in the
generalized VMD ( mesons) was compared to that in
the simple VMD (single meson only). The contribution to
the branching ratio is 9.5%.
Three first sources of the error are of statistical nature, their
values were obtained for each run separately, so that they
are uncorrelated. Their total contribution to the error is
5.4% and can be quadratically added to the statistical error.
All others are obviously correlated from
run to run and their total magnitude is 17.5%.
From the last line of Table 1 it is clear that the values of the
branching ratio obtained in different runs are consistent within
the errors. To improve the accuracy, we can average them.
The resulting value of the branching ratio for the decay is
where the first error is statistical (including the uncorrelated
systematic errors discussed above) and the second one is a
systematic correlated error common for all runs.
5 Conclusion
For the first time the branching ratio of the conversion decay
has been
determined by the CMD-2 detector at VEPP-2M:
(9)
This measurement is based on 68 selected candidates for the events of
the process with an expected background of 22 events.
The obtained value agrees with the theoretical predictions
[4, 20, 21] and with
the experimental upper limit at 90% CL
placed by the neutral detector ND at VEPP-2M using a data sample
of 2.8 [11]. Our result supersedes the
previous value of
obtained by CMD-2 and based on a data sample
corresponding to 1.5 only [22].
The applied procedure of event selection and particularly
the cut on the angle between the tracks
selects events with a rather small so that it is
practically impossible to study the momentum transfer dependence
of the cross section. Therefore, one can conclude
that the study of transition form factors will become feasible when
much larger data samples are collected.
The authors are grateful to the staff of VEPP-2M for the
excellent performance of the collider, to all engineers and
technicians who participated in the design, commissioning and operation
of CMD-2. We acknowledge useful comments of V.P. Druzhinin and
stimulating discussions with R.A. Eichler.
References
[1]
L. Landsberg, Phys. Rep. 128 (1985) 301.
[2]
A. Bramon, M. Greco,
The Second DANE Physics Handbook. INFN-Laboratori
Nazionali di Frascati. Edited by L.Maiani, G.Pancheri,
N.Paver. 1995. Vol.2, p.451.
[3]
M. Crisafulli, V. Lubicz,
The Second DANE Physics Handbook. INFN-Laboratori
Nazionali di Frascati. Edited by L.Maiani, G.Pancheri,
N.Paver. 1995. Vol.2, p.515.
[4]
A. Faessler, C. Fuchs and M.I. Krivoruchenko,
Phys. Rev. C61 (2000) 035206.
[5]
E.V. Shuryak, Phys. Lett. B78 (1978) 150.
[6]
S.A. Chin, Ann. Phys. (N.Y.) 108 (1977) 301.
[7]
G. Agakichiev et al.,
Phys. Rev. Lett. 75 (1995) 1272.
[8]
M. Masera, Nucl. Phys. A590 (1995) 93c.
[9]
D.E. Groom et al.,
Eur. Phys. J. C15 (2000) 1.
[10]
R.I. Dzhelyadin et al.,
Phys. Lett. 84B (1979) 143.
[11]
S.I. Dolinsky et al.,
Sov. J. Nucl. Phys. 48 (1988) 277.
[12]
V.B. Golubev et al.,
Sov. J. Nucl. Phys. 41 (1985) 756.
[13]
E.P. Solodov,
Proceedings of the VII Int. Conf. on Hadron Spectroscopy,
Upton, NY, 1997, AIP Conf. Proceed. 432, p.778.
[14]
M.N. Achasov et al.,
Preprint BudkerINP 98-65, Novosibirsk, 1998.
[20]
S. Eidelman,
Proceedings of the Workshop on Physics and Detectors for DANE,
Frascati, 1991, p.451.
[21]
M. Hashimoto, Phys. Rev. D54 (1996) 5611.
[22]
M. Lechner, Dissertation Swiss Federal Institute of Technology (ETH)
for Doctor of Natural Science degree, Diss. ETH No. 12866 and ETHZ-IPP
Internal Report 98-5.