First Neutrino Observations from the Sudbury Neutrino Observatory
Abstract
The first neutrino observations from the Sudbury Neutrino Observatory are presented from preliminary analyses. Based on energy, direction and location, the data in the region of interest appear to be dominated by 8B solar neutrinos, detected by the charged current reaction on deuterium and elastic scattering from electrons, with very little background. Measurements of radioactive backgrounds indicate that the measurement of all active neutrino types via the neutral current reaction on deuterium will be possible with small systematic uncertainties. Quantitative results for the fluxes observed with these reactions will be provided when further calibrations have been completed.
1 INTRODUCTION
This paper presents the first neutrino observations from the Sudbury Neutrino
Observatory [1] (SNO), a 1000 tonne heavy-water-based Cerenkov detector situated
2 km underground in INCO’s Creighton mine near Sudbury, Ontario, Canada. The SNO
detector has been filled with water since May, 1999. After a commissioning
period, the detector parameters were fixed at the start of November 1999 and
neutrino data acquisition and associated calibrations have been taking place
almost continuously since then. In this initial phase of the project, the
detector is filled with pure heavy water. Neutrinos from 8B decay in the sun
are observed from Cerenkov processes following these reactions:
1. The Charged Current (CC) reaction, specific to electron neutrinos:
This reaction has a Q value of -1.4 MeV and the electron energy is strongly
correlated with the neutrino energy, providing very good sensitivity to spectral
distortions.
2. Neutral Current (NC) reaction, equally sensitive to all non-sterile neutrino
types:
This reaction has a threshold of 2.2 MeV and is observed through the detection
of neutrons by three different techniques in separate phases of the experiment.
3. Elastic Scattering (ES) reaction:
This reaction has a substantially lower cross section than the other two and is predominantly sensitive to electron neutrinos; they have about six times greater cross-section than or neutrinos.
The reaction:
| (1) |
also provides a unique signature for anti-electron neutrinos from various
possible sources.
The SNO experimental plan calls for three phases of about one year each wherein
different techniques will be employed for the detection of neutrons from the NC
reaction. During the first phase, with pure heavy water, neutrons are observed
through the Cerenkov light produced when neutrons are captured in deuterium,
producing 6.25 MeV gammas. In this phase, the capture probability for such
neutrons is about 25% and the Cerenkov light is relatively close to the
threshold of about 5 MeV electron energy, imposed by radioactivity in the
detector. (Figure 1). For the second phase, about 2.5 tonnes of NaCl will be
added to the heavy water and neutron detection will be enhanced through capture
on Cl, with about 8.6 MeV gamma energy release and about 83% capture efficiency.
(See Figure 1). For the third phase, the salt is removed and an array of 3He-
filled proportional counters will be installed to provide direct detection of
neutrons with a capture efficiency of about 45%.
2 PHYSICS OBJECTIVES
The main physics goals for the Observatory are observations of:
- Solar Neutrinos
- Atmospheric Neutrinos
- Supernova Neutrinos
- Cosmic Ray Muons
- Anti-electron neutrinos from various processes including transformations of
solar neutrinos or relic supernova neutrinos.
For Solar Neutrinos, the combination of three detection reactions provides several sensitive ways to seek evidence for neutrino flavor change without relying on calculations of initial fluxes from solar models. The ratio of neutrino fluxes above a threshold, as observed by the CC and NC reactions provides a very sensitive way to observe transformations to active neutrinos.
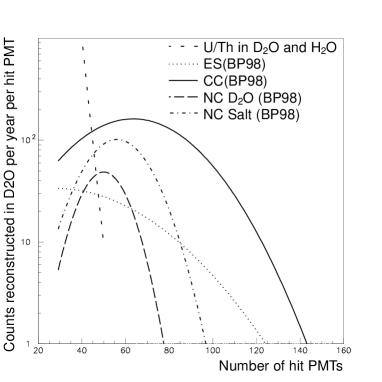
The ratio of CC/NC can be observed during all three phases of operation. The sensitivity to the NC reaction is limited during the first phase, but there will be excellent sensitivity with different systematic uncertainties during the other two phases. The ratio of fluxes detected by the CC and ES reaction has a smaller dependence on flavor change to active species through the sensitivity to and neutrinos in the ES cross section. Events from the CC and ES reactions can be distinguished through the very different directional response. The ES reaction is strongly peaked away from the Sun, whereas the CC reaction has a form of approximately cos, with about a factor of two difference in rate between forward and backward directions relative to the Sun. The angular resolution of the detector is better than 25 degrees. The NC rate may be determined during the pure D2O phase partly through a distinctive variation as a function of radius. However, the definition of the number of events observed with this reaction is clearly enhanced by the addition of salt (see Figure 1), and will be determined independently of the Cerenkov signals when the 3He-filled proportional counters are installed. The observed spectrum for the CC reaction is a very sensitive indicator of distortions caused by the MSW effect[3] because the energy of outgoing electrons is strongly correlated with the incoming neutrino energy and the detector energy resolution is better than 20% for the range of interest. With the relatively high statistical accuracy indicated by Figure 1, the SNO detector will also provide sensitive measurements of the solar neutrino flux as a function of zenith angle to search for MSW regeneration in the Earth. Correlations between flux, energy spectrum, zenith angle and time of year will also be studied. With the variety of reactions to be studied, the SNO detector can explore oscillations via the MSW effect or vacuum oscillation processes over the full range of parameters consistent with previous experiments. It could provide clear evidence for electron neutrino flavor change, including transformations to either active or sterile types.
3 DETECTOR PERFORMANCE
The SNO detector consists of 1000 tonnes of pure D2O contained within an
acrylic vessel (12 m diameter, 5 cm thick), viewed by 9438 PMT’s mounted on a
geodesic structure 18 m in diameter, all contained within a polyurethane-coated
barrel-shaped cavity (22m diameter by 34 m high). The cavity volume outside the
acrylic vessel (AV) is filled with purified H2O. There are 91 PMT’s looking
outward from the geodesic structure, viewing the outer H2O volume.
The SNO detector has been full of water since May, 1999.
During the period until
November, 1999, detailed commissioning tests and calibrations were performed.
There has been no substantial problem from electrical breakdown of high voltage
connectors submerged in light water since nitrogen was added to the degassed
water. During the period before November, a variety of adjustments were made to
improve the light sensitivity by about 25% and to reduce the trigger threshold
to about 2 MeV. Four additional PMT’s were installed in the neck of the acrylic
vessel to provide a clear indication of instrumental light emitted in this
region, probably from static discharges of insulating materials. 222Rn gas in
the air above the heavy water was reduced to acceptable levels by flushing with
boil-off gas from liquid nitrogen.
As of November, 1999, the desired detector specifications had been met, the
detector
parameters were frozen and production data accumulation was started,
interspersed with a variety of calibration measurements. The detector
performance has been very good, with more than 98.5% of all channels
operational; a total event rate of less than 5 Hz above a threshold of about 20
hit PMT’s; PMT individual noise rates of less than 500 Hz for a threshold of
about 0.3 photoelectrons, providing fewer than 2 noise hits per event.
4 CALIBRATION
Detector calibration is being carried out with a variety of techniques and sources. Electronic calibrations of pedestals, slopes and timing are performed regularly with pulsers. The 600,000 electronic constants are very stable. Optical properties of the detector have been studied using a diffusing ball, (Laserball) receiving light from a pulsed laser system providing wavelengths between 337 and 700 nm with variable intensity at repetition rates from near 0 to 45 Hz. This source and other calibration sources are moved within the D2O volume using a manipulator system capable of positioning them to better than 5 cm. Positions in the H2O volume between the D2O and the PMT’s are also accessible along vertical paths from above. A nearly mono-energetic 16N gamma ray source has also been deployed.
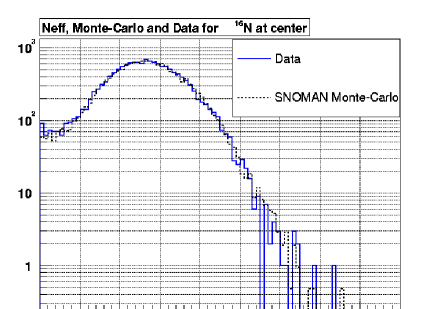
Figure 2 shows a spectrum from the 16N source compared with a Monte Carlo
simulation, using optical parameters extracted
from a preliminary analysis of the laserball data. A single constant
corresponding to the average quantum efficiency of the PMT’s has been adjusted
to match the centroid of these spectra. A further comparison of centroids for
over 20 other locations throughout the D2O volume showed less than 2%
difference between the data and the simulation at any point. An acrylic-
encapsulated 242Cf fission neutron source has also been deployed to study the
neutron response of the detector.
Other sources being prepared include a 19.8 MeV gamma source produced by the
(p,t) reaction, a triggered source for the 232Th and 238U chains producing
2.6 and 2.4 MeV gammas and a source of 8Li, emitting betas up to 13 MeV. The
short-lived 16N and 8Li activities are produced by a pulsed neutron
generator located near the SNO detector and are transported via capillary tubing
to decay chambers within the detector volume.
5 OBSERVATIONS TO DATE
In addition to Cerenkov light produced by neutrinos and radioactivity, there can
be other sources of ”instrumental light” arising from parts of the detector.
For example, it is well known that PMT’s can occasionally emit light, perhaps
through internal electrical discharges. Light from these sources has very
different characteristics from the typical patterns observed for Cerenkov light at
solar neutrino energies. The light from a flashing PMT shows an early trigger
for the flashing PMT, followed by light observed across the detector, at least
70 ns later. For SNO, six or more electronic channels surrounding the flashing
PMT typically show pickup signals, distinguishing the events further from
Cerenkov events.
Figure 3 shows the raw spectrum of events (solid line) observed
with the detector for a fraction of the data obtained since the start of data
taking in November, 1999. The events are plotted against NHIT, the number of
PMT’s contained in a 400 ns second window surrounding the detector trigger (more
than about 20 PMT’s hit within a 100 ns window). NHIT is approximately
proportional to the electron energy for a Cerenkov event, with about 9 NHIT
corresponding to 1 MeV. Only a fraction of the data have been shown as the
remainder are being saved for a comparison after the cuts have been fully
defined.

The dashed line shows the residual data after cuts have been imposed to remove events that show characteristics matching the Flashing PMT’s. The dotted line shows the residual data after further cuts are imposed to remove another class of events associated with bursts of light from the neck region of the detector. These events may arise from static discharges of insulating materials. Four additional PMT’s were installed in this region in September, 1999. They clearly observe these events and are very insensitive to light generated in the detector itself, as determined from the calibration sources. The dot and dash line shows the residual events after the imposition of further cuts which eliminate events that show characteristics of pickup in the electronic systems.
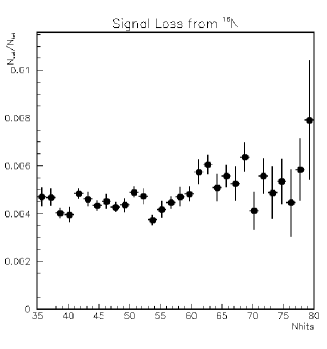
Two separate groups within the SNO Collaboration developed a series of cuts to eliminate these instrumental light sources and their results for the residual spectrum were virtually identical, lending confidence in the robustness with which these events can be distinguished from neutrinos. To ensure that these cuts do not remove a significant number of neutrino events, the fraction of signal loss was tested with the 16N source. The results are shown in Figure 4, indicating very low loss of signal in the region tested.
Following these cuts, algorithms based on timing and spatial information were used to reconstruct the position and direction of the events. Figure 5 shows the resulting spectrum for a large fiducial volume.
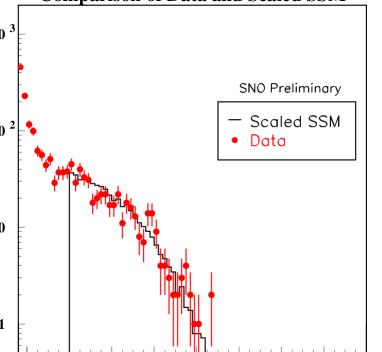
Superimposed on the data is the simulated spectrum for the CC reaction in Figure 1, scaled to the data. As the calibrations are not yet complete, the SNO collaboration has chosen not to quote a number for the flux of electron neutrinos measured by the CC reaction on deuterium. However, it should be apparent from the figure that the spectrum is well defined so that an accurate measurement will be obtained when further calibrations have been completed.
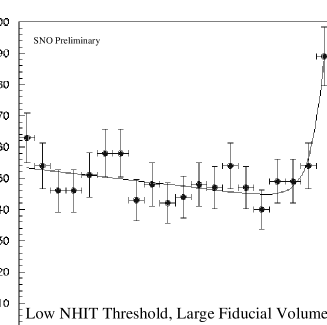
Figure 6 shows events as a function of the direction to the sun for a lower energy threshold and a larger fiducial volume. Even with somewhat more radioactive background included by these parameter choices, the peak at cos from the ES reaction is apparent.
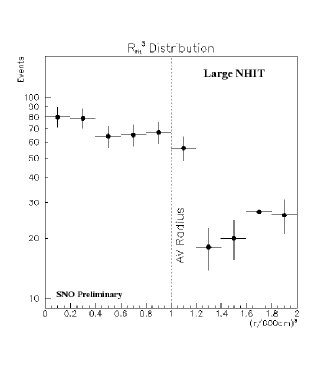
Figure 7 shows the distribution of events as a function of (radius/600cm)3, for a high-energy threshold. The radius of the AV is 600 cm, so the heavy water volume corresponds to values less than 1. It is apparent that there is a clear excess of events in this region, indicating the substantial contribution from the CC reaction on deuterium.
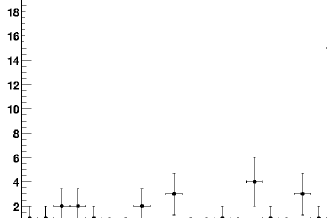
Figure 8 shows the distribution of events with a high energy threshold for a region in the light water outside the AV. Events have been selected to remove inward-coming gamma rays. The peak from ES events is apparent with a relatively small background.
6 RADIOACTIVE BACKGROUNDS
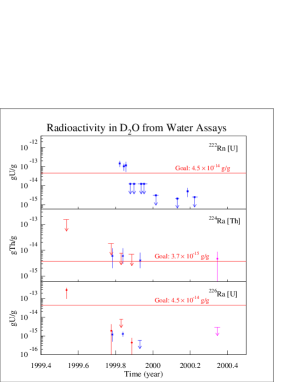
Radioactive backgrounds that contribute to the Cerenkov light in the detector arise from the decay chains of 238U and 232Th impurities in the water and other detector materials. At low energies, the dominant contributions come from impurities in the water. These contributions can be measured through the radioassay of the light and heavy water. They can also be measured independently through observation of the low energy region of the Cerenkov spectrum for events reconstructing in the water regions. Sensitive techniques have been developed for radioassay of 224Ra, 226Ra and 222Rn in the water. The measurements for Ra are performed by extracting the Ra on beads coated with manganese oxide or on ultrafiltration membranes coated with hydrous titanium oxide. After sampling hundreds of tonnes of water, these materials are measured for radioactive decay of the Ra with techniques sensitive to tens of atoms. (see reference[1] for more details) The 222Rn is measured by degassing 50 or more tonnes of water and collecting the Rn gas with liquid nitrogen-cooled traps. The collected gas is then counted with ZnS coated scintillation cells (Lucas cells) to observe the alpha decays. These techniques have been employed to make very sensitive measurements of the water, as shown in Figures 9 and 10.
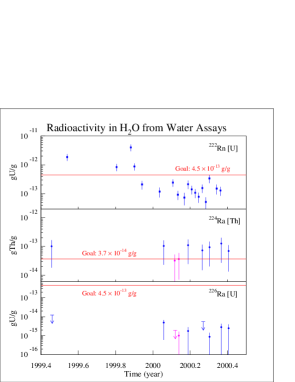
The Cerenkov light generated by the Th and U radioactivity can be observed at low energies as illustrated in figure 1 and observed in figures 3 and 5. As the decay products and sequence are different for the two chains it is also possible to use pattern recognition to obtain a statistical separation of the contributions from the two chains. Future calibrations will include the use of proportional counters containing Th and U chain sources to provide triggered events to calibrate the detector response in this region. However, the data to date, with large calibration uncertainties, do agree with the radioassay measurements. The light water in the SNO detector is designed to attenuate higher energy gamma rays (fission and alpha-induced) from radioactivity in the cavity walls and the PMT support structure. High-energy events reconstructed in the light water volume outside the AV are found to be predominantly inward going and the numbers decrease rapidly as a function of radius. Using calibration data from the 16N source positioned near the PMT’s, extrapolations of the number of high energy gammas interacting within the D2O volume indicate that fewer than a few percent of the events above NHIT = 60 in Figure 5 arise from external high energy gammas. In addition to the contributions to Cerenkov light, the presence of Th and U chain elements can produce a background for the NC reaction through the photodisintegration of deuterium by 2.6 MeV gammas from the Th chain and 2.4 MeV gammas from the U chain. The horizontal lines in Figure 10 individually represent contributions to the neutron background in the detector from photodisintegration equivalent to 5% of the signal expected for the NC reaction for the neutrino flux[2] of BP98. As is apparent from the figure, these goals have been met for the U chain and are met within a factor of two for the Th chain.
7 CONCLUSIONS
Based on energy, direction and location information, the data in the regions of interest in Figures 5 to 8 appear to be dominated by 8B solar neutrino events observed with the CC and ES reactions, with very little background. This implies that measurements during the pure heavy water phase will provide an accurate measurement of the electron neutrino flux via the CC reaction after completion of further calibrations. The measurements of radioactivity imply that the NC measurements can be made with only a small uncertainty from the radioactive background.
8 Acknowledgments
This research has been financially supported in Canada by the Natural Sciences and Engineering Research Council, Industry Canada, National Research Council of Canada, Northern Ontario Heritage Fund Corporation and the Province of Ontario, in the United States by the Department of Energy, and in the United Kingdom by the Science and Engineering Research Council and the Particle Physics and Astronomy Research Council. Further support was provided by INCO, Atomic Energy of Canada Limited (AECL), Agra-Monenco, Canatom, Canadian Microelectronics Corporation and Northern Telecom. The heavy water has been loaned by AECL with the cooperation of Ontario Hydro. The provision of INCO of an underground site is greatly appreciated.
References
- [1] J. Boger et al, Nucl.Instrum.Meth. A449 (2000) 172-207.
- [2] J.N. Bahcall, S. Basu and M. H. Pinsonneault, Phys. Lett. B433 (1998) 1.
- [3] L. Wolfenstein, Phys. Rev. D17 (1978) 2369; S.P. Mikheyev and A.Y. Smirnov, Sov. Jour. Nucl. Phys. 42 (1985) 913.
aThe SNO Collaboration includes: M. G. Boulay, E. Bonvin, M. Chen, F. A. Duncan, E. D. Earle, H. C. Evans, G.T. Ewan, R. J. Ford, A. L. Hallin, P. J. Harvey, J. D. Hepburn, C. Jillings, H. W. Lee, J. R. Leslie, H. B. Mak, A. B. McDonald, W. McLatchie, B. A. Moffat, B.C. Robertson, P. Skensved, B. Sur, Queen’s University, Kingston, Ontario K7L 3N6, Canada.; I. Blevis, F. Dalnoki-Veress, W. Davidson, J. Farine, D.R. Grant, C. K. Hargrove, I. Levine, K. McFarlane, T. Noble, V.M. Novikov, M. O’Neill, M. Shatkay, C. Shewchuk, D. Sinclair, Carleton University, Ottawa, Ontario K1S 5B6, Canada.; T. Andersen, M.C. Chon, P. Jagam, J. Law, I.T. Lawson, R. W. Ollerhead, J. J. Simpson, N. Tagg, J.X. Wang, University of Guelph, Guelph, Ontario N1G 2W1, Canada.; J. Bigu, J.H.M. Cowan, E. D. Hallman, R. U. Haq, J. Hewett, J.G. Hykawy, G. Jonkmans, A. Roberge, E. Saettler, M.H. Schwendener, H. Seifert, R. Tafirout, C. J. Virtue, Laurentian University, Sudbury, Ontario P3E 2C6, Canada.; S. Gil, J. Heise, R. Helmer, R.J. Komar, T. Kutter, C.W. Nally, H.S. Ng, R. Schubank,,Y. Tserkovnyak, C.E. Waltham, University of British Columbia, Vancouver, BC V6T 1Z1, Canada.; E. W. Beier, D. F. Cowen, E. D. Frank, W. Frati, P.T. Keener, J. R. Klein, C. Kyba, D. S. McDonald, M.S.Neubauer, F. M. Newcomer, V. Rusu, R. Van Berg, R. G. Van de Water, P. Wittich, University of Pennsylvania, Philadelphia, PA 19104, USA.; T. J. Bowles, S. J. Brice, M. Dragowsky, M. M. Fowler, A. Goldschmidt, A. Hamer, A. Hime, K. Kirch, J. B. Wilhelmy, J. M. Wouters, Los Alamos National Laboratory, Los Alamos, NM 87545, USA.; Y. D. Chan, X. Chen, M.C.P. Isaac, K. T. Lesko, A.D. Marino, E.B. Norman, C.E. Okada, A.W. P. Poon, A. R. Smith, A. Schuelke, R. G. Stokstad, Lawrence Berkeley National Laboratory, Berkeley, CA 94720, USA.; Q. R. Ahmad, M. C. Browne, T.V. Bullard, P. J. Doe, C. A. Duba, S. R. Elliott, R. Fardon, J.V. Germani, A. A. Hamian, K. M. Heeger, R. Meijer Drees, J. Orrell, R. G. H. Robertson, K. Schaffer, M. W. E. Smith, T. D. Steiger, J. F. Wilkerson, University of Washington, Seattle, WA 98195, USA.; J. C. Barton, S.Biller, R. Black, R. Boardman, M. Bowler, J. Cameron, B. Cleveland, G. Doucas, Ferraris, H. Fergami, K.Frame, H. Heron, C. Howard, N. A. Jelley, A. B. Knox, M. Lay,W. Locke, J. Lyon, N. McCaulay, S. Majerus, G. MacGregor, M. Moorhead, M. Omori, N. W. Tanner, R. Taplin, M. Thorman, P. T. Trent, D. L.Wark, N. West, University of Oxford, Oxford OX1 3NP, United Kingdom.; J. Boger, R. L Hahn, J.K. Rowley, M. Yeh Brookhaven National Laboratory, Upton, NY 11973-5000, USA.; R.G. Allen, G. Buhler, H.H. Chen (Deceased), University of California, Irvine, CA 92717, USA.