EUROPEAN ORGANIZATION FOR NUCLEAR RESEARCH
SLAC-PUB-8492 CERN-EP-2000-096 19 March 2000
Combined results on -hadron production rates, lifetimes,
oscillations and semileptonic decays
ALEPH, CDF, DELPHI, L3, OPAL, SLD
Prepared
111The members of the working groups involved in
this activity are:
D. Abbaneo,
J. Alcaraz, V. Andreev, E. Barberio, M. Battaglia,
S. Blyth, G. Boix, C. Bourdarios,
M. Calvi, P. Checchia, P. Coyle,
L. Di Ciaccio, P. Gagnon, R. Hawkings, O. Hayes, P. Henrard, T. Hessing,
M. Jimack, I.J. Kroll, O. Leroy, D. Lucchesi, M. Margoni, S. Mele,
H.G. Moser, F. Muheim, F. Palla, D. Pallin, F. Parodi, M. Paulini, E. Piotto,
P. Privitera, Ph. Rosnet,
P. Roudeau, D. Rousseau, O. Schneider, Ch. Schwick,
C. Shepherd-Themistocleous,
F. Simonetto, P. Spagnolo, A. Stocchi, D. Su, T. Usher, C. Weiser, P. Wells,
B. Wicklund and S. Willocq.
from Contributions to the 1999 Summer conferences.
Combined results on -hadron lifetimes, -hadron production rates, and oscillations, the decay width difference between the mass eigenstates of the system, and the values of the CKM matrix elements and are obtained from published and preliminary measurements available in Summer 99 from the ALEPH, CDF, DELPHI, L3, OPAL and SLD Collaborations.
1 Introduction
Accurate determinations of -hadron decay properties provide constraints on the values of the elements of the Cabibbo-Kobayashi-Maskawa (CKM) matrix [1]. The and elements can be obtained from semileptonic decay rates into charmed and non-charmed hadrons, and measurements of the oscillation frequency in and systems give access to and .
Elements of the CKM matrix govern weak transitions between quarks. Experimental results are obtained from processes involving -hadrons. Effects from strong interactions have thus to be controlled; and -hadrons are also a good laboratory in this respect. Lifetime differences between the different weakly decaying hadrons can be related to interactions between the heavy quark and the light quark system inside the hadron. The polarization of baryons produced by -quarks of known polarization, emitted from decays at LEP or SLC, indicates how polarization is transmitted from the heavy quark to the baryon(s) in the hadronization process. Rates and decay properties of excited states111The notation includes all charm mesons and non-resonant charmed final states which are not simply D or mesons. produced in -hadron semileptonic decays are needed to obtain accurate determinations of . Decays of states are also an important source of background in other channels, and their properties have to be monitored. Finally, it is mandatory to measure the production rates of the different weakly decaying -hadrons produced during the hadronization of -quarks created in high energy collisions, because all these states have different properties so the study of any one of them requires control of the background from the others.
Results obtained on -hadron lifetimes, -hadron production rates, and oscillations, and the values of the CKM matrix elements and made available during Summer 1999 are presented here. A limit on the decay width difference of the mass eigenstates of the system is also given. These quantities have been obtained by averaging published and preliminary measurements released publicly by the ALEPH, CDF, DELPHI, L3, OPAL and SLD experiments. Whenever possible, the input parameters used in the various analyses have been adjusted to common values, and all known correlations have been taken into account. Close contacts have been established between representatives from the experiments and members of the different working groups in charge of the averages, to ensure that the data are prepared in a form suitable for combinations. Working group activities are coordinated by a steering group222The present members of the Heavy Flavour Steering Group are: D. Abbaneo, J. Alcaraz, E. Barberio, M. Battaglia, S. Blyth, D. Su, P. Gagnon, R. Hawkings, S. Mele, D. Pallin, M. Paulini, P. Roudeau, O. Schneider, F. Simonetto, A. Stocchi, P. Wells, B. Wicklund and S. Willocq..
Section 2 presents the values of the common input parameters that contribute to the systematic uncertainties given in this note. Published results obtained by other experiments, mainly operating at the resonance, have been included to obtain most accurate values. In particular, it contains studies on some characteristics of mesons in semileptonic -decays, and on the polarization. As some measured quantities are needed for the evaluation of others, an iterative procedure has been adopted to obtain stable results.
Section 3 describes the averaging of the -hadron lifetime measurements. The combined values are compared with expectations from theory. The inclusive -hadron and meson333Throughout the paper charge conjugate states are implicitly included unless stated otherwise. lifetimes are needed in the determination of and in order to convert measured branching fractions into partial widths that can then be compared with theory.
In Section 4, oscillations of neutral B mesons are studied. Also the production rates of the different -hadrons in jets induced by a -quark are determined using direct measurements together with the constraints provided by B mixing. The production rate is an important input for the measurement using decays, and the sensitivity to - oscillations depends on the production rate.
In Section 5, a limit on the decay width difference between mass eigenstates of the - system is given. As this average is obtained for the first time, more details on the adopted procedure have been given than for lifetimes or oscillations measurements.
The determination of and presented in Sections 6 and 7 includes only LEP results. These averages are also released for the first time. The determination of is based on a novel technique using the lepton momentum and the mass of the hadronic system. The accuracy of these results (especially on ) depends mostly on theoretical uncertainties. Appendix E gives details on the theoretical inputs used.
A summary of all results obtained by the different working groups is given in Section 8. In addition, Appendices A-D contain, respectively, the individual measurements of the production rates of narrow states, polarization, -hadron lifetimes, and direct measurements of -meson and -baryon production rates, that have been used in the present averages.
2 Common input parameters
The -hadron properties used as common input parameters in these averages are given in Table 1. Most of the quantities have been taken from results obtained by the LEPEWWG [2, 3] or quoted by the PDG [4]. The others, which concern the production rates and decay properties of mesons in -hadron semileptonic decays and the value of the polarization, are explained later in this section.
| Quantity | Symbol | Value | Reference | |
|---|---|---|---|---|
| Fraction of events | 0.21643 | 0.00073 | [2] | |
| Fraction of events | 0.1694 | 0.0038 | [2] | |
| Beam energy fraction | 0.702 | 0.008 | [3] | |
| -hadron sl. BR | BR | 0.1058 | 0.0018 | [2] |
| Cascade sl. decay (r.s.) | BR | 0.0162 | [3] | |
| Cascade sl. decay (w.s.) | BR | 0.0807 | 0.0025 | [2] |
| -hadron sl. BR | BR | 0.0985 | 0.0032 | [2] |
| quarks from gluons | P | 0.00251 | 0.00063 | [2] |
| quarks from gluons | P | 0.0319 | 0.0046 | [2] |
| decay charged mult. | 4.955 | 0.062 | [3] | |
| -hadron mixing | 0.1186 | 0.0043 | [2] | |
| mixing from | 0.156 | 0.024 | [4, 5, 6] | |
| in sl. decays | 0.0304 | 0.0044 | Sect. 2.1 | |
| in sl. decays | BR(B) | 0.0125 | 0.0016 | Sect. 2.2 |
| in sl. decays | BR | 0.0127 | 0.0021 | Sect. 2.3 |
| in double charm | BR | 0.008 | 0.003 | Sect. 2.3 |
| polarization | -0.45 | Sect. 2.5 | ||
| in sl. decays | BR | 0.026 | 0.004 | [4] |
| J/ in decays | BR | 0.0116 | 0.0010 | [4] |
| branching fraction | BR() | 0.0385 | 0.0009 | [4] |
| branching fraction | BR() | 0.091 | 0.006 | [4] |
| branching fraction | BR() | 0.036 | 0.009 | [4] |
| branching fraction | BR() | 0.050 | 0.013 | [4] |
| branching fraction | BR() | 0.683 | 0.014 | [4] |
Note the following:
-
•
and
These values apply only to -hadrons produced in decays. and are the respective branching fractions of the boson into and pairs in hadronic events, is the mean fraction of the beam energy taken by a weakly decaying -hadron.
-
•
shape of the -quark fragmentation function.
The value of obtained assuming the Peterson function [7], is given in Table 1. To evaluate the corresponding systematic uncertainty, parameter(s) governing -quark fragmentation functions, taken from other models, have been varied in accordance with the uncertainty quoted for . Fragmentation functions taken from two models [8, 9] have been chosen to estimate the systematic uncertainties coming from the shape of the function. These models typically yield results on either side of those obtained using the Peterson function which is commonly used by the experiments. For analyses which are rather insensitive to the fragmentation uncertainty, it is considered adequate to use only the Peterson model and to inflate the uncertainty on to .
-
•
the inclusive semileptonic branching fraction of -hadrons.
The average LEP value for is taken from the global LEPEWWG fit which combines the heavy flavour measurements performed at the [2].
The largest contribution to the systematic error comes from the uncertainty on the semileptonic decay model. This error is reduced from to when the fit is performed including the forward-backward asymmetry measurements in addition to all heavy flavour measurements performed at the . This happens because only asymmetry measurements obtained using leptons depend on the semileptonic decay model, measurements using a lifetime tag combined with jet-charge or D-meson reconstruction do not. To achieve consistency between these measurements, the fit effectively constrains the size of the error attributed to the semileptonic decay model, thus reducing the corresponding systematic error on the semileptonic branching fraction. Including asymmetry measurements gives an inclusive -hadron semileptonic branching fraction of . To be conservative, we have not included the asymmetry measurements in the fit to extract the semileptonic branching fraction used in the present averages. The average value was obtained with the average mixing parameter and value given in Table 1.
In the absence of direct measurements of the semileptonic branching fractions for the different B meson states, it has been assumed, when needed in the following analyses, that all -hadron semileptonic widths are equal. This hypothesis is strictly valid for and decays because of isospin invariance originating from the transition, which is (similar considerations apply also to decays). It is not valid in decays, but the induced difference between and total semileptonic decay rates can be neglected. It has been assumed valid also for mesons and -baryons, but for -baryons an uncertainty of 15 has been added, estimated by comparing the lifetime ratios and semileptonic branching fraction ratios for -mesons and -baryons [10]. Exclusive semileptonic branching fraction averages, given in the following for the meson, have been obtained using this hypothesis. Results for other -hadron flavours can be obtained using, in addition, the corresponding lifetime ratios. The latter are obtained from -hadron lifetimes given in Section 3.
-
•
gluon splitting to heavy quarks.
The quantities P and P are defined as the ratios in which, respectively, is a or a quark.
-
•
-hadron decay multiplicity.
The value given in Table 1 is an average of DELPHI [11] and OPAL [12] measurements which does not include charged decay products from the long lived particles and .
2.1 Inclusive production rate in -hadron semileptonic decays
The inclusive -hadron semileptonic branching fraction into mesons has been measured in three different ways:
- -
-
-
from a measurement at the of the rate of final states with a and using models to account for the other channels [13]:
(2) -
-
from an inclusive measurement of final states in which a D or a meson is accompanied by a charged hadron and assuming that non-strange decay channels involve only and final states:
(3)
As the of these four measurements is equal to three per degree of freedom, the uncertainty on the weighted average has been multiplied by , giving:
(4) 2.2 decays to mesons in semileptonic -decays
Semileptonic decays to excited charm states which subsequently decay to a are a source of correlated (physics) background in studies of meson properties. It is appropriate to express the different measurements in terms of the parameter , defined as the branching fraction of semileptonic decays involving final states in which a , charged or neutral, is produced:
(5) This is to differentiate such decays from those into a D meson directly. Throughout this section it is assumed that decays of mesons involve at most one pion (or one kaon for strange states).
The following measurements have been interpreted in terms of the quantity and the production fractions () and lifetimes () of the different types of weakly decaying -hadrons:
-
-
semi-inclusive measurements of semileptonic decays in which a and a charged pion have been isolated:
(6) -
-
the ARGUS measurement [13]:
(7) where the value of 0.77 corresponds to the modelling used for decays in that analysis;
-
-
the inclusive production rate of charged mesons in semileptonic decays:
where the quantity is the exclusive semileptonic branching fraction:
(9) which has been obtained by averaging results quoted by the PDG [4] for corresponding decays of and mesons, and the scaling factor has been introduced in (- ‣ 2.2) to account for a possible SU(3) flavour violation when comparing and decays.
In the above, the production fractions () and lifetimes () are taken from Sections 4 and 3 respectively.
These measurements form a coherent set of results yielding:
(10) From this result, and using the same hypotheses, it is possible to derive other quantities of interest in several analyses presented in this paper such as:
(11) (12) (13) It is also possible to determine the fraction of semileptonic decays which contain a :
(14) and the fraction of -quark jets in which the comes from a decay:
(15) As these results (10) to (15) are highly correlated they are represented in Table 1 by a single entry, chosen to be result (11).
2.3 Other semileptonic decays to mesons
Other mechanisms giving a accompanied by a lepton are important because they are further sources of background for the exclusive channel .
2.3.1 Charged production in semileptonic decays of -hadrons involving leptons
The value of BR quoted in Table 1 is obtained from the average measured value of BR() taken from the PDG [4] and assuming that a is produced in of the cases, as measured in semileptonic decays involving light leptons. The uncertainty on this last number has been increased, as compared to the value obtained in Equation (14), to account for a possible different behaviour of decays when a is produced instead of a light lepton because of differences in the masses involved in the final state.
2.3.2 Charged production in double charm semileptonic decays
The double charm production rate in -decays was measured by the ALEPH [17] and CLEO [18] Collaborations, isolating the contributions of different D meson species. From these measurements the inclusive semileptonic branching fraction, involving a wrong sign charmed meson, has been obtained [3]:
(16) The product ) quoted in Table 1 is then determined assuming again that a is produced in of the cases.
2.4 Production of narrow states in -hadron semileptonic decays
A modelling of -hadron semileptonic decays requires detailed rate measurements of the different produced states which can be resonant or non-resonant systems444In the following the study has been limited to =1., each having characteristic decay properties. As an example, there are four orbitally excited states with L=1. They can be grouped in two pairs according to the value of the spin of the light system, (L=1).
States with can have and . The state decays only through , and the through or . Parity and angular momentum conservation imply that in the the and are in a D wave but allow both S and D waves in the . However, if the heavy quark spin is assumed to decouple, conservation of ( = 3/2) forbids S waves even in the . An important D wave component, and the fact that the masses of these states are not far from threshold, imply that the states are narrow. These states have been observed with a typical width of 20 , in accordance with the expectation.
On the contrary, states can have and , so they are expected to decay mainly through an S wave and to be broad resonances with typical widths of several hundred . The first experimental evidence for broad states has been obtained by CLEO [19].
At present, information on the composition of -hadron semileptonic decays involving is rather scarce. ALEPH [14] and CLEO [24] have reported evidence for the production of narrow resonant states ( and ), which can be summarised as follows:
(17) (18) (19) where is the ratio between the production rates of and in -meson semileptonic decays. The original measurements are listed in Appendix A. Absolute rates for the and mesons have been obtained assuming that the former decays always into and the latter decays into in of the cases, as measured by ARGUS [25] and CLEO [26].
It is of interest to note that these results are very different from naive expectations from HQET in which [20]. This implies large corrections in these models, as was noted for instance in [21]. These corrections not only reduce the expected value for , they also enhance the expected production rate of states which can become of similar importance as the rate.
Comparing Equations (17-18) and (4), it can be deduced that narrow states account for less than one third of the total rate. If, in addition, model expectations for the production rates of states are used, it can be concluded that non resonant production of states is as important as, or even dominates over, the production of resonant states. As a consequence, models like ISGW [22, 23], which contain only resonant charmed states, do not provide a complete description of -hadron semileptonic decays.
2.5 polarization
Even for unpolarized beams, the -quarks produced in decays are highly polarized: . Hard gluon emission and quark mass effects are expected to change by only [27]. However, during the hadronization process of the heavy quark, part or all of the initial -quark polarization may be lost by the final weakly decaying -hadron state. The -mesons always decay finally to spin zero pseudoscalar states, which do not retain any polarization information. In contrast, baryons are expected to carry the initial -quark polarization since the light quarks are arranged, according to the constituent quark model, in a spin-0 and isospin-0 singlet. However, -quark fragmentation into intermediate states can lead to a depolarization of the heavy quark [28].
The final state is used to select event samples enriched with semileptonic decays, and the polarization is measured using the average values of the lepton and neutrino energies. Samples of events enriched in -mesons, which carry no polarization information, are used to calibrate the measurements.
Measurements from ALEPH [29], DELPHI [30] and OPAL [31], collected in Appendix B, have been averaged, assuming systematic uncertainties to be correlated, yielding:
(20) where the uncertainty is still dominated by the statistics. The following sources of systematic uncertainties, common to all measurements, have been considered:
-
–
-quark fragmentation,
-
–
production in semileptonic and inclusive decays of the ,
-
–
polarization,
-
–
theoretical uncertainties in the modelling of polarized semileptonic decays.
3 Averages of -hadron lifetimes
Best estimates for the various -hadron lifetimes, for the ratio of the and lifetimes, and for the average lifetime of a sample of -hadrons produced in -jets have been obtained by the B lifetime working group555The present members of the B lifetime working group are: J. Alcaraz, L. Di Ciaccio, T. Hessing, I.J. Kroll, H.G. Moser and C. Shepherd-Themistocleous.. Details on the procedure used to combine the different measurements can be found in [32].
The measurements used in the averages presented here are listed in Appendix C. Possible biases can originate from the averaging procedure. They depend on the statistics and time resolution of each measurement and in the way systematic uncertainties have been included. These effects have been studied in detail using simulations and have been measured to be at a level which can be neglected as compared to the statistical uncertainty.
3.1 Dominant sources of systematic uncertainties
Dominant sources of systematic uncertainties leading to correlations between measurements are briefly reviewed (more details can be found in [32]). These are the background estimation, the evaluation of the -hadron momentum, and the decay length reconstruction.
The background can be due either to physics processes leading to a final state similar to that used to tag the signal, or to accidental combinations of tracks which simulate the decay of interest. When “physics” background is present, the experimental uncertainties on the branching fractions of the background processes and on the lifetimes of the background particles lead to a systematic error which is correlated between different experiments. When the background is combinatorial, the amount and/or the lifetime of the background “particles” is normally extracted from the data using the sidebands of mass distributions or wrong sign combinations. In this case the related systematic uncertainty is usually not correlated between experiments. But, in the measurement of the -baryon lifetime using correlations, the amount of accidental background is obtained from the wrong sign combinations and a correction, common to all analyses, has to be applied to this number to take into account the production asymmetry of accidental pairs.
Most of the exclusive B lifetime measurements are based on the reconstruction of B decay length and momentum. In most analyses the B particles are only partially reconstructed, and their energies are estimated from the energies of the detected decay products. In all cases, systematic uncertainties have been evaluated for the following effects:
-
•
determination of the -quark fragmentation function,
-
•
branching fractions of B and charmed hadrons,
-
•
-hadron masses,
-
•
-baryon polarization and
-
•
modelling of neutral hadronic energy.
Finally there are uncertainties correlated within an experiment. They are due to primary and secondary vertex reconstruction procedures, detector resolution, tracking errors, B flight direction reconstruction and detector alignment.
3.2 Measurements of and lifetimes
Apart from the measurements by CDF using large samples of exclusive and decays, the most precise measurements of and lifetimes originate from two classes of partially reconstructed decays. In the first class the decay is used in which the charge of the charmed meson distinguishes between neutral and charged B mesons. In the second class the charge attached to the B decay vertex is used to achieve this separation.
The following sources of correlated systematic uncertainties have been considered: background composition (includes branching fraction uncertainties as obtained in Section 2), momentum estimation, lifetimes of and -baryons (as obtained in Sections 3.3 and 3.4), and fractions of and -baryons produced in decays (as measured in Section 4.1).
The world average lifetimes of and mesons are:
| (21) | |||||
| (22) |
The several measurements and the average values are shown in Figure 1.
3.3 lifetime measurements
The most precise measurements of the lifetime originate from partially reconstructed decays in which a meson has been completely reconstructed (see Figure 2-left).
The following sources of correlated systematic uncertainties have been considered: average -hadron lifetime used for backgrounds, decay multiplicity, and branching fractions of B and charmed hadrons.
The world average lifetime of mesons is equal to:
| (23) |
3.4 -baryon lifetime measurements
The most precise measurements of the -baryon lifetime originate from two classes of partially reconstructed decays (see Figure 2-right). In the first class, decays with an exclusively reconstructed baryon and a lepton of opposite charge are used. In the second class, more inclusive final states with a baryon () and a lepton have been used.
The following sources of correlated systematic uncertainties have been considered: experimental time resolution within a given experiment, -quark fragmentation distribution into weakly decaying -baryons, polarization, decay model, and evaluation of the -baryon purity in the selected event samples. As the measured -hadron lifetime is proportional to the assumed -hadron mass, the central values of the masses are scaled to m() = () and m(-baryon) = () , before computing the averages. Uncertainties related to the decay model include mostly assumptions on the fraction of -body decays. To be conservative it is assumed that they are correlated whenever given as an error. Furthermore, in computing the average, results have been corrected for the effect of the measured value of the polarization and it has been assumed that -baryons have the same fragmentation distribution as all -hadrons (Section 2).
The world average lifetime of -baryons is then:
| (24) |
This value and the single measurements are given in Figure 2-right.
Keeping only and final states, as representative of the baryon, the following lifetime is obtained:
| (25) |
Averaging the measurements based on the final states gives a lifetime value for a sample of events containing and baryons:
| (26) |
3.5 Average -hadron lifetime
Available results have been divided into three different sets and a separate average has been computed for each set (see Figure 3-left):
-
(1)
measurements at LEP and SLD which accept any -hadron decay:
(27) -
(2)
measurements at LEP based on the identification of a lepton from a -hadron decay:
(28) -
(3)
measurement at CDF based on the identification of a J/ from a -hadron decay:
(29)
The reason for this division is that, since the lifetimes of the individual -hadron species are different, a meaningful average lifetime can only be computed for samples in which the composition is the same.
The following sources of correlated systematic uncertainties have been considered when evaluating the averages: - and -quark fragmentation and decay models, BR(), BR( c ), , BR(c ) and the charged track multiplicity in -hadron decays (see Table 1).
The measurement in Set 1 is the average -hadron lifetime for a sample of weakly decaying -hadrons produced in decays.
| (30) |
The measurements of Set 2 are based on a sample enriched with with respect to other production fractions, and thus are expected to correspond to a higher average lifetime. In practice this difference is expected to be small. Assuming that all -hadrons have the same semileptonic partial width, the average lifetimes in the inclusive and semileptonic samples can be related using the measured values of the production rates (Section 4) and lifetimes of the different types of -hadrons, giving:
| (31) |
Finally the CDF measurement probably corresponds to a different composition in -hadron species compared to any of the previous sets of measurements.
As a consequence, the average -lifetime, , is obtained by combining the values of and only, and neglecting the small correction expected in Equation (31):
| (32) |
The difference between the values of and amounts to less than two standard deviations.
3.6 -hadron lifetime ratios
Ratios of other -hadron lifetimes to the lifetime have also been determined, using the previous averages of the individual lifetimes and the direct measurements of the ratio between and lifetimes shown in Figure 3-right. The results are given in Table 2.
| Lifetime ratio | Measured value |
|---|---|
It can be seen that the predictions [71] for the meson lifetimes based on factorization, given in Equation (33), which had encountered theoretical criticism [72], are on the mark. A recent lattice study [73] finds a result quite consistent with [71].
| (33) |
However a large discrepancy is observed for baryons. It remains to be clarified if this problem is related only to the validity of the quark models used to determine the parameters in the case of baryons, as was suggested in reference [71], or to more basic defects in the whole theoretical picture. Lattice evaluations for -baryons are on the way [74].
4 and oscillations and -hadron production fractions
The four LEP Collaborations and CDF and SLD have published or otherwise released measurements of [75, 76, 77, 78, 79, 80] and lower limits for [81, 82, 83, 84, 85]. Combined results, as well as estimates of -hadron fractions, have been prepared by the B oscillation working group666The present members of the B oscillation working group are: V. Andreev, E. Barberio, G. Boix, C. Bourdarios, P. Checchia, O. Hayes, R. Hawkings, M. Jimack, O. Leroy, S. Mele, H-G. Moser, F. Parodi, M. Paulini, P. Privitera, P. Roudeau, O. Schneider, A. Stocchi, T. Usher, C. Weiser and S. Willocq..
The estimates of the -fractions, described in Section 4.1, are important inputs needed for the combination of the and oscillation results. The procedure used to combine results is explained in Section 4.2, followed by a description of the common systematic uncertainties in the analyses, and the result for the mean value of . Then combined results on the oscillation amplitude, as well as an overall lower limit on are presented in Section 4.3. More details on these procedures can be found in reference [86].
4.1 Measurements of -hadron production rates in -jets
In this analysis, the relative production rates of the different types of weakly-decaying -hadrons are assumed to be similar in -jets originating from decays and in high transverse momentum -jets in collisions at 1.8 TeV. This hypothesis can be justified by considering the last steps of jet hadronization to be a non-perturbative QCD process occurring at a scale of order .
Direct information on production rates is available from measurements of branching fraction products using channels with characteristic signatures. All the measurements used in the present analysis are listed in Appendix D.
At CDF and LEP, the production rate has been evaluated using events with a accompanied by a lepton of opposite sign in the final state (Table 21). Since the rate of these events is given by , it is necessary to evaluate . This has been done by assuming, from SU(3) symmetry, that the partial semileptonic decay widths into D, and final states are the same for all B mesons. A lower value for the semileptonic branching fraction with a in the final state is obtained by assuming that all states decay into a non-strange D meson. The branching fraction corresponding to is obtained using Equation (1) multiplied by the lifetime ratio . This corresponds to a lower limit on production because the possibility that states decay into or has been neglected. In addition, assuming that only the measured final state in or semileptonic decays corresponds to transitions for the , an upper value can be obtained for the decay of interest using the relation:
| (34) |
based on isospin symmetry. In practice, the lower and upper values are compatible within uncertainties. This allows to be extracted from the LEP measurements. Using the same assumptions, the CDF Collaboration has measured the ratio from final states with an electron and a charm meson () [90]777CDF has published a second measurement of the same ratio, using double semileptonic B decays with and final states as characteristic signatures for and non-strange B mesons [92]. At present, this result has not been included in the average for -hadron production fractions because of difficulties in properly correlating certain assumptions in that analysis with the other measurements..
In a similar way, the fraction of -baryons is estimated from the measured production rates of [93, 94] and [95, 96] final states (Table 22) yielding, respectively, and . The value for BR() has been obtained considering that there could be one produced in every decay or, at the other extreme, that all excited charmed baryons, assumed to be produced with a rate similar to final states in B mesons, decay into a D meson and a non-charmed baryon. Similar considerations have been applied to semileptonic decays. The semileptonic decay width ) has been taken to be equal to ) and it has been assumed that, within present uncertainties, BR = BR. The total -baryon production rate is then: , assuming the same production rates for and baryons. This is then averaged with a direct measurement of from the number of protons in -events [97]. Finally, the CDF Collaboration has measured the production rate of -baryons relative to non-strange B mesons, , using final states [90].
The fraction of mesons has also been measured [98] using the charge of a large sample of inclusively reconstructed secondary vertices: (Table 23).
All these measurements have been combined to obtain average production rates for , -baryons, and 888The production of mesons and of other weakly decaying states made of several heavy quarks has been neglected., imposing that:
| (35) |
and
| (36) |
The results obtained are given in Table 3. Correlated systematics between the different measurements, coming mainly from the poorly measured branching fractions of and charmed hadrons, have been taken into account. It may be noted that constraint (36) is expected to be true for -mesons even though it is known to be wrong for -mesons. In -jets, and also in -jets, isospin invariance of strong interactions predicts similar production rates of mesons in which the heavy quark is associated to a or antiquark. Strong and electromagnetic decays of these states result in different rates for weakly decaying mesons with a or a flavour because the decays occur very close to threshold, and the threshold prevents the transition . However for and mesons, no asymmetry is expected: mesons decay electromagnetically, leaving the flavour of the light spectator quark in the -meson unchanged; non-strange mesons decaying through strong interactions and having masses away from threshold will not induce any asymmetry either; mesons decay also by strong interactions into or with equal probabilities, although a possible tiny difference between these two rates can be expected for decays of narrow states occurring very close to threshold, because of the mass difference between and mesons999The mass difference between and mesons is compatible with zero within ..
| -hadron fractions | correlation coefficients |
|---|---|
| = | |
| = | |
| = | , |
Additional information on the production rates can be obtained from measurements of the time-integrated mixing probability of -hadrons. For an unbiased sample of semileptonic -hadron decays in -jets, with fractions and of and mesons, this mixing probability is equal to:
| (37) |
where is the time-integrated mixing probability for mesons (see Section 4.2) and =1/2 is the corresponding quantity for mesons101010The assumption can be justified by the existence of limits on obtained from -lepton analyses, which have negligible dependence on .. As already mentioned in Section 2, the semileptonic width is assumed to be the same for all -hadron species, implying , where are the lifetime ratios. This leads to the relation:
| (38) |
where . This is used to extract another determination of from the -baryon fraction of Table 3, the lifetime ratio averages of Table 2, the world average value of from Equation (47) of Section 4.2, and the average from the LEPEWWG (see Table 1). This new estimate of , , is then combined with the -hadron rates from direct measurements, taking into account correlations111111 There is a small statistical correlation between and , arising from the fact that a few analyses at LEP are based on the same samples of dilepton events as the ones used to extract . This correlation is ignored, with a negligible effect on the final result. and imposing the conditions (35) and (36). The final -hadron fractions are displayed in Table 4.
| -hadron fractions | correlation coefficients |
|---|---|
| = | |
| = | |
| = | , |
The production rate for states is expected to be rather similar to the probability () for creating an pair during the hadronization process. But, because of their masses, non strange mesons are not expected to decay into , whereas strange mesons are expected to decay mainly into non-strange weakly decaying -mesons. As a result, the fraction of in -jets is expected to be given by , as observed.
4.2 Combination method for
The measurements of are now quite precise and it is important that the correlated systematic uncertainties are correctly handled. Furthermore, many results depend on physics parameters for which different values were used in the original analyses. Before being combined, the measurements of are therefore adjusted on the basis of a common consistent set of input values.
For each input parameter the measurement and the corresponding systematic uncertainty are linearly rescaled in accordance with the difference between the originally used parameter value and error, and the new common values. This is done for the systematic uncertainties originating from the -hadron lifetimes, the -hadron fractions and the mixing parameters and . The statistical and systematic uncertainties of each individual measurement are symmetrized. An alternative approach using asymmetric uncertainties (when quoted as such) would produce negligible differences in the combined result.
The combination procedure makes a common fit of and the common input parameters. It is assumed that may be expressed as a function with a weak dependence on the systematic sources . Expanding then gives:
| (39) |
where the quantities are the correlated errors on from systematic sources , and . In this last expression, and are the input and fitted values of the systematic parameter , and is the variation used to calculate .
The following is then constructed:
| (40) |
where are the measurements of and the quadratic sum of the statistical and uncorrelated systematic uncertainties on . This is minimized with respect to the parameters and ; the result for is taken as the value of at the minimum (and the values of at the minimum are ignored). This method gives the same results as a minimization with inversion of a global correlation matrix. As several measurements also have a statistical correlation, the first sum in Equation (40) is then generalized to handle an error matrix describing the statistical and uncorrelated systematic uncertainties.
The following sources of systematic uncertainties, common to analyses from different experiments, have been considered:
-
•
-lifetime measurements (Section 3). Different measurements use the -hadron lifetimes in different ways as input: some use the actual lifetimes, and others use ratios of lifetimes. As this leads to complicated correlations between the analyses, the following procedure is adopted. For each measurement a single combined value of all -lifetime-related systematic uncertainties is computed. This systematic is then treated as fully correlated with all other such numbers from the other measurements. Tests show that this procedure gives a negligible bias and results in a conservative evaluation of the uncertainty.
-
•
-quark fragmentation (Section 2). In some analyses the -hadron momentum dependence is treated through the variation of the parameter in the Peterson fragmentation function, and in others through the mean scaled -hadron energy . In such a case, the corresponding systematic uncertainties are treated as fully correlated, without attempting to adjust the individual results to a common value of or .
-
•
fraction of cascade decays (Section 2), related mainly to the value of BR.
-
•
fraction of mesons remaining in enriched samples for analyses using mesons. This depends on decay branching fractions and on the mistag probability.
-
•
production rate of mesons in -hadron semileptonic decays (Section 2).
-
•
-hadron fractions (Section 4.1).
-
•
lifetime ([4]).
Common systematics due to purely experiment-dependent factors (i.e. common to different results in a particular experiment) have not been included in the above list, but nonetheless are treated as correlated in the fit.
Following this procedure, a combined value:
| (42) |
is obtained. Using the relation121212Equation (43) assumes that there is no decay width difference in the system.:
| (43) |
and the lifetime of Section 3, the above result can be converted to:
| (45) |
Averaging with the time-integrated mixing results obtained by ARGUS and CLEO at the (4S) (see Table 1), yields finally:
| (47) |
or equivalently
| (49) |
The individual measurements of and their combined value are shown in Figure 4.
The determination of as described above and of the -hadron fractions described in Section 4.1 cannot be performed sequentially: the values of the fractions are needed to perform the fit, and the best estimates of the fractions can be obtained only once the final average is known. This circular dependence has been handled by including the calculation of the fractions in the fitting procedure, in such a way that the final results quoted for and the -hadron fractions form a consistent set.
4.3 Combination method for oscillation amplitudes and derived limits on
No experiment has yet directly observed oscillations, so the task of a combination procedure is to calculate an overall limit or to quantify the evidence for a signal from the information provided by each measurement. This is done using the amplitude method of reference [99]. At each value of , in the range of interest, an amplitude is measured in each analysis, where the expected value of the amplitude is unity at the true frequency. An overall limit on is then inferred from the combined amplitude spectrum by excluding regions of where the amplitude is incompatible with unity.
Studies with Monte Carlo simulation show that the measured amplitude has a Gaussian distribution around its expected value, which is zero for frequencies much lower than the true one, and unity at the true frequency. In addition, the error on the amplitude depends on the statistical power of the analysis but not on the true value of the oscillation frequency. Therefore, if at a given frequency () a measured amplitude () with error is found, this value of the frequency can be excluded at the 95% C.L. if the probability of measuring an amplitude equal or smaller than , for a true amplitude of unity, is smaller than 5%, that is , or equivalently where is the Gaussian function.
Before combining the measured amplitudes, the individual central values and systematic uncertainties are adjusted, using the same procedure as for measurements, to common values of the -hadron fractions (Table 4), -hadron lifetimes (Section 3), and (Equation (49)). The adjustment to a common value of is performed first, and needs a special treatment for certain analyses, as explained below. Although the final value of is calculated under the assumption that mixing is maximal, studies indicate that the effect on the combined result is negligible.
The statistical uncertainty on the measured amplitude is expected to be inversely proportional to the purity of the analysed sample [99]. This purity is of the order of for inclusive analyses. For analyses where a full or partial reconstruction is performed, the purity is much less dependent on the assumed value of . Therefore, the statistical uncertainties on the amplitudes measured in inclusive analyses have been multiplied by , where is the fraction assumed in the corresponding analysis, and is the fraction from Table 4. This correction is also applied on the central values of the amplitude measured in inclusive analyses, after having checked that the relative uncertainty on the amplitude is essentially independent of for large enough values of .
The amplitudes (measured at each value of ) are averaged using the same procedure as for the combination of results. In addition to systematics which are correlated within the individual experiments, the following sources of correlated systematic uncertainties have been taken into account:
-
•
-hadron lifetime measurements,
-
•
-quark fragmentation,
-
•
direct and cascade semileptonic branching fractions of -hadrons,
-
•
-hadron fractions,
-
•
measurements,
-
•
measurements.
Data using the amplitude method have been provided by ALEPH, DELPHI, OPAL (for their lepton-jet analysis only131313The OPAL Collaboration has other results on searches for oscillations which are not included in this combination (see reference [84] for details).), CDF and SLD. The combined amplitude spectrum is shown in Figure 5. All values of below 14.3 are excluded at the 95% CL. The combined expected sensitivity to , defined as the largest value of that would have been excluded if the combined amplitudes were zero at all values of , is 14.5 . In Figure 6 the values of the amplitude at from the various analyses, are shown. In addition, the sensitivities are given.
Positive measured amplitudes are found for frequency values near and above the sensitivity limit. Some values deviate from zero by more than twice the total estimated error. The likelihood profile obtained from the amplitude spectrum, using the prescription of [99], shows a minimum at 16.3 . The likelihood value at this minimum is 1.9 units below the asymptotic likelihood value for . Because the measurements at different frequencies are correlated, it is not possible to calculate analytically the probability that, in the explored frequency range, a fluctuation as or more unlikely occurs in a sample where the true frequency is far beyond the sensitivity. Therefore, an estimation procedure based on fast Monte Carlo experiments has been developed [100]: the above probability is found to be , where the quoted uncertainty is due to the assumptions and approximations adopted in the fast Monte Carlo generation.
5 Limit on the decay width difference for mass eigenstates in the - system
The CKM picture of weak charge-changing transitions predicts that the and its charge conjugate mix. This results in new states and , with masses and and (probably) different widths and .
Neglecting CP violation, the mass eigenstates are also CP eigenstates, the being CP even and being CP odd. The decay of a meson via the quark subprocess gives rise to predominantly CP-even eigenstates, thus the CP-even eigenstate should have the greater decay rate and hence the shorter lifetime. For convenience of notation, in the following we therefore substitute and , and define and .
Theoretical calculations [101] of the ratio at next-to-leading order give:
| (50) |
where is the decay constant and where and are bag parameters. Using the values from recent lattice calculations [102] of , and yields , where the uncertainties are from and respectively. Care should be taken here as the values for the bag constants are preliminary and are correctly normalised at one loop only, so there may be some additional systematic uncertainty to be included.
The width difference and the mass difference are correlated ( to first approximation [103]), thus offering the possibility of measuring via the lifetime difference rather than the oscillation frequency. This could be particularly important if the oscillation frequency is too fast to be measured with the present experimental proper time resolution. In addition, if does turn out to be sizable, the observation of CP violation and the measurement of CKM phases from untagged samples can be imagined [104].
The existing experimental constraints on the width difference and the combination of these constraints are reported here141414The present members of the working group are: P. Coyle, D. Lucchesi, S. Mele, F. Parodi and P. Spagnolo..
5.1 Experimental constraints on
Experimental information on can be extracted by studying the proper time distribution of data samples enriched in mesons. An alternative method based on measuring the branching fraction has also been proposed recently [106]. The available results are summarised in Table 5. The values of the limit on quoted in the last column of this table have been obtained by the working group.
Methods based on double exponential lifetime fits to samples containing a mixture of CP eigenstates have a quadratic sensitivity to (inclusive, semileptonic, -hadron), whereas methods based on isolating a single CP eigenstate have a linear dependence on (, ). The latter are therefore, in principle, more sensitive to ; but they tend to suffer from reduced statistics.
In order to obtain an improved limit on , the results based on fits to the proper time distributions are used to apply a constraint on the allowed range of . The world average lifetime is not used, as its meaning is not clear if is non-zero. Instead, it is chosen to constrain to the world average lifetime ( ps). This is well motivated theoretically, as the total widths of the and mesons are expected to be equal within less than one percent [71, 108] and is expected to be negligible.
Further information on the various individual measurements is now given.
| Experiment | Selection | Measurement | |
|---|---|---|---|
| L3 [40] | inclusive -sample | ||
| DELPHI [49] | ps | ||
| OTHERS [105] | ps | ||
| ALEPH [106] | |||
| ALEPH [106] | ps | ||
| DELPHI [107] | hadron | ps | |
| CDF [36] | ps |
-
•
L3 inclusive -sample: in an unbiased inclusive B sample, all decay modes are measured, including decays into CP eigenstates. An equal number of and mesons are therefore selected, and the proper time dependence of the signal is given by:
(51) If the proper time dependence of this sample is fitted assuming only a single exponential lifetime then, using the definitions of and and assuming that is small, the measured lifetime is given by:
(52) L3 effectively incorporates into the proper time fit of an inclusive -sample and applies the constraint ps.
-
•
DELPHI : in a semileptonic selection, the ratio of short and long ’s selected is proportional to the ratio of the decay widths and the proper time dependence of the signal is:
(53) If this sample is fitted assuming only a single exponential lifetime for the , then the measured lifetime is, always in the limit that is small, given by:
(54) The single lifetime fit is thus more sensitive to the effects of in the semileptonic than in the fully inclusive case. Information on is obtained by scanning the likelihood as a function the two parameters and and applying the constraint.
-
•
OTHERS: other analyses of the semileptonic lifetime [105] have not explicitly considered the possibility of a non-zero value. Nevertheless, the fact that the single exponential lifetime for this case (Equation (54)) is sensitive to allows information on to be extracted. The average semileptonic lifetime has been recalculated excluding the DELPHI result just discussed, and information on has been obtained by using Equation (54) and applying the constraint. The validity of Equation (54) in the presence of background contributions has been verified using a toy Monte Carlo [109].
-
•
ALEPH (counting method): only those decays which are CP eigenstates can contribute to a width difference between the CP even and CP odd states. An analysis [111] of such decays shows that is by far the dominant contribution and is almost 100% CP even. Under this assumption, where:
(55) ALEPH [106] has measured this branching fraction, and this is the only constraint on which does not rely on a measurement of the average () lifetime.
-
•
ALEPH (lifetime method): as the decay , is predominantly CP even, the proper time dependence of the component of the sample is therefore just a simple exponential with the appropriate lifetime:
(56) This lifetime is related to and via the expression:
(57) ALEPH [106] has measured the lifetime of events and extracted information on with the help of the world average lifetime obtained from semileptonic decays. The result listed in Table 5 has been obtained by the working group with the assumption .
-
•
DELPHI inclusive : a fully inclusive selection is expected to have an increased CP-even content, as the contribution is enhanced by the selection criteria. If is the fraction of in the sample, then the proper time dependence is expected to be:
(58) in which and are defined in Equations (53) and (56) respectively. For the DELPHI analysis a value is estimated from simulation. Scanning the likelihood as a function and and applying the constraint yields an upper limit on .
-
•
CDF : the final state is thought to be predominantly CP even (i.e. measures mainly ) [111]. An update [110] of the CDF measurement of the polarization in decays measures the fraction of CP even in the final state to be and supports this expectation. For this case, the proper time dependence of the component of the sample is:
(59) where has been defined in Equation (56). CDF measures the lifetime of events and information on is obtained after applying the constraint and including the experimental uncertainty on .
5.2 Combined limit on
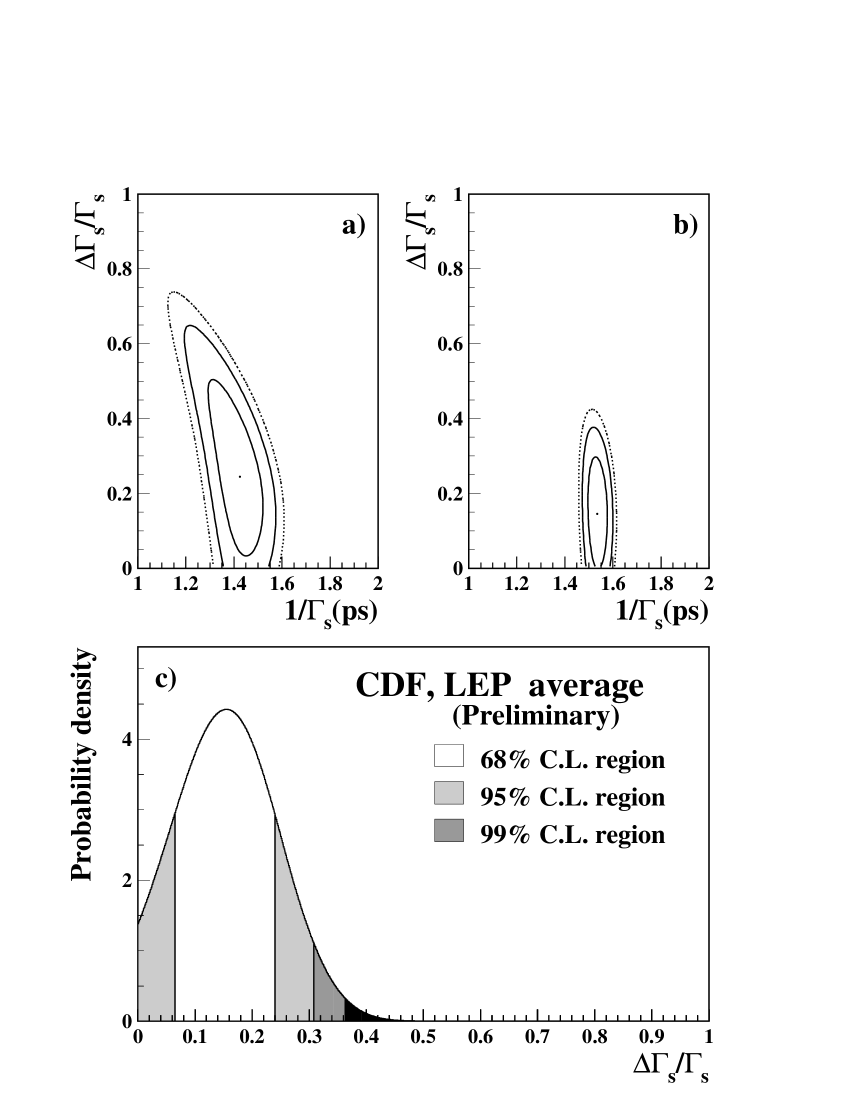
In order to combine the analyses summarised in Table 5, the result of each analysis has been converted to a two-dimensional log-likelihood in the (, ) plane. This log-likelihood has either been provided by each experiment or reconstructed from the measured lifetimes using the expected dependence of this quantity on and . The latter procedure was necessary for the OTHERS and CDF entries of Table 5. The L3 analysis is not included in the average as the two-dimensional likelihood was not provided and could not be reconstructed from the available information. The constraint is not applied on at this stage. Systematic uncertainties are included in the individual log-likelihood distributions.
The log-likelihood distributions have been summed and the variation of the global negative log-likelihood function has been measured with respect to its minimum (). The 68%, 95% and 99% C.L. contours of the combined negative log-likelihood are shown in Figure 7a. The corresponding limit on is:
| (60) |
An improved limit on can be obtained by applying the constraint. When expressed as a probability density, this constraint is:
| (62) |
The value of the uncertainty includes, eventually, the theoretical uncertainty on the equality , expected to be of the order of 1 or less. Using Bayes theorem, the probability density for , with the constraint applied 151515A flat, a priori probability density distribution has been assumed for ., is obtained by convoluting with the 2-D probability density for and (), and normalizing the result to unity:
| (63) |
where is proportional to .
The two-dimensional log-likelihood obtained, after including the constraint, supposed to be exact, is shown in Figure 7b. The resulting probability density distribution for is shown in Figure 7c. The corresponding limit on is:
| (64) |
If an additional 2 uncertainty, assumed to be Gaussian distributed, is incorporated to account for the theory assumption , the effect on the result is small:
| (65) |
6 Average of LEP measurements
Within the framework of the Standard Model of electroweak interactions, the elements of the Cabibbo-Kobayashi-Maskawa mixing matrix are free parameters, constrained only by the requirement that the matrix be unitary. The Operator Product Expansion (OPE) and Heavy Quark Effective Theory (HQET) provide means to determine with relatively small theoretical uncertainties, by studying the decay rates of inclusive and exclusive semileptonic -decays respectively. Relevant branching fractions have to be determined experimentally. Inputs from theory are needed to obtain the values of the matrix elements.
There are two methods to measure : the inclusive method, which uses the semileptonic decay width of -decays and the OPE; and the exclusive method, where is extracted by studying the exclusive decay process using HQET. The channel has not been averaged to date.
In this note, both methods are used to determine values for , which are then combined to produce a single average161616The present members of the working group are: D. Abbaneo, E. Barberio, S. Blyth, M. Calvi, P. Gagnon, R. Hawkings, M. Margoni, S. Mele, F. Muheim, D. Rousseau and F. Simonetto.. The semileptonic -decay width, determined by the LEP heavy flavour electroweak fit to ALEPH, DELPHI, L3 and OPAL data, is used to determine . Results from ALEPH [112]171717 Updated to use the parametrisation of [115], the Ligeti model [21, 116] for decays, and various updated inputs., DELPHI [113]181818Updated to use the Ligeti model [21] for decays. and OPAL [114] are used to perform a LEP average in the decay channel. These measurements are combined using a method similar to that used by the B oscillations working group.
Theoretical input parameters needed to extract from actual measurements are detailed in Appendix E. In both analyses, the validity of the quark/hadron duality hypothesis has been assumed.
6.1 Inclusive determination
In the inclusive method, the partial width for semileptonic B meson decays to charmed mesons is related to using the following expression (Appendix E):
| (66) | |||||
where represents all final states containing a charmed quark. The rest of the expression, within parentheses, represents the correction to the muon decay formalism, depending on the - and -quark masses and on the strong coupling constant; is the average of the square of the -quark momentum inside the -hadron. The three last contributions to the uncertainty correspond respectively, to the uncertainties coming from the QCD perturbative expansion (scale dependence, truncation at finite order, ..), from the -quark mass determination and from neglected terms of order , with , appearing in the O.P.E. formalism.
Experimentally, the semileptonic width of -hadrons is determined from its semileptonic branching fraction and lifetime. In decays, a mixture of and -baryons is produced, such that the inclusive semileptonic branching fraction measured at LEP is an average over the different hadrons produced:
| (67) | |||||
where is the average -hadron lifetime. Therefore the semileptonic width of -hadrons can be obtained using the inclusive semileptonic branching fraction and the average -hadron lifetime. The two last equalities in Equation (67) assume that all -hadrons have the same semileptonic width. This hypothesis may be incorrect for -baryons. Taking into account the present precision of LEP measurements of -baryon semileptonic branching fractions and lifetimes, an estimate of the correction to Equation (67) is about 1.5% (see Section 2).
The average LEP value for is taken from the global fit which combines the heavy flavour measurements performed at the (see Section 2). The contribution is subtracted from , using the LEP average value given in Section 7. For the average -hadron lifetime, the world average value of is used, as obtained in Equation (32).
6.1.1 Sources of systematic errors
The systematic errors assumed at present in the determination of the inclusive semileptonic decay width can be grouped into the following categories:
-
•
errors related to the efficiency and purity of the -tagging algorithm.
As a lifetime -tag is involved, effects due to the uncertainties in the sample composition in terms of different heavy hadrons, and uncertainties in the heavy hadron lifetimes, are considered.
-
•
input parameters influencing the signal and background normalisation.
-
•
the average fraction of the beam energy carried by the weakly decaying -hadron.
Different models have been considered for the shape of the fragmentation function and the free parameters of the models have been determined from the data.
-
•
polarization.
These effects on the lepton spectra have been included.
-
•
semileptonic decay models.
-
•
detector specific items.
These include: lepton efficiencies, misidentification probabilities, detector resolution effects, jet reconstruction, etc.
The errors listed in the last item are uncorrelated among the different experiments. The others have been split into their uncorrelated and correlated parts. The error on the average -hadron lifetime is assumed to be uncorrelated with the error on the semileptonic branching fraction. The propagation of these errors to the error on is done assuming that they are Gaussian in the branching fraction and the lifetime, respectively.
6.1.2 Inclusive average
Using the expression given in Equation (66), the following value is obtained:
| (68) |
where the first error is experimental and the second is from theory. The experimental contributions due to the semileptonic branching fraction and the lifetime are and , respectively. The dominant systematic uncertainty, of theoretical origin, comes from the determination of the kinetic energy of the -quark inside the -hadron as explained in Appendix E.
6.2 Exclusive determination
In the exclusive method, the value of is extracted by studying the decay rate for the process as a function of the recoil kinematics of the meson. The decay rate is parameterized as a function of the variable , defined as the product of the four-velocities of the and the mesons. This variable is related to the square of the four-momentum transfer from the to the system, , by:
| (69) |
and its values range from , when the is produced at rest in the rest frame, to about . Using HQET, the differential partial width for this decay is given by:
| (70) |
where is a known phase space term and is the hadronic form factor for the decay. Although the shape of this form factor is not known, its magnitude at zero recoil, , can be estimated using HQET. In the heavy quark limit (), coincides with the Isgur-Wise function [117, 118] which is normalised to unity at the point of zero recoil. Corrections to have been calculated to take into account the effects of finite quark masses and QCD corrections [119]. Calculations of this correction yield (Appendix E). Since the phase space factor tends to zero as , the decay rate vanishes at and the accuracy of the extrapolation relies on achieving a reasonably constant reconstruction efficiency in the region close to . The unknown function is approximated with an expansion around due to Caprini, Lellouch and Neubert (CLN) [115]:
| (71) |
where is the slope parameter at zero recoil and . The ratio between the axial and vector form factors is included in . Theoretical predictions restrict values of to be in the range: . An alternative parametrization, obtained earlier, can be found in [116].
6.2.1 Sources of systematic uncertainties
The systematic uncertainties in the determination of using the semileptonic decay can be grouped into the following categories:
-
•
normalisation: meson production rate, branching fraction to the tagged final states (including topological BR), lifetime (this is needed to obtain the decay partial width), and the fragmentation function (which influences the reconstruction efficiency).
-
•
background from physical processes: comprising , (followed by the semileptonic decay ) and, particularly, the intermediate production of excited charm mesons which subsequently decay to a ;
-
•
detector specific items: selection efficiency (lepton identification, tracking, vertexing), non physics background (combinatorial, hadron mis-identification), resolution, fitting, etc. This last set is treated as uncorrelated among experiments, and therefore will be ignored in the following discussion.
6.2.2 Normalisation
The production rate at LEP is given by the product:
| (72) |
The values for the charm meson decay branching fractions are taken from the PDG [4]. Correlations among some of them (e.g. with , etc.) are included. Analyses based on the inclusive reconstruction of pions from cascade decays may be affected by the knowledge of the topological branching fractions 191919A topological branching fraction corresponds to the branching fraction into a fixed number of charged particles emitted in the final state.; they are taken from MARKIII measurements [120].
The lifetime determined in Section 3.2 is used.
Knowledge of the fragmentation function is necessary in order to compute the fraction of which were not reconstructed because they did not have enough energy to be detected. hadrons produced in annihilations carry on average a large fraction, , of the beam energy (Table 1); consequently only a small fraction of them are outside the selection acceptance.
6.2.3 Physics background
Charged mesons can be accompanied by a lepton of opposite charge in two other -hadron decay processes:
-
•
with ,
-
•
with .
Their respective branching fractions have been evaluated in Section 2.3.
The production rates of the different states (see Sections 2.2 and 2.4) and the variation of their corresponding form factors as a function of , have also to be considered. Published results on are based on the old Isgur-Wise model [22], which predicts a sizeable background rate near the end-point spectrum. As a consequence, in this model the error on the overall amount of has a large effect on while having a negligible contribution on the slope parameter . However, HQET predicts that, in the infinite charm mass limit, the rate near is suppressed by a further factor when compared with the signal [20, 121]. In this case, the rate uncertainty would have a large effect on the slope with only a small influence on [113]. However, models in this extreme case fail to predict the ratio (Equation (19)) between the production rates of the two narrow states.
A treatment which accounts for corrections is proposed in [21]. Several possible approximations of the form factors are provided, depending on five different expansion schemes and on three different input parameters. To be conservative, at the present stage of the analysis, each proposed scheme was tested in turn and the input parameters were varied over their full range. The quoted central value corresponds to the arithmetic average of the values obtained with the two extreme models. The systematic error due to the modelling of the background was computed as half the difference between the two extreme results.
6.2.4 Corrections applied to the measurements
Since the three LEP measurements have been performed using different methods and inputs, they must be put on the same footing before being averaged. ALEPH and DELPHI measurements have been updated to use the CLN [115] extrapolation method (71) and the Ligeti [21] model. Since OPAL uses the Caprini-Neubert extrapolation method and the JETSET model, corrections to the OPAL measurement have been estimated using the ALEPH analysis, which is similar.
Corrections for changing to the standard input parameters, listed in Table 7, have been calculated as for the measurement (see Section 4.2). The central value of each analysis is adjusted according to the difference between the used and desired parameter values and the associated systematic error. The systematic error itself is then scaled to reflect the desired uncertainty on the input parameter. Table 6 lists the corrected results for the three experiments.
6.2.5 Exclusive average
The combination method for and is the same as the method used for (see Section 4.2) generalized to the combination of two or more correlated parameters. The LEP average (see Figure 9-right) gives:
| (73) | |||||
| (74) |
The parameters used are listed in Table 1. The uncertainty on the variation with of the form factors is taken to be fully correlated between experiments. The dominant systematic uncertainties on are listed in Table 7. The largest comes from the contribution.
| Source | ||
|---|---|---|
| BR’s | ||
| 1.0 | 0.01 | |
| 1.0 | - | |
| 0.19 | - | |
| 1.2 | - | |
| Background | ||
| 4.5 | 0.16 | |
| 0.20 | - | |
| 0.17 | - | |
| Detector | 2.1 | 0.10 |
| Other inputs | ||
| Fragmentation | 0.9 | - |
| lifetime | 1.2 | - |
| Total syst. | 5.5 | 0.19 |
| Statistical | 2.7 | 0.09 |
The confidence level of the fit is 15%. The error ellipses of the corrected measurements and of the LEP average are shown on Figure 8.
The theoretical estimate, = (see Appendix E), is used to determine:
| (75) |
6.3 Overall average
The combined average (see Figure 9-right) can be extracted taking into account correlations between the inclusive and exclusive methods. The most important source of correlations comes from theoretical uncertainties in the evaluation of , the average momentum of the -quark inside the -hadron (Appendix E). In the determination of experimental systematic uncertainties, theoretical uncertainties in the modelling of decays and the exact amount of decays are taken as fully correlated. If these correlations were neglected, the central value for the average would change by only 0.3%. Uncertainties from lepton identification and background also contribute, but to a much lesser extent. All other sources provide negligible contributions to the correlated error. The various contributions to the uncertainty are categorised in Table 8. The combined value is:
| (76) |
where, within the total error of 1.9, 1.5 comes from uncorrelated sources and 1.2 from correlated sources.
| source | correlated | uncorrelated | ||
|---|---|---|---|---|
| incl. | excl. | incl. | excl. | |
| theory | 2.4% | 2.7% | 4.4% | 5.0% |
| exp. syst. | 0.6% | 4.6% | 0.7% | 3.0% |
| stat. | 0.4% | 2.7% | ||
| total | 2.5% | 5.3% | 4.5% | 6.4% |
7 Average of LEP measurements
The first LEP combined determinations of BR()( or ) and the derivation of have been obtained by combining the results reported by the ALEPH [122], DELPHI [123] and L3 [124] Collaborations202020The present members of the working group are: D. Abbaneo, M. Battaglia, P. Henrard, S. Mele, E. Piotto, Ph. Rosnet and Ch. Schwick.. The three analyses rely on different techniques to measure the inclusive yield of transitions in semileptonic -hadron decays. The experimental details can be found in the original publications. All three experiments reported evidence for the transition and measured its rate BR(). DELPHI fitted directly to the fraction of candidate decays in the selected data sample. For this averaging, the corresponding value of BR() has been derived by using the value of obtained in Section 6.3 and the relationship between and BR() given below.
In order to average these results, the sources of systematic uncertainties have been divided into two categories. The first contains (a) uncorrelated systematics due to experimental systematics, such as lepton identification, -tagging, vertexing efficiency and energy resolution, and (b) uncorrelated systematics from signal modelling and background description. The second contains correlated systematic uncertainties deriving from the simulation of signal and background transitions. The contributions from the statistical, experimental, and uncorrelated and correlated modelling uncertainties are summarised in Table 9.
| Experiment | BR | (stat.) | (exp.) | (uncorrelated) | (correlated) |
|---|---|---|---|---|---|
| ALEPH [122] | 1.73 | 0.48 | 0.29 | 0.29 () | 0.47 () |
| DELPHI [123] | 1.57 | 0.35 | 0.37 | 0.17 () | 0.42 () |
| L3 [124] | 3.30 | 1.00 | 0.80 | 0.68 () | 1.40 () |
The correlated systematics are summarised in Table 10. Differences in the analysis techniques adopted by the three experiments are reflected by the different sizes of the systematics uncertainties estimated from each common source. Important common systematics arise from the D topological branching fractions and the rate of decays. decays represent a potential source of background for decays because both are characterized by a small hadronic mass and a low charged multiplicity. The sensitivity to the topological branching fractions is reduced in the DELPHI analysis by applying a rescaling of the mass of the hadronic system, based on the reconstructed mass, and by the use of identified kaons for separating signal from background events. This explains the different sensitivity of the ALEPH and DELPHI analyses to these two important sources of systematic uncertainty. ALEPH and L3 are sensitive to the uncertainties in the fragmentation function due to the kinematical variables used for discriminating from decays. The DELPHI result is sensitive to the assumed production rates of hadron species due to the use of kaon anti-tagging to reject , thus rejecting also and decays; and it is sensitive to the contribution of and states in semileptonic decays because the resulting difference in the vertex topology is also used for discriminating from decays.
| Source | ALEPH | DELPHI | L3 |
|---|---|---|---|
| species | 0.01 | 0.12 | - |
| fragmentation | 0.22 | 0.03 | 0.32 |
| model | 0.11 | 0.08 | 1.24 |
| model | 0.14 | 0.13 | 0.12 |
| D topological BR’s | 0.31 | 0.06 | - |
| BR(D) | 0.08 | 0.19 | - |
| , production | 0.04 | 0.19 | - |
| inclusive model | 0.18 | 0.08 | 0.25 |
| exclusive model | 0.05 | 0.18 | 0.20 |
| decay model | 0.04 | - | 0.44 |
The systematic uncertainties on the signal have been grouped into inclusive model and exclusive model classes, which are assumed to be fully correlated. The first corresponds to the uncertainty in the modelling of the kinematics of the -quark in the heavy hadron. It has been estimated from the spreads of the results obtained with the ACCMM [125], the Dikeman-Shifman-Uraltsev [126], and the parton [127] models in the ALEPH and DELPHI analyses. In the case of the L3 analysis, the uncertainties in the single pion and in the lepton energy spectra were evaluated from the discrepancies between the model of Ref [128] and the ISGW [22] model respectively to the JETSET 7.4 [129] prediction. The exclusive model uncertainty corresponds to the modelling of the hadronic final state in the decay. These uncertainties have been estimated by replacing the parton shower fragmentation model in JETSET [129] with the fully exclusive ISGW2 [23] model by ALEPH and DELPHI, and by propagating a 100% uncertainty on the rate by L3. ALEPH and L3 have also taken into account the uncertainty from the modelling of the charmless semi-leptonic decay of -baryons. This has not been considered by DELPHI as they remove decays containing identified protons and kaons, thus suppressing the contribution of -baryons as mentioned above. In addition to these sources, ALEPH has estimated a uncertainty from the energy cut-off value for the hybrid model adopted [130]; DELPHI allowed for the -quark pole mass and the expectation value of the kinetic energy operator uncertainties which have been assumed to be uncorrelated.
The three measurements of BR() have been averaged using the Best Linear Unbiased Estimate (B.L.U.E.) technique [131]. Using the inputs from Table 9 and Table 10, the LEP average value for BR() was found to be:
| (77) | |||||
with a confidence level for the combination of 0.70 (see Figure 10).
The value of the element has been extracted using the following relationship derived in the context of (OPE) [132, 133]:
| (78) | |||||
by assuming = (4.58 0.06) (Appendix E).
From the LEP average of ) obtained above, the -lifetime value, , obtained in Section 3, and the quoted uncertainty coming from OPE (4.7 % relative), a probability density function for has been calculated. The resulting distribution is shown in Figure 10-right, where all errors are convoluted together assuming that they are Gaussian in ), with the exception of the OPE error assumed to be Gaussian in . The small part of this function in the negative, unphysical region, corresponding to only 0.14%, has been discarded and the probability density function renormalised accordingly. The median of this function has been chosen as the best estimate of , and and of the integral of the probability density function around this value have been used to define the 1 and 2 confidence regions, denoted hereafter as the 68% and 95% confidence levels, obtaining:
| (79) |
and
| (80) |
All the uncertainties have been included in these estimates. The application of the above procedure for each error source separately yields the following detailed result for the 68% confidence level:
| (81) | |||||
8 Summary of all results
This paper provides precise combined results (see Table 11), from measurements submitted to the 1999 Summer Conferences, on parameters which govern production and decay properties of -hadrons emitted in high energy -quark jets.
At the pole, the polarization of -baryons is found to be significantly different from zero but it is reduced as compared to the initial -quark polarization of . Production of baryons has been invoked [28] to explain this difference.
The accuracy on and lifetimes is better than 2. The lifetime is significantly longer than the lifetime, in agreement with the original expectations based on the OPE and parton-hadron duality [71]. But the clear difference between measured and expected lifetimes of -baryons remains to be explained. It may point to a failure of parton-hadron duality in inclusive B decays, or to a failure of quark models used to evaluate the mean values of operators contributing to -baryon decays.
| -hadron lifetimes | CDF-LEP-SLD, Section 3 |
|---|---|
| ps | |
| ps | |
| ps | |
| ps | |
| ps | |
| ps | |
| ps | |
| -hadron production rates | CDF-LEP, Section 4 |
| oscillations | ARGUS-CDF-CLEO-LEP-SLD, Section 4 |
| at the 95 C.L. | |
| Limit on | CDF-LEP-SLD, Section 5 |
| at the 95 C.L. | |
| Measurement of | LEP, Section 6 |
| Measurement of | LEP, Section 7 |
| polarization in decays | LEP, Section 2 |
The accuracy on and production rates in -quark jets has improved by a factor two as compared to published values [4]. In conjunction with the better determination of the lifetime, this measurement has given a more precise determination of from decays. The fraction in jets is close to 10 with an uncertainty which has been reduced by 30. Its determination is an important input to searches for - oscillations. The accuracy on the -baryon rate has improved by about a factor two because of new measurements using spectator baryons.
The mass difference between mass eigenstates of the - system is measured with a relative precision better than 4. The corresponding quantity for the - system is still unmeasured, in spite of impressive progress in the sensitivity reached by the experiments.
A first combined result on the decay width difference between mass eigenstates of the - system has been obtained.
Because of the very accurate measurements obtained on the inclusive -lifetime and semileptonic branching fraction, the accuracy of determined from inclusive semileptonic decays is entirely limited by theoretical uncertainties. An experimental control of these uncertainties is thus needed. The measurement of from exclusive decays is limited by uncertainties related to production and decay mechanisms. Present experimental results on production characteristics of these states in -hadron semileptonic decays have been detailed in Section 2 of the present report.
The fact that the theoretical uncertainties on the determinations of from inclusive and exclusive measurements are largely uncorrelated has been used in evaluating a global average.
The new measurement of from LEP experiments has reached an accuracy similar to previous determinations at the but with a better sensitivity over a larger fraction of the phase space than in measurements using the lepton energy end-point region.
New measurements from LEP and SLD are still expected in the year 2000 and will improve present determinations of -hadron production and decay properties, which already provide stringent constraints on the shape of the CKM unitarity triangle just before the era of B-factories.
Acknowledgements
We would like to thank the CERN accelerator divisions for the efficient operation of the LEP accelerator, and their close collaboration with the four experiments. We would like to thank members of the CDF and SLD Collaborations for making results available to us in advance of the conferences and for useful discussions concerning their combination. Useful contacts with members of the CLEO Collaboration are also acknowledged. We thank W. Venus for a careful reading of the manuscript and for helpful comments. Finally results on and have been obtained after discussions with several theorists to understand the meaning and the importance of theoretical uncertainties. Among them we would like to thank in particular: M. Beneke, I.I. Bigi, G. Buchalla, F. Defazio, A. Hoang, L. Lellouch, Z. Ligeti and N. Uraltsev.
References
-
[1]
N. Cabibbo, Phys. Rev. Lett. 10 (1963), 531;
M. Kobayashi and K. Maskawa, Prog. Theo. Phys. 49 (1973), 652. - [2] LEP/SLD Electroweak Working Group, A Combination of Preliminary Electoweak Measurements and Constraints on the Standard Model, prepared from contributions of the LEP and SLD experiments to the 1999 Summer conferences, CERN-EP-2000-016.
- [3] LEP/SLD Heavy Flavour Working Group, Input Parameters for the LEP Electroweak Heavy Flavour Results for Summer 1998 Conferences, LEPHF/98-01.
- [4] C. Caso et al., Eur. Phys. J. C3 (1998) 1.
- [5] A. Albrecht et al., ARGUS Collaboration, Z. Phys. C55 (1992) 357; Phys. Lett. B324 (1994) 249.
- [6] J. Bartelt et al., CLEO Collaboration, Phys. Rev. Lett. 71 (1993) 1680.
- [7] C. Peterson et al., Phys. Rev. D27 (1983) 105.
- [8] P. Collins and T. Spiller, J. Phys. G11 (1985) 1289.
- [9] V.G. Kartvelishvili, A.K. Likehoded and V.A. Petrov, Phys. Lett. B78 (1978) 615.
- [10] P. Gagnon, Semileptonic branching fractions at LEP, EPS-HEP99, Tampere (Finland).
- [11] P. Abreu et al., DELPHI Collaboration, Phys. Lett. B347 (1995) 447.
- [12] R. Akers et al., OPAL Collaboration, Z. Phys. C61 (1994) 209.
- [13] A. Albrecht et al., ARGUS Collaboration, Z. Phys. C57 (1993) 533.
- [14] D. Buskulic et al., ALEPH Collaboration, Z. Phys. C73 (1997) 601.
- [15] P. Abreu et al., DELPHI Collaboration, CERN-EP/99-174, accepted by Phys. Lett. B.
- [16] R. Akers et al., OPAL Collaboration, Z. Phys. Rev. C67 (1995) 57.
- [17] R. Barate et al., ALEPH Collaboration, Eur. Phys. J. C4 (1998) 387.
-
[18]
T.E. Coan et al., CLEO Collaboration, Phys. Rev. Lett. 80 (1998) 1150;
L. Gibbons et al., CLEO Collaboration, Phys. Rev. D56 (1997) 3783;
D. Gibaut et al., CLEO Collaboration, Phys. Rev. D53 (1996) 4734;
G. Crawford et al., CLEO Collaboration, Phys. Rev. D45 (1992) 752;
R. Ammar et al., CLEO Collaboration, Phys. Rev. D55 (1997) 13. - [19] S. Anderson et al., CLEO Collaboration, CLEO-CONF-99-6.
- [20] V. Morenas, A. Le Yaouanc, L. Oliver, O. Pene and J.C. Raynal, Phys. Rev. D56 (1997) 5668.
- [21] A.K. Leibovich, Z. Ligeti, I.W. Stewart and M. B. Wise, Phys. Rev. D57 (1998) 308 (hep-ph/9705467) and Phys. Rev. Lett. 78 (1997) 3995 (hep-ph/9703213).
- [22] N. Isgur et al., Phys. Rev. D39 (1989) 799.
- [23] D. Skora and N. Isgur, Phys. Rev. D52 (1995) 2783.
- [24] A. Anastassov et al., CLEO Collaboration, Phys. Rev. Lett. 80 (1998) 4127.
- [25] H. Albrecht et al., ARGUS Collaboration, Phys. Lett. B232 (1989) 398.
-
[26]
P. Avery et al., CLEO Collaboration, Phys. Rev. D41 (1990) 774,
Phys. Lett. B331 (1994) 236. - [27] J.G. Körner, A. Pilaftsis and M. Tung, Z. Phys. C63 (1994) 575.
-
[28]
A.F. Falk and M.E. Peskin, Phys. Rev. D49 (1994) 3320;
J.G. Körner, Nucl. Phys. Proc. Suppl. 50 (1996) 130. - [29] D. Buskulic et al., ALEPH Collaboration, Phys. Lett. B365 (1996) 437.
- [30] P. Abreu et al., DELPHI Collaboration, CERN-EP/99–155, submitted to Phys. Lett. B.
- [31] G. Abbiendi et al., OPAL Collaboration, Phys. Lett. B444 (1998) 539.
-
[32]
Lifetime Working group internal note, Averaging Lifetimes for -hadron Species, http://home.cern.ch/
~claires/lepblife/text/July99_text.ps -
[33]
ALEPH Collaboration, ALEPH 99-005, CONF 99-001, February 25, 1999.
Contribution to the 1999 Winter Conferences. - [34] D. Buskulic et al., ALEPH Collaboration, Zeit. Phys. C71 (1996) 31.
- [35] F. Abe et al., CDF Collaboration, Phys. Rev. D58 (1998) 092002.
- [36] F. Abe et al., CDF Collaboration, Phys. Rev. D57 (1998) 5382.
- [37] P. Abreu et al., DELPHI Collaboration, Zeit. Phys. C68 (1995) 13.
- [38] W. Adam et al., DELPHI Collaboration, Zeit. Phys. C68 (1995) 363.
- [39] P. Abreu et al., DELPHI Collaboration, Zeit. Phys. C74 (1997) 19.
- [40] M. Acciarri et al., L3 Collaboration, Phys. Lett. B438 (1998) 417.
- [41] L3 Collaboration, L3 Note 2142, ICHEP98 Vancouver (Canada).
- [42] R. Akers et al., OPAL Collaboration, Zeit. Phys. C67 (1995) 379.
- [43] G. Abbiendi et al., OPAL Collaboration, Eur. Phys. J C12 (2000) 609.
- [44] K. Abe et al., SLD Collaboration, Phys. Rev. Lett. 79 (1997) 590.
- [45] K. Abe et al., SLD Collaboration, SLAC-PUB-8206, EPS-HEP 99, Tampere (Finland).
- [46] D. Buskulic et al., ALEPH Collaboration, Phys. Lett. B377 (1996) 205.
- [47] D. Buskulic et al., ALEPH Collaboration, Eur. Phys. J C4 (1998) 367.
- [48] F. Abe et al., CDF Collaboration, Phys. Rev. D59 (1999) 032004.
- [49] DELPHI Collaboration, DELPHI 99-109 CONF 296, EPS-HEP99, Tampere (Finland).
- [50] DELPHI Collaboration, DELPHI 97-75 CONF 61, EPS-HEP97, Jerusalem (Israel).
- [51] P. Abreu et al., DELPHI Collaboration, Zeit. Phys. C71 (1996) 11.
- [52] K. Ackerstaff et al., OPAL Collaboration, Phys. Lett. B426 (1998) 161.
- [53] K. Ackerstaff et al., OPAL Collaboration, Eur. Phys. J. C2 (1998) 407.
- [54] D. Buskulic et al., ALEPH Collaboration, Eur. Phys. J. C2 (1998) 197.
- [55] D. Buskulic et al., ALEPH Collaboration, Phys. Lett. B384 (1996) 449.
- [56] F. Abe et al., CDF Collaboration, Phys. Rev. Lett. 77 (1996) 1439.
- [57] P. Abreu et al., DELPHI Collaboration, Eur. Phys. J. C10 (1999) 185.
- [58] P. Abreu et al., DELPHI Collaboration, Zeit. Phys. C71 (1996) 199.
- [59] P. Abreu et al., DELPHI Collaboration, Zeit. Phys. C68 (1995) 541.
- [60] R. Akers et al., OPAL Collaboration, Zeit. Phys. C69 (1996) 195.
- [61] R. Akers et al., OPAL Collaboration, Phys. Lett. B426 (1998) 161.
- [62] D. Buskulic et al., ALEPH Collaboration, Phys. Lett. B369 (1996) 151.
- [63] M. Acciarri et al., L3 Collaboration, Phys. Lett. B416 (1998) 220.
- [64] P.D. Acton et al., OPAL Collaboration, Zeit. Phys. C60 (1993) 217.
- [65] D. Buskulic et al., ALEPH Collaboration, Phys. Lett. B314 (1993) 459.
- [66] ALEPH Collaboration, EPS-HEP97 contributed paper 596, Jerusalem (Israel).
- [67] P. Abreu et al., DELPHI Collaboration, Zeit. Phys. C63 (1994) 3.
- [68] P. Abreu et al., DELPHI Collaboration, Phys. Lett. B377 (1996) 195.
- [69] K. Ackerstaff et al., OPAL Collaboration, Zeit. Phys. C73 (1997) 397.
- [70] K. Abe et al., SLD Collaboration, Phys. Rev. Lett. 75 (1995) 3624.
- [71] G. Bellini, I.I. Bigi and P.J. Dornan, Phys. Rep. 289 (1997) 1 and references therein.
- [72] M. Neubert and C.T. Sachradja, Nucl. Phys. B483 (1997) 339.
- [73] M. Di Pierro and C.T. Sachradja, Nucl. Phys. B534 (1998) 373.
- [74] M. Di Pierro, C.T. Sachradja and C. Michael, preprint hep-lat/9906031.
-
[75]
D. Buskulic et al., ALEPH Collaboration, Z. Phys. C75 (1997) 397;
ALEPH Collaboration, EPS-HEP97 contributed paper 596, Jerusalem (Israel). -
[76]
F. Abe et al., CDF Collaboration, Phys. Rev. Lett. 80 (1998) 2057;
F. Abe et al., CDF Collaboration, Phys. Rev. D59 (1999) 032001;
F. Abe et al., CDF Collaboration, Phys. Rev. D60 (1999) 051101;
F. Abe et al., CDF Collaboration, Phys. Rev. D60 (1999) 072003;
T. Affolder et al., CDF Collaboration, Phys. Rev. D60 (1999) 112004; CDF Collaboration, internal CDF note, see
http://www-cdf.fnal.gov/physics/new/bottom/cdf3791/cdf3791.html;
CDF Collaboration, internal CDF note, see
http://www-cdf.fnal.gov/physics/new/bottom/cdf4526/cdf4526.html. - [77] P. Abreu et al., DELPHI Collaboration, Z. Phys. C76 (1997) 579.
- [78] M. Acciarri et al., L3 Collaboration, Eur. Phys. J. C5 (1998) 195.
-
[79]
G. Alexander et al., OPAL Collaboration, Z. Phys. C72 (1996) 377;
K. Ackerstaff et al., OPAL Collaboration, Z. Phys. C76 (1997) 401;
K. Ackerstaff et al., OPAL Collaboration, Z. Phys. C76 (1997) 417. -
[80]
SLD Collaboration SLAC-PUB-7228, contributed paper PA08-026A
to ICHEP96, Warsaw (Poland);
SLD Collaboration SLAC-PUB-7229, contributed paper PA08-026B to ICHEP96, Warsaw (Poland);
SLD Collaboration SLAC-PUB-7230, contributed paper PA08-027 and 028 to ICHEP96, Warsaw (Poland). -
[81]
R. Barate et al., ALEPH Collaboration, Eur. Phys. J. C4 (1998) 367;
R. Barate et al., ALEPH Collaboration, Eur. Phys. J. C7 (1999) 553. - [82] F. Abe et al., CDF Collaboration, Phys. Rev. Lett. 82 (1999) 3576.
- [83] DELPHI Collaboration, contributed paper 236 to ICHEP 98, Vancouver (Canada) and DELPHI 99-109 CONF 296, EPS-HEP99, Tampere (Finland).
-
[84]
OPAL Collaboration, contributed paper PA08-014 to ICHEP 96 Warsaw;
K. Ackerstaff et al., OPAL Collaboration, Z. Phys. C76 (1997) 401;
K. Ackerstaff et al., OPAL Collaboration, Z. Phys. C76 (1997) 417. - [85] SLD Collaboration, SLAC-PUB-8225, Lepton-Photon 99 Conference, Stanford (USA).
-
[86]
LEP B oscillations Working Group,
http://www.cern.ch/LEPBOSC/writeups/nimpap5/nimpap50.ps. - [87] D. Buskulic et al., ALEPH Collaboration, Phys. Lett. B361 (1995) 221.
- [88] P. Abreu et al., DELPHI Collaboration, Phys. Lett. B289 (1992) 199.
- [89] P.D. Acton et al., OPAL Collaboration, Phys. Lett. B295 (1992) 357.
- [90] T. Affolder et al., CDF Collaboration, Phys. Rev. Lett. 84 (2000) 1663.
- [91] D. Buskulic et al., ALEPH Collaboration, Z. Phys. C69 (1996) 585.
- [92] F. Abe et al., CDF Collaboration, Phys. Rev. D60 (1999) 092005.
- [93] R. Barate et al., ALEPH Collaboration, Eur. Phys. J. C2 (1998) 197.
- [94] P. Abreu et al., DELPHI Collaboration, Z. Phys. C68 (1995) 375.
- [95] D. Buskulic et al., ALEPH Collaboration, Phys. Lett. B384 (1996) 449.
- [96] P. Abreu et al., DELPHI Collaboration, Z. Phys. C68 (1995) 541.
- [97] R. Barate et al., ALEPH Collaboration, Eur. Phys. J. C5 (1998) 205.
- [98] DELPHI Collaboration, EPS-HEP99, contributed paper 5.515.
- [99] H.-G. Moser and A. Roussarie, Nucl. Instrum. Meth. A384 (1997) 491;
- [100] D. Abbaneo and G. Boix, Journal of High Energy Physics JHEP08 (1999) 004.
- [101] M. Beneke et al., Phys. Lett. B459 (1999) 631.
- [102] S. Hashimoto, preprint hep-lat/9909136.
- [103] A.J. Buras, W. Slominski and H. Steger, Nucl. Phys. bf B245 (1984) 369.
- [104] I. Dunietz, Phys. Rev. D52 (1995) 3048.
-
[105]
D. Buskulic et al., ALEPH Collaboration,
Phys. Lett. B377 (1996) 205;
K. Ackerstaff et al., OPAL Collaboration, Phys. Lett. B426 (1998) 161;
F. Abe et al., CDF Collaboration, Phys. Rev. D59 (1999) 032004. - [106] R. Barate et al., ALEPH Collaboration, CERN-EP/2000-036, submitted to Phys. Lett. B.
- [107] The value quoted for the measured lifetime differs slightly from the one quoted in Table 17 because it corresponds to the present status of the analysis in which the information on has been obtained.
- [108] M. Beneke et al., Phys. Rev. D54 (1996) 4419.
- [109] K. Hartkorn and H.G. Moser, Eur. Phys. J. C8 (1999) 381.
- [110] M.P. Schmidt, CDF Collaboration, FERMILAB-CONF-99/174-E, 34th Rencontres de Moriond (1999).
- [111] R. Aleksan et al., Phys. Lett. B316 (1993) 567.
- [112] D. Buskulic et al., ALEPH Collaboration, Phys. Lett. B395 (1997) 373.
- [113] P. Abreu et al., DELPHI Collaboration, DELPHI 99-107 CONF 294, EPS-HEP99, Tampere (Finland).
- [114] K. Ackerstaff et al., OPAL Collaboration, Phys. Lett. B395 (1997) 128.
- [115] I. Caprini, L. Lellouch and M. Neubert, Nucl. Phys. B530 (1998) 153.
- [116] C.G. Boyd, B. Grinstein and R.F. Lebed, Phys. Rev. D56 (1997) 6895.
-
[117]
N. Isgur and M. Wise, Phys. Lett. B232 (1989) 113;
N. Isgur and M. Wise, Phys. Lett. B237 (1990) 527. - [118] A. F. Falk, H. Georgi, B. Grinstein and M. B. Wise, Nucl. Phys. B343 (1990) 1.
- [119] M. Luke, Phys. Lett. B 252 (1990) 447.
- [120] D. Coffman et al., MARKIII Collaboration, Phys. Lett. B263 (1991) 135.
- [121] The BaBar Physics Book, SLAC-R-504, Chapter 8.
- [122] R. Barate et al., ALEPH Collaboration, Eur. Phys. J. C6 (1999) 555.
- [123] M. Battaglia et al., DELPHI Collaboration, CERN-EP/2000-030, accepted by Phys. Lett. B.
- [124] M. Acciarri et al., L3 Collaboration, Phys. Lett. B436 (1998) 174.
- [125] G. Altarelli et al., Nucl. Phys. B208 (1982) 365.
- [126] R. D. Dikeman, M. Shifman and N.G. Uraltsev, Int. J. Mod. Phys. A11 (1996) 571.
- [127] A. Bareiss and E.A. Paschos, Nucl. Phys. B327 (1989) 353.
- [128] G. Burdman and J. Kambor, Phys. Rev. D55 (1997) 2817.
- [129] T. Sjöstrand, Comp. Phys. Comm. 82 (1994) 74.
- [130] C. Ramirez, J.F. Donoghue and G. Burdman, Phys. Rev. D41 (1990) 1496.
- [131] L. Lyons, D. Gibaut and P. Clifford, Nucl. Instr. and Meth. A270 (1988) 110 and references therein. The fit program code blue.f (author: P. Checchia) has been taken from the COMBOS program (authors: O. Schneider and H. Seywerd) developed by the LEP Oscillation Working Group (see http://www.cern.ch/LEPBOSC/combos/).
-
[132]
N. Uraltsev et al., Eur. Phys. J. C4 (1998) 453 and
N. Uraltsev, preprint hep-ph/9905520. -
[133]
A.H. Hoang, Z. Ligeti and A.V. Manohar, Phys. Rev. Lett. 82 (1999)
277;
A.H. Hoang, Z. Ligeti and A.V. Manohar, Phys. Rev. D59 (1999) 074017. - [134] I.I. Bigi, preprint UND-HEP-BIG-99-05.
- [135] K. Melnikov, A. Yelkhovsky, Phys. Rev. D59 (1999) 114009.
- [136] A. H. Hoang, preprint hep-ph/9905550.
- [137] M. Beneke and A. Signer, preprint hep-ph/9906475.
- [138] A. Czarnecki and K. Melnikov, Phys. Rev. Lett. 80 (1998) 3189.
- [139] C. Jin, Phys. Rev. D57 (1998) 6851.
-
[140]
V. Barger, C.S. Kim and R.J.N. Phillips, Phys. Lett. B251 (1997) 225;
A.F. Falk, Z. Ligeti and M.B. Wise, Phys. Lett. B406 (1997) 225;
I.I. Bigi, R. Dikeman and N. Uraltsev, Eur. Phys. J. C4 (1998) 453. -
[141]
C.G. Boyd, B. Grinstein and R.F. Lebed, Phys. Rev. D56 (1997) 6895;
I. Caprini, L. Lellouch and M. Neubert, Nucl. Phys. B530 (1998) 153 and hep-ph/9712417. - [142] I.I. Bigi, M. Shifman and N. Uraltsev, Annu. Rev. Nucl. Part. Sci. 47 (1997) 591.
- [143] N.G. Uraltsev, contribution to the “Informal workshop on the derivation of and : experimental status and theoretical uncertainties”, CERN, June 1999 (see Appendix E).
- [144] M. Neubert, Phys. Lett. B338 (1994) 84.
- [145] A. Kapustin, Z. Ligeti, M.B. Wise and B. Grinstein, Phys. Lett. B375 (1996) 327.
-
[146]
P. Ball and V. Braun, Phys. Rev. D49 (1994) 2472,
E. Bagan, P. Ball, V. Braun and P. Gosdzinsky, Phys. Lett. B342 (1995) 362. -
[147]
I.I. Bigi, M. Shifman, N. Uraltsev and A. Vainshtein,
Phys. Rev. D52 (1995) 196, Int. J. Mod. Phys. A9 (1994) 2467,
M. Shifman, N. Uraltsev and A. Vainshtein, Phys. Rev. D51 (1995) 2217.
Appendix A Production rates of the and mesons in semileptonic -decays
| Experiment | Channel | Value | Ref. |
|---|---|---|---|
| ALEPH | [14] | ||
| ALEPH | [14] | ||
| ALEPH | [14] | ||
| CLEO | [24] |
| Experiment | Channel | Value | Ref. |
|---|---|---|---|
| ALEPH | [14] | ||
| ALEPH | [14] | ||
| ALEPH | [14] | ||
| CLEO | [24] |
Appendix B polarization measurements
Appendix C Measurements used in the evaluation of -hadron lifetimes
In the Tables below, new measurements available since Winter 1999 are labelled with “(n)” and preliminary results with “(p)”.
| Experiment | Method | Data set | (ps) | Reference |
|---|---|---|---|---|
| ALEPH (n, p) | D | 91–95 | 1.524 | [33] |
| ALEPH | Excl. rec. | 91–94 | 1.25 | [34] |
| ALEPH | Partial rec. | 91–94 | 1.49 | [34] |
| CDF | D | 92–95 | 1.474 | [35] |
| CDF | Excl. () | 92–95 | 1.58 0.09 0.02 | [36] |
| DELPHI | D | 91–93 | 1.61 | [37] |
| DELPHI | Charge sec. vtx. | 91–93 | 1.63 0.14 0.13 | [38] |
| DELPHI | Inclusive D | 91–93 | 1.532 0.041 0.040 | [39] |
| L3 | Charge sec. vtx. | 94–95 | 1.52 0.06 0.04 | [40] |
| L3 (p) | Inclusive D | 94 | 1.74 0.12 0.04 | [41] |
| OPAL | D | 91–93 | 1.53 0.12 0.08 | [42] |
| OPAL (n, p) | Charge sec. vtx. | 93–95 | 1.523 0.057 0.053 | [43] |
| SLD | Charge sec. vtx. | 93–95 | 1.56 0.10 | [44] |
| SLD (n, p) | Charge sec. vtx. | 93–98 | 1.565 0.021 0.043 | [45] |
| Average | 1.562 0.029 |
| Experiment | Method | Data set | (ps) | Reference |
|---|---|---|---|---|
| ALEPH (n, p) | D | 91-95 | 1.646 | [33] |
| ALEPH | Excl. rec. | 91-94 | 1.58 | [34] |
| CDF | D | 92-95 | 1.637 | [35] |
| CDF | Excl. () | 92-95 | 1.68 0.07 0.02 | [36] |
| DELPHI | D | 91-93 | 1.61 0.16 0.12 | [37]a |
| DELPHI | Charge sec. vtx. | 91-93 | 1.72 0.08 0.06 | [38]a |
| L3 | Charge sec. vtx. | 94-95 | 1.66 0.06 0.03 | [40] |
| OPAL | D | 91-93 | 1.52 0.14 | [42] |
| OPAL (n, p) | Charge sec. vtx. | 93-95 | 1.643 0.037 0.025 | [43] |
| SLD | Charge sec. vtx. | 93-95 | 1.61 0.07 | [44] |
| SLD (n, p) | Charge sec. vtx. | 93-98 | 1.623 0.020 0.034 | [45] |
| Average | 1.656 0.025 |
a) The combined DELPHI result quoted in [38] is (1.70 0.09) ps.
| Experiment | Method | Data set | (ps) | Reference |
|---|---|---|---|---|
| ALEPH | D | 91-95 | 1.54 0.04 | [46] |
| ALEPH | D | 91-95 | 1.47 0.14 0.08 | [47] |
| CDF (p) | D | 92-96 | 1.36 | [48] |
| CDF | Excl. | 92-95 | 1.34 0.05 | [36] |
| DELPHI (n, p) | D | 91-95 | 1.42 | [49] |
| DELPHI (n, p) | D | 91-95 | 1.49 | [49] |
| DELPHI | Ds inclus. | 91-94 | 1.60 | [51] |
| OPAL | D | 90-95 | 1.50 0.04 | [52] |
| OPAL | Ds inclus. | 90-95 | 1.72 | [53] |
| Average | 1.464 0.057 |
| Experiment | Method | Data set | (ps) | Reference |
|---|---|---|---|---|
| ALEPH | 91-95 | 1.20 0.06 | [54] | |
| DELPHI | vtx | 91-94 | 1.16 | [57]a |
| DELPHI | i.p. | 91-94 | 1.10 | [58]a |
| DELPHI | p | 91-94 | 1.19 0.07 | [57]a |
| OPAL | i.p. | 90-94 | 1.21 0.10 | [60]b |
| OPAL | vtx. | 90-94 | 1.15 0.06 | [60]b |
| Avg. above 6 | ||||
| ALEPH | 91-95 | 1.18 0.03 | [54] | |
| ALEPH | 91-95 | 1.30 0.04 | [54] | |
| CDF | 91-95 | 1.32 0.06 | [56] | |
| DELPHI | 91-94 | 1.11 | [57]a | |
| OPAL | 90-95 | 1.29 0.06 | [61] | |
| Avg. above 5 | ||||
| Avg. above 11 | ||||
| ALEPH | 90-95 | 1.35 | [55] | |
| DELPHI | 91-93 | 1.5 0.3 | [59] | |
| Avg. above 2 |
a) The combined DELPHI result quoted in [57] is (1.14 0.04) ps.
b) The combined OPAL result quoted in [60] is (1.16 0.11 0.06) ps.
| Experiment | Method | Data set | (ps) | Reference |
|---|---|---|---|---|
| ALEPH | Lepton i.p. (3D) | 91-93 | 1.533 0.013 0.022 | [62] |
| L3 | Lepton i.p. (2D) | 91-94 | 1.544 0.016 0.021 | [63]b |
| OPAL | Lepton i.p. (2D) | 90-91 | 1.523 0.034 0.038 | [64] |
| Average set 1 | 1.537 0.020 | |||
| ALEPH | Dipole | 91 | 1.511 0.022 0.078 | [65] |
| ALEPH (p) | Sec. vert. | 91-95 | 1.601 0.004 0.032 | [66] |
| DELPHI | All track i.p.(2D) | 91-92 | 1.542 0.021 0.045 | [67]a |
| DELPHI | Sec. vert. | 91-93 | 1.582 0.011 0.027 | [68]a |
| L3 | Sec. vert. + i.p. | 91-94 | 1.556 0.010 0.017 | [63]b |
| OPAL | Sec. vert. | 91-94 | 1.611 0.010 0.027 | [69] |
| SLD | Sec. vert. | 93 | 1.564 0.030 0.036 | [70] |
| Average set 2 | 1.577 0.016 | |||
| Average sets 1-2 | 1.564 0.014 | |||
| CDF | vert. | 92-95 | 1.533 0.015 | [36] |
a) The combined DELPHI result quoted in [68] is (1.575 0.010 0.026) ps.
b) The combined L3 result quoted in [63] is (1.549 0.009 0.015) ps.
| Experiment | Method | Data set | Ratio | Reference |
|---|---|---|---|---|
| ALEPH (n, p) | D | 91-95 | 1.080 | [33] |
| ALEPH | Excl. rec. | 91-94 | 1.27 | [34] |
| CDF | D | 92-95 | 1.110 | [35] |
| CDF | Excl. () | 92-95 | 1.06 0.07 0.02 | [36] |
| DELPHI | D | 91-93 | 1.00 0.10 | [37] |
| DELPHI | Charge sec. vtx. | 91-93 | 1.06 | [38] |
| L3 | Charge sec. vtx. | 94-95 | 1.09 0.07 0.03 | [40] |
| OPAL | D | 91-93 | 0.99 | [42] |
| OPAL (n) | Charge sec. vtx. | 93-95 | 1.079 0.064 0.041 | [43] |
| SLD | Charge sec. vtx. | 93-95 | 1.03 0.09 | [44] |
| SLD (n, p) | Charge sec. vtx. | 93-98 | 1.037 0.024 | [45] |
| Average | 1.065 0.023 |
Appendix D Measurements of -hadron production rates
D.1 production rate
| Quantity | Value | Ref. | |
|---|---|---|---|
| (2.87 | [87] | ||
| (4.2 | [88] | ||
| (3.9 | [89] | ||
| Average of the three measurements | (3.00 | ||
| (7.7 | [90] | ||
All published results have been multiplied by the branching fraction for the decay to be independent of the assumed central value and uncertainty of this quantity; quoted uncertainties have been reevaluated accordingly.
The ALEPH measurement [91] of has not been used to obtain an additional measurement on because of the model dependence attached to the evaluation of . Instead, the value of , quoted in Table 4, can be used to extract, from this measurement, the inclusive branching fraction for production in decays:
| (82) |
and, using the value for given in Table 1:
| (83) |
D.2 -baryon production rate
| Quantity | Value | Ref. | |
|---|---|---|---|
| (3.78 | [93] | ||
| (5.19 | [94] | ||
| Average of the two measurements | (3.90 | ||
| (5.9 | [90] | ||
| ( 5.4 | [95] | ||
| ( 5.9 | [96] | ||
| Average of the two measurements | (5.5 | ||
| 0.102 | [97] | ||
All published results which are using the baryon have been multiplied by the branching fraction for the decay to be independent of the assumed central value and uncertainty of this quantity; quoted uncertainties have been reevaluated accordingly.
D.3 production rate
| Quantity | Value | Ref. | |
|---|---|---|---|
| 0.414 | [98] | ||
This value is obtained from the measurement of the production rate of charged weakly decaying -hadrons. A small correction has been applied to account for production, as given in Table 22.
Appendix E Theoretical uncertainties relevant to the measurements of and
At beginning of June 1999 a workshop entitled “Informal Workshop on the Derivation of and : Experimental Status and Theory Uncertainties”212121Participants at this workshop were: D. Abbaneo, P. Ball, E. Barberio, M. Battaglia, M. Beneke, I.I. Bigi, G. Buchalla, M. Calvi, O. Cooke, F. Defazio, L. di Ciaccio, R. Fleischer, P. Gagnon, P. Henrard, A. Hoang, L. Lellouch, J. Lu, S. Mele, E. Piotto, Ph. Rosnet, P. Roudeau, D. Rousseau, Ch. Schwick and F. Simonetto. was held at CERN.
As, at that time, there was not a general consensus on the values for theoretical errors to be used to evaluate and [121], the main aim of this workshop has been to scrutinize the uncertainties attached to the different parameters and to define a common set of values to be adopted for the derivation of and . The various contributing systematic uncertainties have been added in quadrature. This procedure is justified when several independent sources of uncertainties contribute, independently of their exact distributions, unless a single source clearly dominates. A linear sum can be justified if uncertainties are fully and positively correlated, which is not really the case of the presently considered quantities. In addition, theoretical errors correspond usually to a confidence level larger than 68, which is the confidence level assumed when these uncertainties are taken as standard deviations of Gaussian distributions.
The procedure adopted in the end which is explained in the conclusions, is not entirely satisfactory; it is simply pragmatic in the absence, at present, of a direct experimental control, or of other evaluations with different theoretical techniques, of the main sources of systematic theoretical uncertainties. More details can be found in [134].
E.1 Measurement of using the decay
Based on studies developed independently by two groups [132, 133], a relative theoretical uncertainty of 5% has been evaluated for the extraction of from the measured inclusive charmless semileptonic rate . The central values of the two analyses also agree222222In practice the initial central value quoted in [132] has been corrected and the value obtained in [133] is ., and the following relationship has been adopted in the extraction of :
| (84) |
There have been extensive discussions concerning the uncertainty to be attributed to the value of , the -quark mass. The analyses reported in [135, 136] independently indicate a range of or less to be assigned to . However during the workshop this narrow mass range raised concerns from a third independent analysis described in [137]. As a result of this ongoing discussion, the value , where the error is meant to define the 68% confidence level, has been adopted here for the derivations of and 232323As explained in Section E.3, in the inclusive determination of , all theoretical uncertainties have in addition been multiplied by two, in a rather arbitrary way..
has been defined in a way which leads to a linear dependence on :
| (85) |
The number specifies the concrete definition within this general class; its value is equal to . More details on the definition of can be found in [138].
There has been a claim [139] that a larger fractional uncertainty of , as well as a 7.5% lower central value for , has to be used. From the arguments which have been developed at the workshop, it has been concluded that the results of the analyses [132, 133] are based on well defined theoretical grounds and that they provide a reliable estimate of the theoretical uncertainties.
Recent measurements performed at LEP, based on the inclusive selection of decays, are sensitive to a large fraction of the mass distribution of the hadronic system and to the full range of the lepton energy spectrum. This mass distribution has been studied by theorists [140] for the transition. The conclusion was242424In practice experimental analyses take into account the expected mass distribution of the hadronic system, and the variation of the detection efficiencies as a function of this mass, to estimate this systematic uncertainty. that the additional theoretical uncertainty on from and is less than 10% if the experimental inclusive technique is sensitive up to at least .
It has thus been concluded that the theoretical errors attached to the determination of using the present experimental technique are under control.
E.2 Measurement of using the decay
It has been proposed to use the parametrization given in [141] to account for the dependence in and to extract the value at of the differential decay rate. The quantity is then obtained.
In order to measure , the value at of the form factor is taken from theory by evaluating different corrections [142] which have to be applied to the naive expectation of :
| (86) |
Expressions for the different terms contributing to this equation can be found in [142]. results from perturbative QCD expansion at the scale . The other quantities are of non-perturbative QCD origin and are obtained in the O.P.E. formalism. It has to be noticed that these terms correspond to an expansion in where the heavy quark can have the or the flavours. In the evaluation of related uncertainties, the charm quark mass determination is thus essential.
The central value of has been recently lowered by 2 by evaluating higher order perturbative corrections [143].
The central value of the -quark mass and its uncertainty are the same as used in Section E.1.
The charm quark mass is obtained from the mass difference , inferred from the measured values of the spin-averaged beauty and charm meson masses 252525 and a similar expression for .:
| (87) |
is the average of the square of the heavy quark momentum inside the B hadron. includes all terms of order , with and its absolute value is expected to be smaller than 15 . The main difference between the theoretical analyses given in [142] and [144] comes from the evaluation of the uncertainties on non-perturbative corrections. A different approach can be found in [145].
The detailed balance of uncertainties given in [142], which has been revised for consistency with the values adopted at present for the different parameters, is the following:
| (88) |
Uncertainties originating from non-perturbative QCD dominate over the perturbative contribution (). The hypotheses or the results on which their contributions were based are reviewed in the following. The label denotes the contribution of excited charmed final states.
E.2.1
The value has been used and it gives uncertainty on . This evaluation has been justified considering that, using QCD sum rules, the following value has been obtained [146]:
| (89) |
and that a model-independent lower bound has been established [147]:
| (90) |
is the expectation value of the chromomagnetic operator.
E.2.2 High mass excitations
In QCD sum rules, used in [142, 144], the effect expected from high mass hadronic states has been introduced in a rather arbitrary way. To be conservative, in [142], it has been assumed that their effect, on the correction terms which behave as , can vary between 0 and 100 of . Such a variation corresponds to on .
E.2.3 Higher order non-perturbative corrections
The value of uncertainty related to the contribution from terms of order at least is obtained in [142].
E.2.4 Adopted value
Combining the uncertainties quoted in (88) gives:
| (91) |
E.2.5 Expected improvements in the control of theoretical errors
The uncertainty attached to “excited states” is expected to be decreased if better measurements of production rates and hadronic mass distributions are obtained262626 denotes all decay modes which are not and ..
The uncertainty related to is expected to decrease by measuring moments of the lepton momentum in the B rest frame.
E.2.6 Form factors for production near to
It has been realized that the -dependence of the form factors used to describe production in -hadron semileptonic decays is important for evaluating the systematic uncertainty on related to the fraction of mesons coming from decays. It has been proposed to use the model described in [21], which predicts a rate for the ratio of 2+ over 1+ narrow states more in agreement with the experimental results given in Section 2. Additional information on production which may bring constraints on such models would be welcome.
E.3 Measurement of using the inclusive semileptonic decay rate
The expression relating to the inclusive semileptonic branching fraction can be found in [142]:
| (92) |
The central value of reference [142] has been lowered by 2 to account for a different choice of the -quark mass. A very similar result for the central value and the uncertainties can be found in [133].
E.3.1 Uncertainties related to quark masses
It has been assumed that is known with an uncertainty of 60 , as discussed in Section E.1, and that the difference between the - and -quark masses is known with an uncertainty of 40 , related to the error on . These variations induce and uncertainties on , respectively.
E.3.2 Adopted value
Adding in quadrature the quoted uncertainties in Equation (92) leads to a 2.5 relative uncertainty on . Since these errors have not been cross-checked by other theoretical approaches or experimental measurements and because most of these uncertainties depend on the evaluation of (or ) which is less under control than , it has been decided to inflate the total error by an arbitrary factor of two, leading to a theoretical uncertainty of 5 (see reference [134] for a more detailed discussion). This implies, in practice, that uncertainties of , , and have been attached to the values of , , and respectively.
E.4 Common sources of theoretical errors for the two determinations of
Theoretical uncertainties attached to the exclusive and inclusive measurements of are largely uncorrelated. When evaluating the average, only the uncertainties related to and have been considered fully correlated.
E.5 Sources of theoretical errors entering into the measurement of the ratio
In the evaluation of the ratio , several common experimental and model systematics have a reduced effect.
For the ratio , uncertainties originating from the determination of have to be considered as fully correlated. Leading effects of order are expected to be uncorrelated between and determinations [134]. This is also expected for perturbative uncertainties.
With the conventions used in the previous sections, the relative errors on the ratio are:
| (93) |
For the ratio , all uncertainties can be considered as uncorrelated giving:
| (94) |
In practice, the ratio will be obtained using the average of the two measurements of and taking into account common systematics with .
E.6 Conclusions and summary
The conclusions of the workshop which are given in this Appendix have left aside several subtleties concerning the exact meaning of the parameters entering into the different expressions for , and . The interested reader has therefore to consult the documents quoted in the references for more information.
Two groups (at least) have obtained consistent results on central values and uncertainties for and .
Uncertainties on have been enlarged, in a rather arbitrary way, by a factor two to have some margin because of possible additional contributions (reliability of expansion, need for other techniques to evaluate ,…).
Dedicated experimental studies on production and on the distributions of moments of the lepton momentum in the B rest frame are needed to evaluate with better accuracy and greater confidence the most important sources of systematic errors contributing in the theoretical expressions.
The following central values and theoretical uncertainties have been used in the measurements of and obtained from combined LEP analyses:
-
•
inclusive measurement of :
(95) -
•
inclusive measurement of :
(96) -
•
exclusive measurement of :
(97)
All uncertainties have been added in quadrature.
The correlated uncertainty between and measurements stem from the effect of .
The correlated uncertainty between and measurements is limited to the effect of . Hence no correlated uncertainty between and measurements is assumed.