SLAC-PUB-8625
BABAR-PROC-00/16
LPNHE-00-05
September, 2000
Measurements of and lifetimes and - mixing with fully reconstructed decays in BABAR
Fernando Martínez-Vidal
LPHNE, IN2P3-CNRS/Universités Paris 6 & 7, France
E-mail: martinef@SLAC.Stanford.EDU
(for the B AB AR Collaboration)
Abstract
Time-dependent flavor oscillations and and lifetimes are studied in a sample of fully reconstructed mesons collected with the BABAR detector, running at the PEP-II asymmetric Factory with center-of-mass energies near the resonance. This is the first time that time-dependent mixing and lifetime measurements have been performed at energies.
Contributed to the Proceedings of the 30th International Conference on High Energy Physics,
7/27/2000–8/2/2000, Osaka, Japan
Stanford Linear Accelerator Center, Stanford University, Stanford, CA 94309
Work supported in part by Department of Energy contract DE-AC03-76SF00515.
1 Introduction
Preliminary measurements of time-dependent flavor oscillations and and lifetimes have been performed with the BABAR detector. These analyses exploit the copious production of meson pairs in decays, produced by asymmetric collisions at the PEP-II Factory at SLAC. These measurements can be used to test theoretical models of heavy quark decay and to constrain the Unitarity Triangle (via the sensitivity to the value of the Cabibbo-Kobayashi-Maskawa matrix [1] element ). The data set, collected from January to June, 2000, has an integrated luminosity of 8.9 on the resonance and 0.8 collected 40 below the threshold. This corresponds to about produced pairs. The resolution function and mistag rates determined from data in the analyses described here are also used in asymmetry measurements [2].
2 Experimental Method
The BABAR detector is described in detail elsewhere [3]. The analyses described here use all the detector capabilities, including high resolution tracking and calorimetry, particle identification and vertexing.
At PEP-II the meson pairs produced in the decay of the resonance are moving in the lab frame along the beam axis ( direction) with a Lorentz boost of . One () is fully reconstructed in an all-hadronic (, and ) or semileptonic decay mode () ***Throughout this paper, conjugate modes are implied.. A total of about 2600 neutral, and a similar number of charged, candidates is reconstructed in hadronic decay modes, with an average purity close to . The background is mainly combinatorial. About 7500 ’s are reconstructed in semileptonic modes, with an average purity of . Backgrounds to the semileptonic mode are due to combinatorics, fake leptons, events, and charged decays from . Fig. 1 shows the beam-energy substituted mass () distributions for the hadronic sample (left) and the mass distribution for the semileptonic sample (right) [4, 5].
 |
 |
The separation between the two vertices along the boost direction, , is measured and used to estimate the decay time difference, . The vertex is determined via an inclusive procedure applied to all tracks not associated with the meson [4]. The typical separation between the two vertices is , to be compared to the experimental resolution . The resolution is dominated by the precision on the vertex, and has little dependence on the decay mode of the . An event-by-event resolution is computed and modified to fit the data by convolution with three Gaussians, core, tail and outlier. Most of the events, , are in the core Gaussian, with ps.
3 Lifetime Measurements
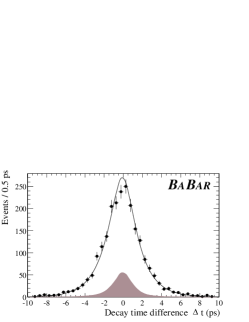
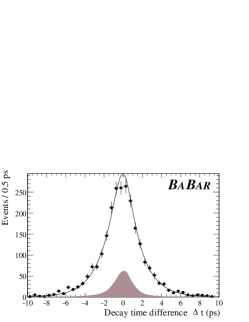
The and lifetimes are extracted from a simultaneous unbinned maximum likelihood fit to the distributions of the signal candidates, assuming a common resolution function. Only hadronic decays from a subsample of 7.4 integrated luminosity (on-resonance) have been used. An empirical description of the background shape is assumed, using sidebands with independent parameters for neutral and charged mesons. Fig. 2 shows the distributions with the fit result superimposed. Table 1 summarizes the contributions to the total error (see [4] for details).
 |
 |
| Source | |||
|---|---|---|---|
| Data statistics | 0.052 | 0.049 | 0.044 |
| MC statistics | 0.016 | 0.014 | 0.014 |
| resolution | 0.007 | 0.007 | 0.008 |
| outliers | 0.016 | 0.020 | 0.005 |
| alignment | - | - | - |
| scale | 0.015 | 0.016 | - |
| boost | 0.006 | 0.006 | - |
| signal probability | 0.003 | 0.002 | 0.005 |
| background | 0.005 | 0.017 | 0.011 |
| Total systematics | 0.029 | 0.035 | 0.021 |
4 Time-dependent mixing
A time-dependent mixing measurement requires the determination of the flavor of both ’s. The flavor is known if it has been correctly reconstructed, and the flavor of the is determined by exploiting the correlation between the flavor of the meson and the charge of its decay products [5]. If there is an identified lepton its charge is used; otherwise the summed charge of identified kaons provides the tag. An event with no tagging leptons or kaons can still be tagged by use of a neural net that exploits the flavor information carried by other decay products, such as soft leptons from charm semileptonic decays and soft pions from decays.
The effective flavor tagging efficiency is given by where the sum is over tagging categories, each characterized by a tagging efficiency and a probability to mis-identify the flavor, . is related to the statistical significance of the measurement ().
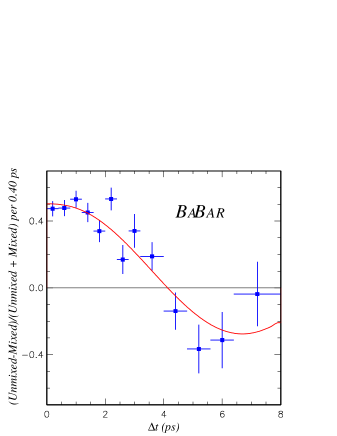
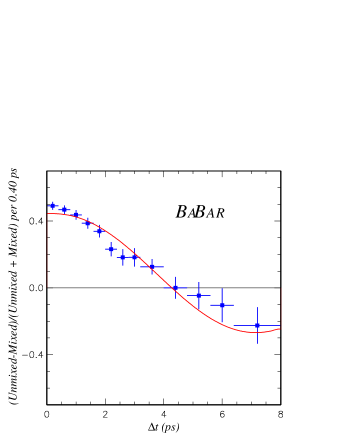
From the time-dependent rate of mixed () and unmixed () events, the mixing asymmetry is calculated as a function of and fit to the expected cosine distribution,
where are the parameters of the resolution function [5]. A simultaneous unbinned likelihood fit to all the tagging categories, assuming a common resolution function, allows the determination of both and the mistag rates, . An empirical description of the backgrounds is determined by fitting to background control samples taken from data, allowing for the following components: i) zero lifetime, ii) non-zero lifetime with no mixing, iii) non-zero lifetime with mixing (only for semileptonic decays). Fig. 3 shows the distributions with the fit result superimposed. Table 2 summarizes all the contributions to the total error (see [5] for details).
 |
 |
| Source | ||
| hadronic | semileptonic | |
| Data statistics | 0.031 | 0.020 |
| MC statistics | 0.011 | 0.009 |
| resolution | 0.011 | 0.012 |
| background | 0.002 | 0.002 |
| background dilutions | - | 0.006 |
| background fractions | 0.004 | 0.006 |
| background | - | 0.010 |
| Lifetime | 0.005 | 0.006 |
| scale | 0.005 | 0.005 |
| boost | 0.003 | 0.003 |
| Total systematics | 0.018 | 0.022 |
5 Results
The preliminary results for the meson lifetimes are
and for their ratio is
From the hadronic sample we measure the oscillation frequency:
and from the sample the result is
Combining the two results, we obtain the preliminary result:
The mistag rates and resolution function extracted from these fits are used in the BABAR violation asymmetry analysis [2]. The effective flavor tagging efficiency is found to be .
References
- [1] M. Kobayashi and T. Maskawa, Prog. Theor. Phys. 49 (1973) 652.
- [2] BABAR Collaboration, B. Aubert et al., “A study of time-dependent violating asymmetries in and decays”, SLAC-PUB-8540, BABAR-CONF-00/01, July 2000, contributed paper to this Conference. Preprint hep-ex/0008048.
- [3] BABAR Collaboration, B. Aubert et al., “The first year of the BABAR experiment at PEP-II”, SLAC-PUB-8539, BABAR-CONF-00/17, July 2000, contributed paper to this Conference.
- [4] BABAR Collaboration, B. Aubert et al., “A measurement of the charged and neutral meson lifetimes using fully reconstructed decays”, SLAC-PUB-8529, BABAR-CONF-00/07, July 2000, contributed paper to this Conference. Preprint hep-ex/0008060.
- [5] BABAR Collaboration, B. Aubert et al., “A measurement of the oscillation frequency and determination of flavor-tagging efficiency using semileptonic and hadronic decays”, SLAC-PUB-8530, BABAR-CONF-00/08, July 2000, contributed paper to this Conference. Preprint hep-ex/0008052.
- [6] D.E. Groom, et al., Eur. Phys. Jour. C 15(2000) 1.
- [7] B. Aubert et al., “Measurement of the meson properties using partially reconstructed to and to decays with the BABAR detector”, SLAC-PUB-8531, BABAR-CONF-00/09, July 2000, contributed paper to this Conference. Preprint hep-ex/0008053.
- [8] B. Aubert et al., “Measurement of the time dependence of oscillations using inclusive dilepton events”, SLAC-PUB-8532, BABAR-CONF-00/10, July 2000, contributed paper to this Conference. Preprint hep-ex/0008054.