AS-TEXONO/00-04
February 14, 2001
Measurement of Intrinsic Radioactivity in a GSO Crystal
S.C. Wang a,111Present Address:
TRIUMF, Canada.,
H.T. Wong a,222Corresponding author:
Email: htwong@phys.sinica.edu.tw;
Tel:+886-2-2789-9682;
FAX:+886-2-2788-9828.,
M. Fujiwara b,c
a Institute of Physics, Academia Sinica, Taipei 11529, Taiwan ROC.
b Research Center for Nuclear Physics, Osaka University, Ibaraki, Osaka 567-0047, Japan.
cAdvanced Science Research Center, JAERI, Tokai, Ibaraki, 319-1195, Japan.
Abstract
Scintillating crystal detectors offer potential advantages in low-energy low-background experiments for particle physics and astrophysics. The GSO crystal is an interesting detector to explore for future neutrino physics experiments. The contributions to background due to the various channels of intrinsic radio-isotopes from the and series are identified and studied with time-correlation analysis and detailed fits to the spectral shape. Good agreement is achieved between measured and simulated spectra, indicating background suppression factors to the level are possible. The procedures can be adopted for background understanding and suppression in other low-count-rate experiments where the dominant source of background is from internal radioactivity. Based on 1656 hours of data taking, limits on the double beta decay half-life for the various channels in 160Gd are derived. The limits for the neutrinoless and the Majoron modes are and , respectively, at 68(90)% confidence level.
PACS Codes: 14.60.Pq, 29.40.Mc, 29.25.R.
Keywords: Neutrinos, Scintillation detector, Radioactive sources.
Nucl. Instrum. Methods. A 479, 498 (2002).
1 Introduction
Crystal scintillators have been widely used as radiation detectors as well as in medical and security imaging [1]. Large detector systems, of scale several tens of tons in mass, have been constructed and made operational as electromagnetic calorimeters in high energy physics experiments [2]. It is one of the few detector technologies (the other being loaded liquid scintillator) where a large range of nuclei can be turned into massive detector systems.
The merits of scintillating crystal detectors in non-accelerator particle physics experiments have been recently discussed [3]. Primarily, the high-Z composition of most crystals allows a compact design and provides large suppression of background due to ambient radioactivity if a three dimensional fiducial volume definition can be realized. Experiment based on 100 kg of NaI(Tl) has been built for Dark Matter searches, producing some of the most sensitive results [4]. Another experiment toward 500 kg of CsI(Tl) for studying low-energy neutrino interactions using reactor neutrinos as probe is now under construction [5].
An interesting isotope for low-energy neutrino physics experiment is , which has an isotopic abundance of 21.9% in natural gadolinium. It is a double beta decay candidate [6]. The lepton-number-violating neutrinoless double beta decay () channel, which is sensitive to the Majorana neutrino mass terms, proceeds as:
In addition, this isotope has recently been proposed as an attractive isotope for the detection of low-energy solar neutrinos [7] by providing a time-delay signature for background suppression and for tagging the flavor-specific N-CC reactions [8]:
followed by, in the 100 ns time-scale,
The scintillating crystal GSO (), where gadolinium is 74.4% by weight, was first developed in the 1980’s [9]. It is an attractive technology to realize an active detector based on gadolinium. Various studies have been performed at the prototype [10] and detector [11] levels for calorimeter systems, as well as for double beta decay searches [12, 13, 14] and feasibility studies of solar neutrino experiments [15].
The properties of GSO, together with a few commonly used crystal scintillators, is listed in Table 1. It can be seen that besides neutrino physics, GSO may offer an attractive alternative to BGO in high energy physics and medical applications, having almost the same radiation length, but higher light yield, faster decay constant, and excellent radiation resistance.
In this article, we report on the measurement and analysis of the major components of intrinsic radio-impurities in a commercially available GSO crystal333Manufacturer: Hitachi Co. Ltd., Japan.. These results are important to assess the feasibilities of GSO crystals in the low-event-rate experiments mentioned, and can serve as basis of future R&D efforts. In addition, the procedures can be adopted for background understanding and suppression in experiments dominated by internal radioactivity background. Lifetime limits on the various double beta decay channels for 160Gd are derived.
2 Experimental Setup
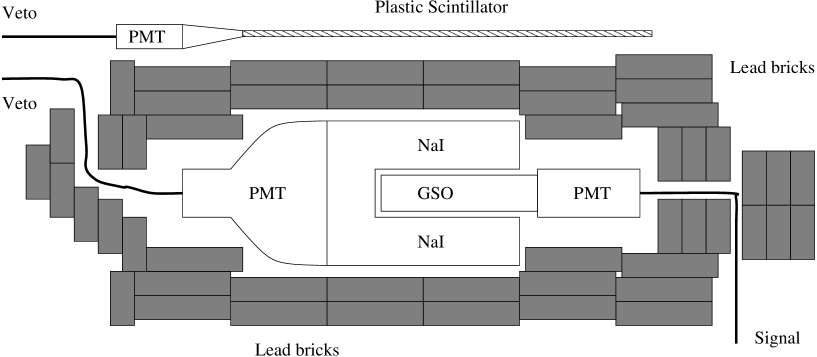
The schematic diagram of the experimental setup is depicted in Figure 1a. The GSO crystal under study has a dimension of 3.8 3.8 18 cm3, weighing 1.744 kg and was wrapped with white Teflon tapes to improve the light collection. An outer layer of black vinyl tapes provided a light-proof layer.
A 2-inch diameter photo-multiplier(PMT) with potassium-free glass was coupled to one of the end surfaces of the crystal. The whole crystal-PMT system was inserted into a well-shaped NaI(Tl) crystal scintillator444Manufacturer: Canbera with a mass of 14 kg, and viewed via a quartz window by a 5-inch photo-multiplier tube with potassium-free glass. The NaI(Tl) scintillator served as an active shielding device, vetoing background ’s and ’s from the ambient environment, as well as the cosmic muons that penetrated the crystal detector. Surrounding the NaI-GSO-PMT active components was lead shieldings of 10 to 15 cm in thickness. The measurement was performed in a ground-level laboratory of a seven-storey building. The estimated overburden is about 12 meter-water-equivalent, sufficient to suppress the hadronic components of the cosmic-rays. A 40 50 1 cm3 scintillation plastic was placed on top of the detector outside the lead bricks for cosmic-ray muon vetoes. As shown in Section 3, internal radioactivity becomes the dominant contribution to the background spectrum under this shielding configuration. Therefore, it is not necessary to make special additional efforts to suppress the neutron and radon induced background in the present work.
The schematic diagram of the electronics and data acquisition systems is displayed in Figure 1b. The CAMAC system was adopted. The energy and time for each event were recorded. The energy measurement was made by using an analogue-to-digital converter555LeCroy 2249W which integrated the anode current of the PMT for a gate-time of 600 ns, while the timing measurement was done by a scaler666Kinetic Systems 3615 counting on a 1 MHz clock. The scaler was read and then reset when the LAM (Look-At-Me) line was set active by the ADC. The timing accuracy was checked to be better than the time bin of 1 s. Data were acquired and transferred through the CAMAC bus via a fast CAMAC Controller 777CAEN C111A to an interface processor running on the Linux operating system with a PC computer. The rate at a detector threshold of 50 keV after active vetoes and passive shieldings was 6.46 Hz. The dead-time of the system, which was mainly due to the conversion time of the CAMAC ADC (about 106 s per conversion), is less than 0.1%
3 Results and Analysis
Events from the GSO crystal not in coincidence with the NaI(Tl) anti-Compton detector and the cosmic-ray veto panel were selected. The energy spectrum based on 1656 hours of data taking is shown in Figure 2. It can be seen that there are three distinct regions in the energy spectrum due to intrinsic radioactivity. The sharp peak at 0.394 MeV is due to the -decay of the isotope 152Gd in the crystal. The nominal isotopic abundance of 152Gd is 0.2%, decaying by -emission at 2.14 MeV and with a half life of years [16]. Events in the broad peak around 1 MeV are due to the -decays of the radio-nuclides in the and series in the GSO crystal. These isotopes and their decay-daughters are primordial in origin and get into the crystal mostly through the contaminations in the raw materials. The high energy shoulder above 1.4 MeV and up to 2.0 MeV is due to the -emissions together with the subsequent prompt -rays from the radio-nuclides of these cascades. The bump at the 2.6 MeV region is due to the 208Tl 2.61 MeV -rays from ambient radioactivity.
There is no notice-able peak at 1.46 MeV due to the -rays from the commonly found 40K, since a PMT with potassium-free glass was used. In the first trial measurement using another PMT with normal glass, a peak at this energy did show up prominently.
The 152Gd -peak at 394 keV served as a convenient reference standard to monitor and to correct for the gain instabilities of the measurement system in the course of data taking. Accordingly, data are analyzed in an one-day interval and the different data sets were added together after calibrating their -peaks to be at the same energy point. The measured pulse-height variation as a function of temperature is depicted in Figure 3. The PMT gain variation is typically less than , such the origin of this pulse-height variation is due to change in the intrinsic light yield of the crystal. The best fit value of the temperature dependence is , which is consistent with the results of -0.67% at 20 oC for GSO light yield variation previously reported [17].
Further quantitative information can be derived from the studies of the timing of the events, as well as from the spectral features.
3.1 Timing Analysis
The timing information is used to probe the fine structures of the various cascade series, and the results are displayed in Table 2.
Timing-correlation analysis was applied to the series where the 214Bi-214Po decay sequence with time-correlated - signatures were selected:
Since the -decay energy is continuous up to the end-point energy, the initial events were selected with energy from 0.1 MeV to 3.3 MeV, while the second was within 3 of the mono-energetic -energy. An exponential function at nominal decay half-life plus a constant background was employed in the fit. The inclusion of a flat background was to account for accidental coincidences which become significant when the sought impurity concentration is tiny. The results are shown in Figure 4a and summarized in Table 2. The measured activity is mBq/kg.
In the series, the 220Rn-216Po decays:
can be tagged by an - delayed coincidence. Pairs of adjacent events which have the correct electron-equivalence energies within 2 were selected. Since the accidental rates in this case are comparable to the decay lifetime of the cascade sequence, the measured time-correlation would be faster than the nominal lifetime, and the background would be a slow exponential rather than a constant. The measured distribution of the time intervals of such pairs of events is shown in Figure 4b. It was fitted to two exponential functions with variable lifetimes. The slow component gives a best-fit value of , which is a measurement of the the inverse of the background rate at this energy window. The fast component is , which can be understood by Poisson statistics considerations, where This relation was experimentally checked to within an uncertainty of 10%. Folding in an over-counting factor (originated, for instance, from that the parent-accidental-daughter sequence would be counted as more than one event) of 1.2 obtained from simulations, an activity of mBq/kg for this cascade sequence is derived. Accordingly, contaminations from the series are expected to be the dominant background contribution for the crystal.
Finally, the decay sequence of 219Rn–215Po in the 235U series with an - tag was likewise processed:
Events with the corrected sequence of energies were selected. The fit to the data with an exponential decay at nominal half-life plus a constant background is shown in Figure 4c. The summary of the results is given in Table 2.
The natural abundance of 235U in uranium is 0.7%. However, the results based on this analysis shown in Table 2 implies a 235U/238U ratio to be 4%. This inconsistency suggests that the assumption of having the decay series in secular equilibrium in the crystal is not valid.
3.2 Energy Response to and
The energy calibration to photons and electrons was achieved by the standard -ray sources (133Ba, 22Na, 137Cs, 54Mn). This was fitted to a response function
| (1) |
where the energy E is in MeV. The two terms originate from the contributions of photo-electron statistics and electronic noise, respectively. The calibration measurements gave best-fit coefficients of A=% and B=%, which were adopted in subsequent analysis. The energy resolutions are 12.4%, 8.5% and 7.2% for 0.66 MeV, 1.27 MeV and 1.73 MeV, respectively.
Different particles (electrons, protons, , …), give rise to events with different ionization densities dE/dx. High charge densities will lead to reduced light yield or “quenching”, due to recombinations and other non-radiative dissipation. Accordingly, heavily ionizing particles like ’s will give less light than electrons at the same kinetic energy deposited at the scintillator.
The response of the crystal scintillator to -particles is very important to evaluate the intrinsic radio-impurities background. The quenching factor of the ’s depends on the energy and can be parametrized [18] as:
| (2) |
where and are the initial kinetic energy of the and its “electron-equivalence” light yield, respectively. Based on the peak positions of the -particles from 152Gd and 241Am (), the values of and were derived and adopted in the global fitting procedures discussed in Section 3.3. As an illustration, -particles with 6 MeV kinetic energy, typical for decays in the and series, produce an electron-equivalence light output of 1.08 MeV.
3.3 Spectral Shape Analysis
A detailed Monte Carlo simulation on the contributions of intrinsic radio-impurities to the background spectrum was performed. The simulation software was based on the EGS4 package [19]. The electron and photon interaction cross sections with a GSO crystal were created by specifying the correct composition of 2:1:5 for the Gd:Si:O ratio and the exact geometry of the crystal. Electrons and photons were traced down to the energy of 10 keV before discarding. The number of events generated is of the same range as that recorded in the data taking time of 1656 hours, such that the statistical uncertainties of the simulated and measured spectra are comparable.
An event generator was developed incorporating all the decay schemes based on the standard values [16] in the 232Th and 238U series. The minor () contributions from the 235U series were not included. The sources were randomly and uniformly located in the crystal volume, emitting , , and particles at arbitrary directions. The different responses to photons/electrons and to ’s were incorporated based on the equations in Section 3.2. While and emissions deposit all their kinetic energies in the crystal, the self-attenuation to the ’s by the crystal are accounted for by simulations. The combined effects of short-lived () cascades were generated by convoluting the various decay channels and their energy depositions.
A global fit was performed, adopting as free parameters the unknown activities of all the long-lived precursors of the and series, plus that of the -activities from 152Gd. The series has three families with long-lived precursors, as shown in Table 3: 232Th and 228Ra are unconstrained, while activities of 228Th and its daughters are constrained by the measurements due to timing analysis given in Section 3.1. Similarly, the series has five families, as shown in Table 3: 238U, 234U, 230Th and 210Pb are unconstrained, while activities of 226Ra and its daughters are bounded within the measurement values in Section 3.1.
The energy spectra due to each of these precursors and their daughters were simulated at the nominal resolution and quenching parameters based on Equations 1 and 2, respectively, in Section 3.2. The global fit was performed by varying the relative activities between the families to match the overall spectral shape, within the energy range of 300 keV to 1.9 MeV. Events below this range are subjected to instabilities in electronic noise and trigger conditions during data taking, while those with energies above 2 MeV are mostly due to ambient radioactivity. Statistical uncertainties for both the measured and simulated spectra were taken into account.
The best fit spectrum is displayed alongside with the measured spectrum in Figure 2. An illustration to the contributions from individual components to the spectral shape is shown in Figure 5: ’s and +’s for the (a) and (b) series, respectively. The measured activity for 152Gd -activity (2.9 Hz in this crystal) corresponds to an isotopic abundance of 0.29%, larger than the nominal values of 0.2%. An alternative explanation for the enhancement of the -peak at the electron-equivalence energy of 0.39 MeV can be the presence of 147Sm contamination at the g/g level. This isotope decays by -emission at an energy of 2.23 MeV and a half-life of yr. The two cases, however, are experimentally indistinguishable.
The activities for the families within the and series are shown in Table 3 and Table 3, respectively. There are two ambiguities in the exact interpretations for the physical processes but the difference do not have big effects on the practical concern of accurate background subtraction:
- I.
-
There are three “lone” -emissions from precursors (, 234U, 230Th) which are the only member within their families. Since they are not accompanied by other decays and their energies are equal within , the constraints from the fits are weak, indicating that the signatures are experimentally equivalent. Only a total activity of 217 mBq/kg can be derived. However, assessing from the observations that the crystal is dominantly contaminated by the other isotopes further down the series, it can be expected that much of the activity can be attributed to the -decays of . The component spectra in Figure 5 assumes equal sharing among the three isotopes for illustration purpose.
- II.
-
Similarly, in the energy range of interest, the family gives two -decays with end-point of 2.2 MeV and an -decay at 4.27 MeV. These can in principle mimic the lone ’s from 228Ac and the lone ’s discussed above, both of which are at the same energies. Again, since the isotopes further down the series are known to be the dominant sources, the entire -strength was assigned to the 228Ac decays in Table 3 and Figure 5.
It can be seen that the radio-isotopes within the two series are not in exact secular equilibrium. Nevertheless, a consistent picture can be drawn from the data where the series dominate the background at a 100-1000 mBq/kg level, while the series are much less at the 10 mBq/kg range except for 210Pb, the only long-lived daughter isotopes from radon contamination, which is at an activity level of 200 mBq/kg.
Events below 100 keV originate from the -decay of 228Ra and 210Pb. The peak at 390 keV is due to -decays of 152Gd. The various -decays in both the and series populate the broad peak around 1 MeV, defining the higher and lower energy edges, respectively. The shoulder between 1.4 and 2.0 MeV is due to the cascades from 228Ac and 212Bi in the series. The higher energy events above 2.0 MeV comes from (a) the -decay with -emissions of 208Tl, which has a decay Q-value of 5.0 MeV, and (b) the convoluted energy of within the 600 ns integration-time in the 212Bi212Po cascade. The intermediate 212Po half-life is short (299 ns) so that 75% of decay-sequence are combined together as a single event.
The relative residual (that is, [MeasuredSimulated]/Measured) as a function of energy is depicted in Figure 6a. Only statistical uncertainties are shown. It can be seen that, from 300 keV to 1.9 MeV where the fit was performed, the simulated spectrum matches well to the measured background to better than the few % level, except in the “trough” region between the two peaks at about 600 keV. The measured spectrum between 700 keV and 1.9 MeV, which is dominated by the and events for both and components and relevant for double beta decay analysis discussed in Section 3.4, is fitted well by the simulated spectra. Among them, the -dominated bump (700 keV to 1.3 MeV) gives larger dispersions in their residuals. This can be understood by the fact that the detailed spectral shape in this region is due to the convolutions of many -lines folded in with their respective quenching factors. In comparison, the shape in the 1.4 MeV to 1.9 MeV range is due to a high energy -decay (with energy 8.78 MeV from 212Po) then a -decay (Q-value 2.13 MeV from 228Ac), leading to more accurate and robust matching. The big excess above 2 MeV over contributions from intrinsic radioactivity confirms that ambient background, due to the -rays from 208Tl, are dominant in this region. It can be understood from that low energy ambient photons suffer larger suppression factors due to the NaI(Tl) anti-Compton detector.
3.4 Double Beta Decay Analysis
The isotope 160Gd is a emitter at a Q-value of 1.73 MeV. The lifetime limits from the present GSO measurements are not as sensitive as the various other double beta decay experiments [6], such as the best sensitivities achieved in 76Ge with high-purity germanium detectors [20]. The analysis was nevertheless performed for completeness and for studying how the background subtraction results can be applied in a realistic case. Different approaches for setting the limits are compared.
The measured raw background rate in the present shielding and veto configuration in the vicinity of the end-point is 1 . From the results in Section 3, all of these events can be accounted for to be due to intrinsic radioactivity, mostly -decays, at an uncertainty level of better than a few %. The contributions from these known sources were subtracted from the raw spectrum based on 1656 hours of data, and the residual spectra around the end-point is shown in Figure 6b, showing no particular structures. Statistical error bars were adopted. A per degree of freedom (/dof) of 41.9/25 was obtained for a “zero residual background” hypothesis between 1.2 MeV to 1.9 MeV. The best-fit amplitude for a possible Gaussian signal at the expected resolution above zero-background at the 1.73 MeV end-point is . Assuming Gaussian errors, the upper limits for the signal () are
It is illustrative to compare this with the other values
of derived by alternative methods,
which are based on the assumption that the
background is a smooth spectrum at the
end-point region, without
prior knowledge of the actual
background components [13].
There are 671545 events observed
within the (efficiency 0.68)
region around the end-point.
If these are all due
to background, the signal must be smaller than
the statistical fluctuations such that, folding
in the efficiency factor,
Alternatively, the spectrum can be fitted to
an ad hoc polynomial and the residual
at the region is
, giving
Therefore, it can be seen that the background
identification and subtraction procedures adopted
in this work gives similar performance to
subtraction schemes based on unknown
background source and assumed spectral
shape. The present scheme provides further
justifications and
robustness to the background suppression,
and is applicable for signals other than
the easily distinguishable energy peaks (such
as continuous spectra)
as well as at regions where the background
spectra do exhibit certain structures
(indeed, there is a bump at 1.6 MeV due to a
high energy -decay).
The fact that the present uncertainty is
comparable to the
statistical fluctuations
()
indicates that, up to a suppression factor
of ,
the procedure is
still statistics-limited and there
are room to enhance the sensitivities further
with more data and longer simulation time.
The half-life limit can be expressed as
| (3) |
Putting the experimental values of the target number , and the data taking time of and the values of derived above, we obtain
consistent with and at a comparable range to the previous results: at 68% C.L. [13] and at 90% C.L. [14]. These limits apply to both the ground state to ground state transition as well as the transition to the excited state, since the 87 keV -rays emitted are fully absorbed by the crystal. The corresponding limits of the effective neutrino mass parameter, based on calculations in Ref. [21], are at 68(90)% CL.
Limits can also be set for the two-neutrino double beta decay () and the neutrinoless double beta decay with Majoron emission () channels. We took the conservative approach of deriving the limits only with the residual data in Figure 6b between the 1.2 MeV and 1.9 MeV region. The /dof is good for a zero-residual hypothesis using statistical error bars alone, indicating that the background in this region is well-understood. The efficiency factors for the and channels to be within this energy range are 2% and 46%, respectively.
The best-fit of a spectra over zero-residual in this energy range gives the optimal activity of events, from which leading to
Similarly, a fit to the spectra gives the best value of events. Restricting a possible signal to be positive definite, the upper limits is derived, giving rise to
Though these and limits are only modest compared to those of the other double beta decay candidates, they represent nevertheless more than an order of magnitude improvement over previous published results on 160Gd [12]. The improved sensitivities can be attributed to that the background must first be quantitatively understood and the detailed spectral structures accounted for to allow them be subtracted off from signals which are themselves continuous spectra without specific structures.
4 Discussions and Summary
The analysis methods and results discussed in this article give indications of the potentialities and problems of GSO crystals in neutrino experiments. They also provide training grounds in developing the schemes for the background understanding and suppression for similar class of experiments.
Low background experimentation techniques must be used to maximize the sensitivities in a realistic experiment. To get to the relevant y sensitivity range for double beta decay searches, one needs improvement in the [(target masstime)/background] value. With a realistically achieve-able target mass of O(10 ton) and running time of O(1 year), the background has to be further reduced by at least factor of 103, via more elaborate shielding configurations and data taking at an underground laboratory, as well as through careful choice of raw materials with reduced and activities, especially the contaminations due to 228Ra. Measurements with raw background rate of 0.04 at the end-point were reported [14], such that factor of hundreds in improvements have still to be worked on. An alternative or perhaps better candidate for double beta decay experiments with crystal scintillators 116Cd with cadmium tungstate (CdWO4) crystals [22].
Solar neutrino experiments with 160Gd typically involve an event rate of O(0.1 ton-1day-1), and hence imply more stringent intrinsic radio-purity level requirements. The specific delayed-correlation signatures discussed in Section 1 provides powerful means to suppress background due to accidental coincidence. Design studies [8] indicate that the purity levels of g/g are required for 238U and 232Th series and g/g for 235U (where -decays of 231Th with a delayed -emissions may mimic the neutrino signatures). The results in Table 2 show that improvements to the and levels relative to the activities measured in this work for the and series, respectively, are necessary. This timing analysis results in Table 2, however, only gives the contamination levels of 227Ac and its short-lived daughters within the 235U series but does not provide direct measurement of the 235U concentration. If secular equilibrium is assumed, an improvement of better than is necessary. The electron-equivalence light output of 392 keV for 152Gd -decay is in between the expected range of (pp) and (7Be). Effects of the tails of the energy distribution to the level have to be studied. There are isotope-separation schemes to deplete 152Gd [15], thereby reducing this potential background. In addition, care must be exercised in selecting the sources of cerium the dopant materials in order to avoid contaminations from its long-life isotopes: 139Ce () which decays by electron capture emitting -rays of 166 keV, and 144Ce () which decays by -emissions at a Q-value of 320 keV.
A GSO scintillating crystal detector which can satisfy the requirements for solar neutrino experiments will also be a powerful device for double beta decay searches that can operate simultaneously.
One of the problems for the construction of big detector systems based on GSO crystals has been the cost. There are ongoing efforts from the industries to produce and market this crystal at a similar price range as BGO [23]. If achieved, this crystal will be an attraction option for electromagnetic calorimeter in a high-rate environment as well as for medical imaging applications.
An independent motivation of this work is to study the methods for the measurements and subtraction of background due to intrinsic radio-isotopes. In a scintillating crystal detector with minimal passive volume and where a three-dimensional fiducial volume definition can be achieved, the ambient background in the sub-MeV range will be highly reduced and the primary experimental focus will be one on the understanding and suppression of internal background [3]. In addition, forthcoming big liquid scintillator experiments like BOREXINO [24] and KamLAND [25] for low energy solar neutrino and long-baseline reactor neutrino experiments will need to identify and measure the background processes quantitatively to justify their signals, in a similar spirit to this work. The GSO crystal used in this measurement, having relatively high contamination levels, provides a convenient platform to develop the analysis procedures and to understand the various systematics involved. Crystals with much better radio-purity level are available. For instance, the secular equilibrium levels for the and 238U series in CsI(Tl) are below the g/g range [5].
It has been shown that a subtraction factor of is possible, at least in the case where the region is dominated by a smooth -decay background. The background of and in a GSO crystal treated in this work are in fact more difficult to handle from the background subtraction point of view. There are multiple -decays to be convoluted together with their quenching factors to be taken into account, detection efficiency factors for the -emissions which depends on the details in detector geometry, as well as convolutions of various signals due to short life-time cascades. Other simpler decay schemes are expected to be easier to handle. For instance, the background due to -decays of 40K can be more accurately accounted for, since these events are uncorrelated with the other processes such that the background spectral shape will be simply the well-known -spectra. Moreover, the activity can be independently obtained, besides being derived from the best-fit value, through the measurements of the related 1.46 MeV -decays of 40K. Furthermore, crystals like NaI(Tl) and CsI(Tl) [5], which have excellent pulse shape discrimination properties for / separation and where the -particles suffer less severe quenching, can provide much better measurements and identifications for the -decays from the various channels, providing further powerful diagnostic tools to probe the structures within the various cascade series.
The authors are grateful to T. Murakami for the loan of the GSO crystal, and to C. Rangacharyulu for discussions on the various decay schemes of radio-isotopes. The work is supported by contracts NSC88-2112-M-001-007 and NSC89-2112-M-001-028 from the National Science Council, Taiwan.
References
-
[1]
For a recent review on the crystal scintillator detector,
see, for example,
M. Ishii and M. Kobayashi, Prog. Crystal Growth and Charact., 23, 245 (1991), and references therein. -
[2]
For a recent review on the applications of crystal
scintillator in particle physics, see, for example
G. Gratta, H. Newman, and R.Y. Zhu, Ann. Rev. Nucl. Part. Sci. 44, 453 (1994). - [3] H.T. Wong et al., Astropart. Phys. 14, 141 (2000).
-
[4]
R. Bernabei et al., Phys. Lett. B 389, 757 (1996);
R. Bernabei et al., Phys. Lett. B 450, 448 (1999). -
[5]
H.T. Wong and J. Li,
Mod. Phys. Lett. A 15, 2011 (2000);
H.B. Li et al., TEXONO Collaboration, hep-ex/0001001, Nucl. Instrum. Methods A 459, 93 (2001). -
[6]
For a recent review on double beta decay experiments, see, for example,
A. Morales., Nucl. Phys. B (Procs. Suppl.) 77, 335 (1999). -
[7]
For a recent review on solar neutrino experiments, see, for example,
R.E. Lanou Jr., Nucl. Phys. B (Procs. Suppl.) 77, 55 (1999). -
[8]
R.S. Raghavan, Phys. Rev. Lett. 78, 3618 (1997);
LENS Project, Letter of Intent (1999). - [9] K. Takagi and T. Fukazawa, Appl. Phys. Lett. 42, 43 (1983).
-
[10]
C.L. Melcher et al.,
IEEE Trans. Nucl. Sci. 37, 161 (1990);
M. Moszynski et al., Nucl. Instrum. Methods. A 372, 51 (1996);
N. Tsuchida et al., Nucl. Instrum. Methods. A 385, 290 (1997). -
[11]
S. Nakayama et al.,
Nucl. Instrum. Methods. A 404, 34 (1998);
M. Tanaka et al., Nucl. Instrum. Methods. A 404, 283 (1998). - [12] S.F. Burachas et al., Phys. Atom. Nucl. 58, 153 (1995).
- [13] M. Kobayashi and S. Kobayashi, Nucl. Phys. A 586, 457 (1995).
- [14] F.A. Danevich et al., Nucl. Phys. B (Proc. Suppl.) 48, 235 (1996).
-
[15]
J.-F. Cavaignac, Grenoble group, private communications (1999);
M. Nakahata, Tokyo group, private communications (1999). - [16] Table of Isotopes, 8th Edition, Vol II, ed. R.B. Firestone et al., John Wiley & Sons, Inc., New York, (1996).
- [17] T. Tsuchida et al., Nucl. Instrum. Methods. A 385, 290 (1997).
- [18] See, for example, “Theory and Practice of Scintillation Counting”, J.B. Birks, Pergamon (1964).
- [19] The EGS4 Code System, W.R. Nelson, H. Hirayama, and D.W.O. Rogers, Stanford Linear Accelerator Center Report SLAC-265 (1985).
- [20] L. Baudis et al., Phys. Rev. Lett. 83, 41 (1999).
- [21] K. Muto, E. Bender and H.V. Klapdor-Kleingrothaus, Europhys. Lett. 13, 31 (1990).
-
[22]
F.A. Danevich et al., Phys. Lett. B 344, 72 (1995);
S.F. Burachas et al., Nucl. Instrum. Methods A 369, 164 (1996). - [23] H.C. Sun, China Institute of Atomic Energy, private communications (1999).
- [24] L. Oberauer, Nucl. Phys. B (Procs. Suppl.) 77, 48 (1999).
- [25] A. Suzuki, Nucl. Phys. B (Procs. Suppl.) 171, 48 (1999).
| Properties | NaI(Tl) | CsI(Tl) | CaF2(Eu) | BGO | GSO |
|---|---|---|---|---|---|
| Density | 3.67 | 4.51 | 3.19 | 7.13 | 6.7 |
| Relative Light Yield | 1.00† | 0.45 | 0.50 | 0.15 | 0.2 |
| Emission Peak (nm) | 415 | 530 | 435 | 480 | 440 |
| Decay Time (ns) | 230 | 1000 | 940 | 300 | 30-60 |
| Refractive index at | 1.85 | 1.80 | 1.44 | 2.15 | 1.85 |
| Hygroscopic | yes | slightly | no | no | no |
| Melting point (oC) | 651 | 621 | 1418 | 1050 | 1900 |
| † Typical light yield for NaI(Tl) is about 40000 photons per MeV. | |||||
| Decay series precursor | 232Th | 238U | 235U |
|---|---|---|---|
| Actual decay sequence | 220RnPo | 214BiPo | 219RnPo |
| Signatures | |||
| Bounds on time interval (ms) | [10, 1000] | [0.13, 1.3] | [0.32, 4.8] |
| Half-life (ms) | 150 | 0.164 | 1.78 |
| Duration of Data Taking (hours) | 48 | 559 | 559 |
| No. of events | |||
| Efficiency of Cuts | 0.82 | 0.57 | 0.78 |
| Over-counting factors | 1.2 | 1.0 | 1.0 |
| Activity (mBq/kg) | |||
| Concentration of Precursor (g/g)† | |||
| † Assuming secular equilibrium | |||
| Family in | Isotope | Half-Life | Decay Mode | Q-value | Activity |
| 232Th series | (MeV) | (mBq/kg) | |||
| 232Th | 232Th | y | 4.013 | † | |
| 228Ra | 228Ra | y | 0.046 | 733 ‡ | |
| 228Ac | h | 2.127 | |||
| 228Th | 228Th | y | 5.423 | 107 | |
| 224Ra | d | 5.685 | |||
| 220Rn | s | 6.288 | |||
| 216Po | s | 6.778 | |||
| 212Pb | h | 0.574 | |||
| 212Bi | min | (64%) | 6.090 | ||
| (36%) | 2.254 | ||||
| 212Po | s | 8.784 | |||
| 208Tl | min | 5.001 | |||
| Family in | Isotope | Half-Life | Decay Mode | Q-value | Activity |
| 238U series | (MeV) | (mBq/kg) | |||
| 238U | 238U | y | 4.27 | 2 | |
| 234Th | d | 0.183 | |||
| 234Pa∗ | min | (99.87%) | 2.207 | ||
| IT (0.13%) | 0.08 | ||||
| 234Pa | h | 2.287 | |||
| 234U | 234U | y | 4.856 | † | |
| 230Th | 230Th | y | 4.771 | † | |
| 226Ra | 226Ra | y | 4.871 | 2 | |
| 222Rn | d | 5.591 | |||
| 218Po | min | 6.115 | |||
| 214Pb | min | 1.024 | |||
| 214Bi | min | 3.270 | |||
| 214Po | s | 7.834 | |||
| 210Pb | 210Pb | y | 0.063 | 198 | |
| 210Bi | d | 1.161 | |||
| 210Po | d | 5.408 | |||
| † Experimentally Equivalent. Total 217 mBq/kg. See Text. | |||||
| ‡ Experimentally Equivalent. Assign weight to 228Ra. See Text. | |||||
(a)
(b)


(a)

(b)

(c)


(a)

(b)
