Study of the process e+​eβˆ’β†’Ο€+β€‹Ο€βˆ’β€‹Ο€+β€‹Ο€βˆ’β€‹Ο€0β†’superscript𝑒superscript𝑒superscriptπœ‹superscriptπœ‹superscriptπœ‹superscriptπœ‹superscriptπœ‹0e^{+}e^{-}\to\pi^{+}\pi^{-}\pi^{+}\pi^{-}\pi^{0} with CMD-2 detector

R.R.Akhmetshin,E.V.Anashkin    V.M.Aulchenko, V.Sh.Banzarov, L.M.Barkov, S.E.Baru    A.E.Bondar, A.V.Bragin, D.V.Chernyak, S.I.Eidelman, N.S.Bashtovoy    G.V.Fedotovich, N.I.Gabyshev, A.A.Grebeniuk, D.N.Grigoriev, F.V.Ignatov    P.M.Ivanov, S.V. Karpov, V.F.Kazanin, B.I.Khazin, I.A.Koop, P.P.Krokovny    L.M.Kurdadze, A.S.Kuzmin, I.B.Logashenko, P.A.Lukin, A.P.Lysenko    K.Yu.Mikhailov, A.I.Milstein, I.N.Nesterenko, V.S.Okhapkin    E.A.Perevedentsev, A.A.Polunin, A.S.Popov, T.A.Purlatz contact person. e-mail: Al.S.Popov@inp.nsk.su    N.I.Root, A.A.Ruban, N.M.Ryskulov, A.G.Shamov    Yu.M.Shatunov, B.A.Shwartz, A.L.Sibidanov    V.A.Sidorov, A.N.Skrinsky, V.P.Smakhtin    I.G.Snopkov,E.P.Solodov, P.Yu.Stepanov    A.I.Sukhanov,Yu.V.Yudin, S.G.Zverev
Budker Institute of Nuclear Physics, Novosibirsk, 630090, Russia
J.A.Thompson
University of Pittsburgh, Pittsburgh, PA, 15260, USA
Abstract

The process e+​eβˆ’β†’Ο€+β€‹Ο€βˆ’β€‹Ο€+β€‹Ο€βˆ’β€‹Ο€0β†’superscript𝑒superscript𝑒superscriptπœ‹superscriptπœ‹superscriptπœ‹superscriptπœ‹superscriptπœ‹0e^{+}e^{-}\to\pi^{+}\pi^{-}\pi^{+}\pi^{-}\pi^{0} has been studied in the center of mass energy range 1280 – 1380 MeV using 3.0 pb-1 of data collected with the CMD-2 detector in Novosibirsk. Analysis shows that the cross section of the five pion production is dominated by the contributions of the η​π+β€‹Ο€βˆ’πœ‚superscriptπœ‹superscriptπœ‹\eta\pi^{+}\pi^{-} and ω​π+β€‹Ο€βˆ’πœ”superscriptπœ‹superscriptπœ‹\omega\pi^{+}\pi^{-} intermediate states.

1 Introduction

Measurements of the total cross section of e+​eβˆ’superscript𝑒superscript𝑒e^{+}e^{-} annihilation into hadrons at low energies as well as of the cross sections of exclusive hadronic channels are of great interest for better understanding the interactions of light quarks. This precise knowledge is also necessary for calculations of effects such as contributions of hadronic vacuum polarization to (gβˆ’2)ΞΌsubscript𝑔2πœ‡(g-2)_{\mu} and α​(MZ2)𝛼subscriptsuperscript𝑀2𝑍\alpha(M^{2}_{Z}) [1], tests of the Standard Model via the hypothesis of conserved vector current (CVC) relating e+​eβˆ’β†’β†’superscript𝑒superscript𝑒absente^{+}e^{-}\to hadrons to hadronic Ο„πœ\tau-lepton decays [2, 3].

Annihilation of e+​eβˆ’superscript𝑒superscript𝑒e^{+}e^{-} into five pions was first observed by M3N [4], DM1 [5, 6] and CMD [7] detectors. These limited data samples allowed one to study this process qualitatively and estimate the magnitude of the corresponding cross section. Later measurements by various groups in Orsay and Novosibirsk (see [8, 9, 10]) provided more detailed information on the energy dependence of the cross section for the processes e+​eβˆ’β†’Ξ·β€‹Ο€+β€‹Ο€βˆ’β†’superscript𝑒superscriptπ‘’πœ‚superscriptπœ‹superscriptπœ‹e^{+}e^{-}\to\eta\pi^{+}\pi^{-} and e+​eβˆ’β†’Ο‰β€‹Ο€+β€‹Ο€βˆ’β†’superscript𝑒superscriptπ‘’πœ”superscriptπœ‹superscriptπœ‹e^{+}e^{-}\to\omega\pi^{+}\pi^{-}.

Both isoscalar and isovector intermediate states can contribute to the cross section of the reaction e+​eβˆ’β†’Ο€+β€‹Ο€βˆ’β€‹Ο€+β€‹Ο€βˆ’β€‹Ο€0β†’superscript𝑒superscript𝑒superscriptπœ‹superscriptπœ‹superscriptπœ‹superscriptπœ‹superscriptπœ‹0e^{+}e^{-}\to\pi^{+}\pi^{-}\pi^{+}\pi^{-}\pi^{0}. In the isoscalar case the final ω​(782)​π+β€‹Ο€βˆ’πœ”782superscriptπœ‹superscriptπœ‹\omega(782)\pi^{+}\pi^{-} state is produced via ω​(782)πœ”782\omega(782) and its excitations (ω​(1420),ω​(1600)πœ”1420πœ”1600\omega(1420),\omega(1600)), whereas the isovector contribution includes the η​π+β€‹Ο€βˆ’β€‹(η​ρ​(770))πœ‚superscriptπœ‹superscriptπœ‹πœ‚πœŒ770\eta\pi^{+}\pi^{-}(\eta\rho(770)) final state arising from the ρ​(770)𝜌770\rho(770) and its excitations (ρ​(1450),ρ​(1700)𝜌1450𝜌1700\rho(1450),\rho(1700)). Since violation of isospin symmetry in electromagnetic interactions is small, one can expect that the interference between the modes with different isospin is also small, so that the two cross sections could be found independently.

2 Experiment and event selection

The experiment was performed with the CMD-2 detector at the e+​eβˆ’superscript𝑒superscript𝑒e^{+}e^{-} collider VEPP-2M in Novosibirsk [11]. The c.m. energy range from the threshold of hadron production to 1.4 GeV was scanned with 10 MeV steps. The highest energy attainable at VEPP-2M is rather close to the threshold of both final states studied, and therefore for the analysis of five pion production about 3 pb-1 of data collected in the energy range 1280 to 1380 MeV were used.

The tracking system of the detector consists of a drift chamber with about 250 ΞΌπœ‡\mu resolution transverse to the beam and a proportional Z-chamber used for the trigger, both inside a superconducting solenoid with a field of 1 T. Photons are detected in the barrel CsI calorimeter with 8-10% energy resolution and the endcap BGO calorimeter with 6% energy resolution. More details on the detector can be found elsewhere [11].

To select events of the processes under study the following cuts were applied:

  1. 1.

    Four charged tracks and two or more photons are found.

  2. 2.

    The sum of the charges of all tracks is equal to zero.

  3. 3.

    For each track the Z coordinate of the origin is close to the interaction point – |Zt​r|<7subscriptπ‘π‘‘π‘Ÿ7|Z_{tr}|<7 cm.

  4. 4.

    The impact parameter of each track is small enough β€” Rm​i​n<0.5subscriptπ‘…π‘šπ‘–π‘›0.5R_{min}<0.5 cm.

The background remaining after applying these cuts is mostly caused by the process e+​eβˆ’β†’Ο€+β€‹Ο€βˆ’β€‹Ο€+β€‹Ο€βˆ’β†’superscript𝑒superscript𝑒superscriptπœ‹superscriptπœ‹superscriptπœ‹superscriptπœ‹e^{+}e^{-}\to\pi^{+}\pi^{-}\pi^{+}\pi^{-} where extra photons appear because of the splitting of clusters from charged particles.

The events selected by the above process were kinematically reconstructed with the following constraints:

βˆ‘i=1,4Ec​h​(i)+βˆ‘j=1,2Eγ​(j)=2β‹…Eb​e​a​m,subscript𝑖14subscriptπΈπ‘β„Žπ‘–subscript𝑗12subscript𝐸𝛾𝑗⋅2subscriptπΈπ‘π‘’π‘Žπ‘š\sum_{i=1,4}E_{ch}(i)+\sum_{j=1,2}E_{\gamma}(j)=2\cdot E_{beam},
βˆ‘i=1,4Pβ†’c​h​(i)+βˆ‘j=1,2P→γ​(j)=0,subscript𝑖14subscriptβ†’π‘ƒπ‘β„Žπ‘–subscript𝑗12subscript→𝑃𝛾𝑗0\sum_{i=1,4}\vec{P}_{ch}(i)+\sum_{j=1,2}\vec{P}_{\gamma}(j)=0,

where Ec​hsubscriptπΈπ‘β„ŽE_{ch}, Pβ†’c​hsubscriptβ†’π‘ƒπ‘β„Ž\vec{P}_{ch} are energies and momenta of charged particles, while EΞ³subscript𝐸𝛾E_{\gamma} and Pβ†’Ξ³subscript→𝑃𝛾\vec{P}_{\gamma} are those for photons. The kinematic fit tries all possible photon pairs in the event and the one with the smallest Ο‡2superscriptπœ’2\chi^{2} value is used in further analysis. The events with thus chosen pairs of photons were again processed by kinematic reconstruction with an additional constraint requiring the invariant mass of the two photons be equal to the Ο€0superscriptπœ‹0\pi^{0} mass:

mγ​γ=mΟ€0.subscriptπ‘šπ›Ύπ›Ύsubscriptπ‘šsuperscriptπœ‹0m_{\gamma\gamma}=m_{\pi^{0}}.

The second stage helps to increase the three pion invariant mass mΟ€+β€‹Ο€βˆ’β€‹Ο€0subscriptπ‘šsuperscriptπœ‹superscriptπœ‹superscriptπœ‹0m_{\pi^{+}\pi^{-}\pi^{0}} resolution.

To further suppress the background from Ο€+β€‹Ο€βˆ’β€‹Ο€+β€‹Ο€βˆ’superscriptπœ‹superscriptπœ‹superscriptπœ‹superscriptπœ‹\pi^{+}\pi^{-}\pi^{+}\pi^{-} events two additional cuts were used :

  1. 1.

    The energy of each of the two selected photons is large enough β€” EΞ³>40subscript𝐸𝛾40E_{\gamma}>40 MeV. This cut efficiently rejects events with fake photons emerging because of the cluster splitting.

  2. 2.

    The Ο‡2superscriptπœ’2\chi^{2} parameter characterizing the quality of the kinematic fit is Ο‡2<4superscriptπœ’24\chi^{2}<4.

The mΟ€+β€‹Ο€βˆ’β€‹Ο€0subscriptπ‘šsuperscriptπœ‹superscriptπœ‹superscriptπœ‹0m_{\pi^{+}\pi^{-}\pi^{0}} distribution of selected events is presented in Fig.Β 1.

Refer to caption
Figure 1: The invariant mass mΟ€+β€‹Ο€βˆ’β€‹Ο€0subscriptπ‘šsuperscriptπœ‹superscriptπœ‹superscriptπœ‹0m_{\pi^{+}\pi^{-}\pi^{0}} for selected events. The solid curve represents the result of the fit, the dotted curve is the contribution of the ω​π+β€‹Ο€βˆ’πœ”superscriptπœ‹superscriptπœ‹\omega\pi^{+}\pi^{-} mode, the dashed-dotted curve is that of η​π+β€‹Ο€βˆ’πœ‚superscriptπœ‹superscriptπœ‹\eta\pi^{+}\pi^{-}, and the dashed curve shows the contribution of the background process e+​eβˆ’β†’Ο€+β€‹Ο€βˆ’β€‹Ο€+β€‹Ο€βˆ’β†’superscript𝑒superscript𝑒superscriptπœ‹superscriptπœ‹superscriptπœ‹superscriptπœ‹e^{+}e^{-}\to\pi^{+}\pi^{-}\pi^{+}\pi^{-}.

Since all four possible combinations of pions contribute, a large combinatorial background is observed. The left peak in the figure corresponds to the η​π+β€‹Ο€βˆ’πœ‚superscriptπœ‹superscriptπœ‹\eta\pi^{+}\pi^{-} production whereas the right one is caused by the process e+​eβˆ’β†’Ο‰β€‹Ο€+β€‹Ο€βˆ’β†’superscript𝑒superscriptπ‘’πœ”superscriptπœ‹superscriptπœ‹e^{+}e^{-}\to\omega\pi^{+}\pi^{-}. The number of events for each process is found by fitting the histogram with the sum of three curves: η​π+β€‹Ο€βˆ’πœ‚superscriptπœ‹superscriptπœ‹\eta\pi^{+}\pi^{-}, ω​π+β€‹Ο€βˆ’πœ”superscriptπœ‹superscriptπœ‹\omega\pi^{+}\pi^{-} and the background of the e+​eβˆ’β†’Ο€+β€‹Ο€βˆ’β€‹Ο€+β€‹Ο€βˆ’β†’superscript𝑒superscript𝑒superscriptπœ‹superscriptπœ‹superscriptπœ‹superscriptπœ‹e^{+}e^{-}\to\pi^{+}\pi^{-}\pi^{+}\pi^{-} process. The shape of the curves has been found from simulation based on matrix elements consistent with the simplest Lorentz structure of the Feynman diagrams shown in Fig.Β 2(a) and Fig.Β 2(b).

Refer to caption
(a) e+​eβˆ’β†’Ο‰β€‹Ο€+β€‹Ο€βˆ’β†’superscript𝑒superscriptπ‘’πœ”superscriptπœ‹superscriptπœ‹\,\,\,e^{+}e^{-}\to\omega\pi^{+}\pi^{-}
Refer to caption
(b) e+​eβˆ’β†’Ξ·β€‹Ο€+β€‹Ο€βˆ’β†’superscript𝑒superscriptπ‘’πœ‚superscriptπœ‹superscriptπœ‹\,\,\,e^{+}e^{-}\to\eta\pi^{+}\pi^{-}
Figure 2: Feynman diagram for the processes under study.

The interference between diagrams with different charges of intermediate ρ𝜌\rho mesons and with transpositions of identical pions in the final state has been taken into account. Simulation of the background process e+​eβˆ’β†’Ο€+β€‹Ο€βˆ’β€‹Ο€+β€‹Ο€βˆ’β†’superscript𝑒superscript𝑒superscriptπœ‹superscriptπœ‹superscriptπœ‹superscriptπœ‹e^{+}e^{-}\to\pi^{+}\pi^{-}\pi^{+}\pi^{-} was performed according to Ref.Β [12]. The procedure of statistical separation for events from different processes was checked by using simulation and the systematic error associated with this procedure was found to be negligible.

3 Results

The detection efficiency for our selection criteria was found to be 25% and 23% for ω​π+β€‹Ο€βˆ’πœ”superscriptπœ‹superscriptπœ‹\omega\pi^{+}\pi^{-} and η​π+β€‹Ο€βˆ’πœ‚superscriptπœ‹superscriptπœ‹\eta\pi^{+}\pi^{-} respectively, with no significant energy dependence. The radiative corrections for each process were calculated following Ref.Β [13].

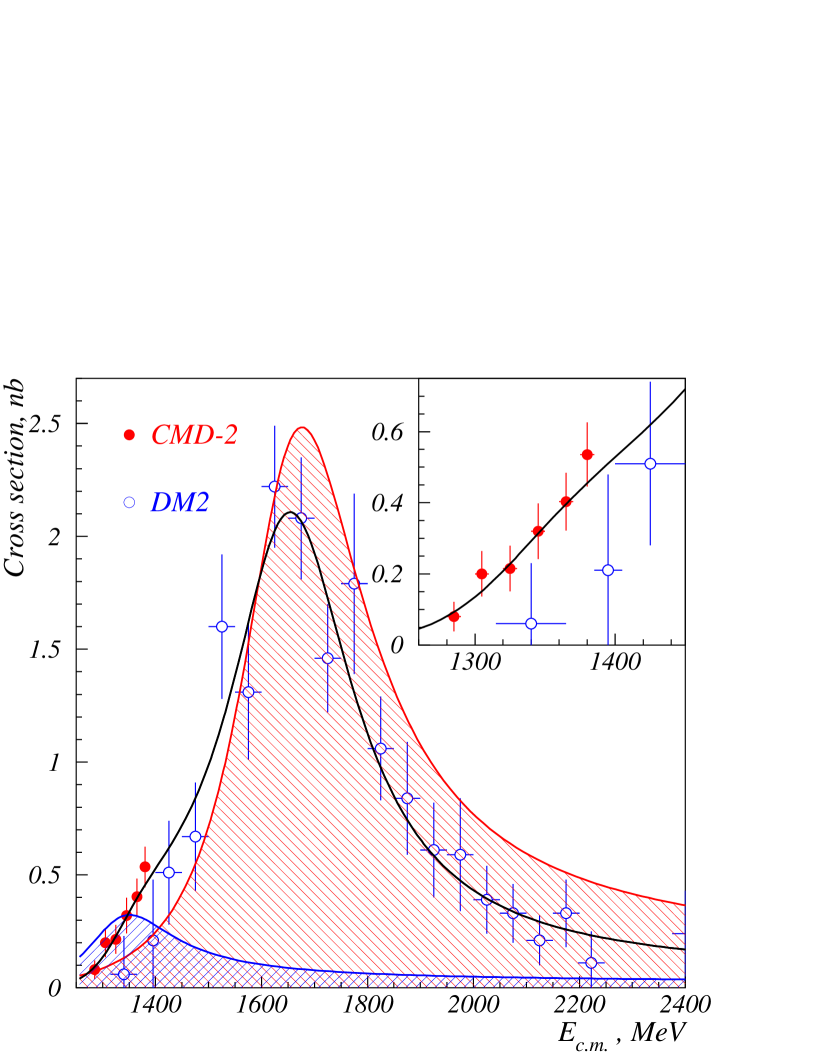
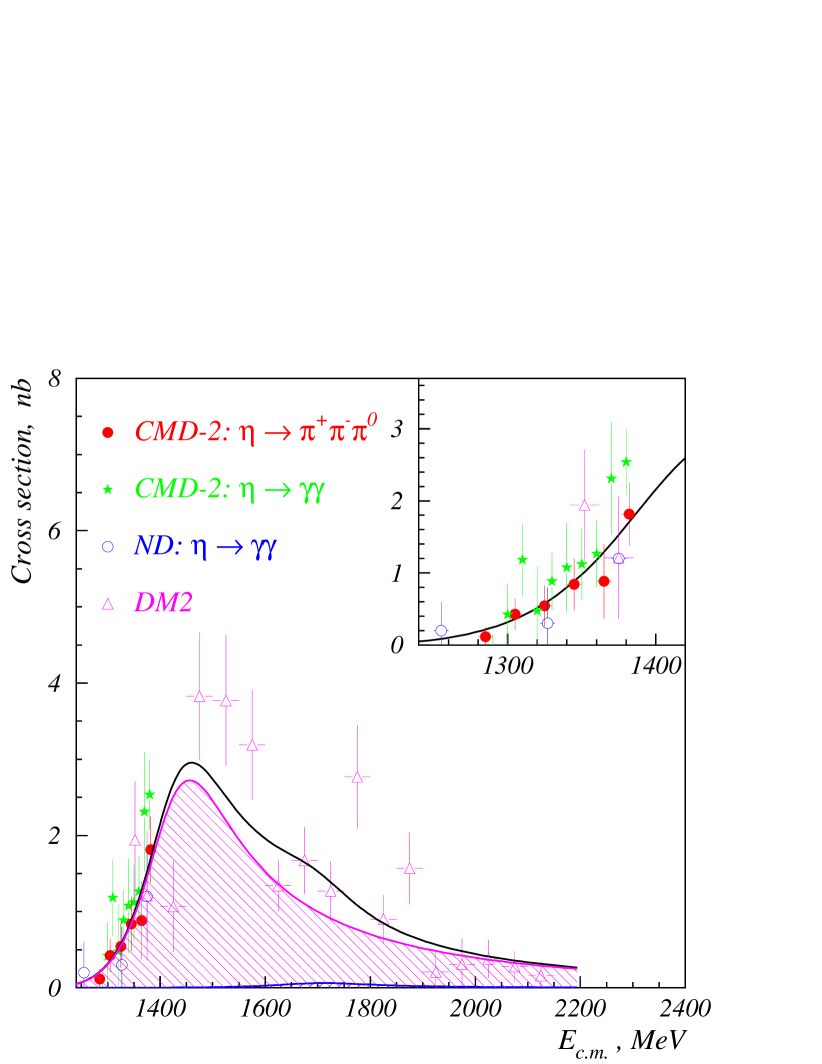
The value of the radiative correction varied with energy from -16.5% to -20.0% for each process. The number of signal events and corresponding cross sections are presented in Table 1 for each energy and shown in Figs. 3(a) and 3(b) in comparison with the results of other experimentsΒ [8, 9, 10, 14]. The systematic uncertainty mainly comes from the difference in Ο‡2superscriptπœ’2\chi^{2} distributions for simulation and experimental data and was estimated as 151515%. Our results for the cross section of the process e+​eβˆ’β†’Ο‰β€‹Ο€+β€‹Ο€βˆ’β†’superscript𝑒superscriptπ‘’πœ”superscriptπœ‹superscriptπœ‹e^{+}e^{-}\to\omega\pi^{+}\pi^{-} are higher than those from DM2, but they are not incompatible within the large statistical and systematic uncertainties. The cross section of the process e+​eβˆ’β†’Ξ·β€‹Ο€+β€‹Ο€βˆ’β†’superscript𝑒superscriptπ‘’πœ‚superscriptπœ‹superscriptπœ‹e^{+}e^{-}\to\eta\pi^{+}\pi^{-} agrees with the results of other measurements by ND and DM2 as well as with the preliminary results from CMD-2 [14] obtained using the decay mode Ξ·β†’Ξ³β€‹Ξ³β†’πœ‚π›Ύπ›Ύ\eta\to\gamma\gamma.

The number of background events found in this way is consistent with the estimate based on the value of the cross section for the process e+​eβˆ’β†’Ο€+β€‹Ο€βˆ’β€‹Ο€+β€‹Ο€βˆ’β†’superscript𝑒superscript𝑒superscriptπœ‹superscriptπœ‹superscriptπœ‹superscriptπœ‹e^{+}e^{-}\to\pi^{+}\pi^{-}\pi^{+}\pi^{-} obtained by CMD-2 [12]. One can therefore conclude that the cross section of the five pion production is saturated by the ω​π+β€‹Ο€βˆ’πœ”superscriptπœ‹superscriptπœ‹\omega\pi^{+}\pi^{-} and η​π+β€‹Ο€βˆ’πœ‚superscriptπœ‹superscriptπœ‹\eta\pi^{+}\pi^{-} intermediate states.

To understand whether the data allow a small contribution from the Ο€+β€‹Ο€βˆ’β€‹Ο€+β€‹Ο€βˆ’β€‹Ο€0superscriptπœ‹superscriptπœ‹superscriptπœ‹superscriptπœ‹superscriptπœ‹0\pi^{+}\pi^{-}\pi^{+}\pi^{-}\pi^{0} final state other than ω​π+β€‹Ο€βˆ’πœ”superscriptπœ‹superscriptπœ‹\omega\pi^{+}\pi^{-} or η​π+β€‹Ο€βˆ’πœ‚superscriptπœ‹superscriptπœ‹\eta\pi^{+}\pi^{-}, the following analysis was carried out. A strict cut on Ο‡2<1superscriptπœ’21\chi^{2}<1 was imposed considerably suppressing the background from Ο€+β€‹Ο€βˆ’β€‹Ο€+β€‹Ο€βˆ’superscriptπœ‹superscriptπœ‹superscriptπœ‹superscriptπœ‹\pi^{+}\pi^{-}\pi^{+}\pi^{-}. The expected shape of the mΟ€+β€‹Ο€βˆ’β€‹Ο€0subscriptπ‘šsuperscriptπœ‹superscriptπœ‹superscriptπœ‹0m_{\pi^{+}\pi^{-}\pi^{0}} distribution was determined from a simulation of the process e+​eβˆ’β†’Ο€+β€‹Ο€βˆ’β€‹Ο€+β€‹Ο€βˆ’β€‹Ο€0β†’superscript𝑒superscript𝑒superscriptπœ‹superscriptπœ‹superscriptπœ‹superscriptπœ‹superscriptπœ‹0e^{+}e^{-}\to\pi^{+}\pi^{-}\pi^{+}\pi^{-}\pi^{0} assuming a constant matrix element. Next a fit of the experimental distribution of mΟ€+β€‹Ο€βˆ’β€‹Ο€0subscriptπ‘šsuperscriptπœ‹superscriptπœ‹superscriptπœ‹0m_{\pi^{+}\pi^{-}\pi^{0}} was performed assuming all four contributions discussed above. Results of this fit in terms of the upper limits on the possible contribution to the cross section of Ο€+β€‹Ο€βˆ’β€‹Ο€+β€‹Ο€βˆ’β€‹Ο€0superscriptπœ‹superscriptπœ‹superscriptπœ‹superscriptπœ‹superscriptπœ‹0\pi^{+}\pi^{-}\pi^{+}\pi^{-}\pi^{0} production at 95% confidence level are shown in the last column of Table 1. One can see that these limits are typically much smaller than the ω​π+β€‹Ο€βˆ’πœ”superscriptπœ‹superscriptπœ‹\omega\pi^{+}\pi^{-} cross section indicating the smallness of other intermediate mechanisms of Ο€+β€‹Ο€βˆ’β€‹Ο€+β€‹Ο€βˆ’β€‹Ο€0superscriptπœ‹superscriptπœ‹superscriptπœ‹superscriptπœ‹superscriptπœ‹0\pi^{+}\pi^{-}\pi^{+}\pi^{-}\pi^{0} production.

Results of the fit are shown in Figs.Β 3(a), 3(b) and presented in Table 2. The Ο‡2superscriptπœ’2\chi^{2}/n.d.f. value is equal to 15.1/19 and 37/31 for ω​π+β€‹Ο€βˆ’πœ”superscriptπœ‹superscriptπœ‹\omega\pi^{+}\pi^{-} and η​π+β€‹Ο€βˆ’πœ‚superscriptπœ‹superscriptπœ‹\eta\pi^{+}\pi^{-} respectively. Hatched areas show separate contributions for each resonance. One can see that the contributions of ω​(1420)πœ”1420\omega(1420) for ω​π+β€‹Ο€βˆ’πœ”superscriptπœ‹superscriptπœ‹\omega\pi^{+}\pi^{-} and ρ​(1700)𝜌1700\rho(1700) for η​π+β€‹Ο€βˆ’πœ‚superscriptπœ‹superscriptπœ‹\eta\pi^{+}\pi^{-} are negligible compared to the ω​(1600)πœ”1600\omega(1600) and ρ​(1450)𝜌1450\rho(1450) respectively and are not statistically significant. The fit with one resonance only was additionally performed which results in Ο‡2superscriptπœ’2\chi^{2}/n.d.f = 23/23 and Ο‡2superscriptπœ’2\chi^{2}/n.d.f = 43/35 for ω​π+β€‹Ο€βˆ’πœ”superscriptπœ‹superscriptπœ‹\omega\pi^{+}\pi^{-} and η​π+Ο€βˆ’πœ‚πœ‹superscriptπœ‹\eta\pi+\pi^{-} respectively.

To estimate the possible variation of parameters we performed the fit of the ω​π+β€‹Ο€βˆ’πœ”superscriptπœ‹superscriptπœ‹\omega\pi^{+}\pi^{-} cross section under the assumption that the total width is completely determined by the decay Ο‰1,2→ρ​π→π+β€‹Ο€βˆ’β€‹Ο€0β†’subscriptπœ”12πœŒπœ‹β†’superscriptπœ‹superscriptπœ‹superscriptπœ‹0\omega_{1,2}\to\rho\pi\to\pi^{+}\pi^{-}\pi^{0}. In accordance with [15], the branching ratio of the ω​(1420)πœ”1420\omega(1420) is dominated by the Οβ€‹Ο€πœŒπœ‹\rho\pi decay while for the ω​(1600)πœ”1600\omega(1600) it is about ∼similar-to\sim 50 %, so that this assumption does not look completely unreasonable. In this case Ξ“1,2​(s)=Ξ“1,20β‹…Wρ​π​(s)Wρ​π​(m1,2)subscriptΞ“12𝑠⋅subscriptsuperscriptΞ“012subscriptπ‘ŠπœŒπœ‹π‘ subscriptπ‘ŠπœŒπœ‹subscriptπ‘š12\Gamma_{1,2}(s)=\Gamma^{0}_{1,2}\cdot\frac{W_{\rho\pi}(s)}{W_{\rho\pi}(m_{1,2})}, where Wρ​πsubscriptπ‘ŠπœŒπœ‹W_{\rho\pi} is the squared matrix element of the Οβ€‹Ο€πœŒπœ‹\rho\pi decay integrated over the phase space. Ξ“1,20subscriptsuperscriptΞ“012\Gamma^{0}_{1,2} as well as m1,2subscriptπ‘š12m_{1,2}, Ο•italic-Ο•\phi and Οƒ1,2subscript𝜎12\sigma_{1,2} are parameters of the fit. Be+​eβˆ’β€‹Bf​i​nsubscript𝐡superscript𝑒superscript𝑒subscript𝐡𝑓𝑖𝑛B_{e^{+}e^{-}}\,\,B_{fin} presented in TablesΒ 2 and 3 were calculated in accordance with the relation Be+​eβˆ’β€‹Bf​i​n=σ​(m2)12​π​m2subscript𝐡superscript𝑒superscript𝑒subscriptπ΅π‘“π‘–π‘›πœŽsuperscriptπ‘š212πœ‹superscriptπ‘š2B_{e^{+}e^{-}}\,\,B_{fin}=\frac{\sigma(m^{2})}{12\,\pi}\,\,m^{2}.

The fit results of which are presented in TableΒ 3 has Ο‡2superscriptπœ’2\chi^{2}/n.d.f = 13/19 indicating a good fit to this hypothesis. As one can conclude from comparison of TableΒ 2 and TableΒ 3, the parameters of the ω​(1420)πœ”1420\omega(1420) are more or less stable while for the ω​(1600)πœ”1600\omega(1600) the level of their variation is of the order of two standard deviations. More precise experimental information collected in the whole energy range from 1.4 to 2 GeV is obviously necessary to determine unambiguously the properties of the ρ𝜌\rho(770) and Ο‰πœ”\omega(782) excitations.

Ο‰β€‹Ο€β€‹Ο€πœ”πœ‹πœ‹\omega\pi\pi Ξ·β€‹Ο€β€‹Ο€πœ‚πœ‹πœ‹\eta\pi\pi 5Ο€πœ‹\pi
Ec.m.subscript𝐸formulae-sequenceπ‘π‘šE_{c.m.}, L, nb-1 ne​f​fsubscript𝑛𝑒𝑓𝑓n_{eff} ΟƒπœŽ\sigma, nb ne​f​fsubscript𝑛𝑒𝑓𝑓n_{eff} ΟƒπœŽ\sigma, nb ΟƒπœŽ\sigma, nb
MeV 95% CL
1285 536 9.6 Β±plus-or-minus\pm 6.8 0.07 Β±plus-or-minus\pm 0.05 3.2 Β±3.7plus-or-minus3.7\pm 3.7 0.11 Β±plus-or-minus\pm 0.13 0.06
1305 510 15.5 Β±plus-or-minus\pm 4.7 0.20 Β±plus-or-minus\pm 0.06 5.5 Β±2.8plus-or-minus2.8\pm 2.8 0.42 Β±plus-or-minus\pm 0.22 0.12
1325 556 32.6 Β±plus-or-minus\pm 9.2 0.21 Β±plus-or-minus\pm 0.06 13.2 Β±6.8plus-or-minus6.8\pm 6.8 0.54 Β±plus-or-minus\pm 0.28 0.17
1345 440 33.2 Β±plus-or-minus\pm 8.3 0.32 Β±plus-or-minus\pm 0.08 14.5 Β±6.0plus-or-minus6.0\pm 6.0 0.84 Β±plus-or-minus\pm 0.35 0.10
1365 415 30.5 Β±plus-or-minus\pm 6.1 0.40 Β±plus-or-minus\pm 0.08 13.5 Β±7.8plus-or-minus7.8\pm 7.8 0.88 Β±plus-or-minus\pm 0.51 0.11
1380 541 55.4 Β±plus-or-minus\pm 9.0 0.53 Β±plus-or-minus\pm 0.09 49.0 Β±11.4plus-or-minus11.4\pm 11.4 1.81 Β±plus-or-minus\pm 0.43 0.19
Total 2998 176.8Β±plus-or-minus\pm 18.4 β€” 98.9 Β±17.2plus-or-minus17.2\pm 17.2 β€” β€”
Table 1:
Refer to caption
(a) e+​eβˆ’β†’Ο‰β€‹Ο€+β€‹Ο€βˆ’β†’superscript𝑒superscriptπ‘’πœ”superscriptπœ‹superscriptπœ‹e^{+}e^{-}\to\omega\pi^{+}\pi^{-} cross section.
Refer to caption
(b) e+​eβˆ’β†’Ξ·β€‹Ο€+β€‹Ο€βˆ’β†’superscript𝑒superscriptπ‘’πœ‚superscriptπœ‹superscriptπœ‹e^{+}e^{-}\to\eta\pi^{+}\pi^{-} cross section.
Figure 3: Energy dependence of the cross sections for the processes under study: (a) - e+​eβˆ’β†’Ο‰β€‹Ο€+β€‹Ο€βˆ’β†’superscript𝑒superscriptπ‘’πœ”superscriptπœ‹superscriptπœ‹e^{+}e^{-}\to\omega\pi^{+}\pi^{-}, (b) - e+​eβˆ’β†’Ξ·β€‹Ο€+β€‹Ο€βˆ’β†’superscript𝑒superscriptπ‘’πœ‚superscriptπœ‹superscriptπœ‹e^{+}e^{-}\to\eta\pi^{+}\pi^{-}. In each Figure individual contributions of two higher resonances are shown by hatched areas. The inserts show the energy range studied by CMD-2 in larger scale.
ω​(1420)πœ”1420\omega(1420) ω​(1600)πœ”1600\omega(1600) ρ​(1450)𝜌1450\rho(1450) ρ​(1700)𝜌1700\rho(1700)
σ​(m2)𝜎superscriptπ‘š2\sigma(m^{2}),nb 0.31Β±0.27plus-or-minus0.310.270.31\pm 0.27 2.41Β±0.33plus-or-minus2.410.332.41\pm 0.33 2.53Β±0.58plus-or-minus2.530.582.53\pm 0.58 0.29Β±0.24plus-or-minus0.290.240.29\pm 0.24
mπ‘šm, Mev 1329Β±64plus-or-minus1329641329\pm 64 1652Β±35plus-or-minus1652351652\pm 35 1421Β±15plus-or-minus1421151421\pm 15 β€”
ΓΓ\Gamma, MeV 198Β±73plus-or-minus19873198\pm 73 284Β±31plus-or-minus28431284\pm 31 211Β±31plus-or-minus21131211\pm 31 β€”
Ο•italic-Ο•\phi, rad 0 3.3Β±0.3plus-or-minus3.30.33.3\pm 0.3 0 1.9Β±0.5plus-or-minus1.90.51.9\pm 0.5
Be+​eβˆ’β€‹Bf​i​nβ‹…10βˆ’7β‹…subscript𝐡superscript𝑒superscript𝑒subscript𝐡𝑓𝑖𝑛superscript107B_{e^{+}e^{-}}\,\,B_{fin}\cdot 10^{-7} 0.37Β±0.32plus-or-minus0.370.320.37\pm 0.32 4.5Β±0.6plus-or-minus4.50.64.5\pm 0.6 3.5Β±0.8plus-or-minus3.50.83.5\pm 0.8 0.6Β±0.5plus-or-minus0.60.50.6\pm 0.5
Table 2: Parameters from the fit by two resonances from Figs.Β 3(a),3(b)
ω​(1420)πœ”1420\omega(1420) ω​(1600)πœ”1600\omega(1600)
σ​(m2)𝜎superscriptπ‘š2\sigma(m^{2}), nb 0.10Β±0.10plus-or-minus0.100.100.10\pm 0.10 1.82Β±0.32plus-or-minus1.820.321.82\pm 0.32
mπ‘šm, MeV 1373Β±70plus-or-minus1373701373\pm 70 1705Β±26plus-or-minus1705261705\pm 26
ΓΓ\Gamma, MeV 188Β±45plus-or-minus18845188\pm 45 370Β±25plus-or-minus37025370\pm 25
Ο•italic-Ο•\phi, rad 0 2.3Β±1.0plus-or-minus2.31.02.3\pm 1.0
Be+​eβˆ’β€‹Bf​i​nsubscript𝐡superscript𝑒superscript𝑒subscript𝐡𝑓𝑖𝑛B_{e^{+}e^{-}}\,\,B_{fin} (0.13Β±0.13)​  10βˆ’7plus-or-minus0.130.13superscript107(0.13\pm 0.13)\,\,10^{-7} (0.36Β±0.06)​  10βˆ’6plus-or-minus0.360.06superscript106(0.36\pm 0.06)\,\,10^{-6}
Table 3: Parameters from the fit of the ω​π+β€‹Ο€βˆ’πœ”superscriptπœ‹superscriptπœ‹\omega\pi^{+}\pi^{-} cross section by two resonances with the energy dependent width.

4 Conclusions

The cross section of e+​eβˆ’superscript𝑒superscript𝑒e^{+}e^{-} annihilation into five pions has been measured in the energy range 1.28 - 1.38 GeV using the CMD-2 detector. The cross section is saturated by the contributions of ω​π+β€‹Ο€βˆ’πœ”superscriptπœ‹superscriptπœ‹\omega\pi^{+}\pi^{-} and η​π+β€‹Ο€βˆ’πœ‚superscriptπœ‹superscriptπœ‹\eta\pi^{+}\pi^{-} intermediate mechanisms. The energy dependence of the cross sections is compatible with the generally accepted pattern of two higher mass excitations for both ρ𝜌\rho(770) and Ο‰πœ”\omega(782) mesons, although an acceptable fit was obtained with one isoscalar and one isovector resonace only (ω​(1600)πœ”1600\omega(1600) and ρ​(1450)𝜌1450\rho(1450)). Parameters of the resonances are rather model dependent and more detailed information at c.m. energies above 1.4 GeV is required for their unambiguous determination.

References

  • [1] S.Eidelman, F.Jegerlehner, Z.Phys. C67 (1995) 585.
  • [2] Y.S.Tsai, Phys. Rev. D4 (1971) 2821.
  • [3] S.I.Eidelman, V.N.Ivanchenko, Phys. Lett. B257 (1991) 437.
  • [4] G.Cosme et al., Phys. Lett. 67B (1977) 231.
  • [5] A.Cordier et al., Phys. Lett. 106B (1981) 155.
  • [6] B.Delcourt et al., Phys. Lett. 113B (1982) 93.
  • [7] L.M.Barkov et al., Sov. J. Nucl. Phys. 47 (1988) 393.
  • [8] S.I.Dolinsky et al., Phys. Reports 202 (1991) 99.
  • [9] A.Antonelli et al., Z. Phys. C56 (1992) 15.
  • [10] A.Antonelli et al., Phys. Lett. 212B (1988) 133.
  • [11] G.A.Aksenov et al., Preprint BudkerINP 85-118, Novosibirsk, 1985.
  • [12] R.R.Akhmetshin et al., Phys. Lett. B466 (1999) 392.
  • [13] E.A.Kuraev, V.S.Fadin, Sov. J. Nucl.Phys. 41 (1985) 733.
  • [14] A.S.Popov, Diploma thesis, Novosibirsk State University, 1999.
  • [15] C.Caso et al., Eur. Phys. J. 3 (1998) 1.