Searches for Compositeness at the Tevatron
J. Andrew Green
Iowa State University
Ames, Iowa 50010, USA
agreen@fnal.gov
on behalf of Fermilab.
Presented at Rencontres de Blois June 1, 1999, with more recent searches now included.
A Introduction
The existence of three families of quarks and leptons suggests the possibility of a substructure for these objects [1]. The hypothetical constituents known generically as preons, interact via a new strong interaction called Metacolor. The characteristic energy scale, , for the new interactions is, of course, unknown. The strength of the interactions through a contact term can be written as , where is the square of the energy in the center of mass frame of the (normal) interacting partons, and is the QCD coupling.
The first limit on the size of the atomic nucleus was obtained by Geiger and Mardsen in the Rutherford scattering of particles from nuclei. In an analogous way, we can set a limit on the size of quarks and leptons by observing the scattering of the highest energy quarks and antiquarks at the Fermilab Tevatron at center-of-mass energies of 1.8 TeV for collider experiments, and 0.8 TeV for fixed-target experiments. The collider detectors at Fermilab, CDF and DØ, have performed searches for compositeness, and this paper gives a summary of those searches. Those detectors are general-purpose, have nearly acceptance, and measure lepton and jet energies to high precision. In addition, the neutrino detector, CCFR, which utlilized the 800 GeV proton line at Fermilab has performed a compositeness search.
B Contact Interactions: Indirect Searches for Compositeness
Several previous searches for compositeness relied on direct searches for excited quark states [2]. The searches that we discuss assume that is small compared to the characteristic mass scale, . These are generically called “contact interaction” searches, and each interaction may be regarded as a contact term in the Lagrangian, which has the form
| (1) |
where are the left and right-handed chiral components of the the quark or lepton, and is the sign of each term, where corresponds to destructive, and to constructive interference [1].
Only leading-order calculations are available for compositeness. Hence, the following approximate relation is used to calculate the correction for higher-order contributions:
| (2) |
where , corresponds to the standard model.
The next-to-leading order (NLO) or next-to-leading log (NLL) cross-sections are calculated using the event generators jetrad [3] or the Monte Carlo written by Hamburg et al[4, 5], respectively. The presense of any compositness is expected to contribute to an increase in cross section at large jet and lepton transverse momenta.
Discussed in this paper are the most up-to-date quark-quark and quark-lepton contact interaction searches. Of course, excellent lepton-lepton searches have been accomplished as well [6].
C Quark Compositenss
1 Limits from Dijet Mass Measurements
DØ has measured [7] the ratio of the dijet mass spectrum for jets at pseudorapidities relative to jets at . The resulting cancellation of systematic uncertainties results in an absolute systematic uncertainty of of the ratio.
Predictions for quark compositeness are obtained using the LO pythia event generator [8]. The ratios of these LO predictions with, and without compositeness, are used to scale the jetrad NLO predictions (see Eq. 2), and are compared to data in Fig.1. Limits on models with color singlet (octet), vector, or axial contact interactions were set using an analytic LO calculation [9] rather than pythia. The resulting limits are given in Table I. Models of quark compositeness with a contact interaction scale 2.4 TeV for quark-quark interactions are excluded at the 95% CL. The limits on the scale of can be converted into limits on a flavor-universal coloron [10] resulting in a 95% CL of , where is the mass of the coloron and a parameter of the theory. The comparison is given in Fig. 2.

| Model | ||
|---|---|---|
| (left-left isoscalar) | 2.7 | 2.4 |
| (vector singlet) | 3.2 | 3.1 |
| (axial singlet) | 3.2 | 3.1 |
| (vector octet) | 2.0 | 2.3 |
| (axial octed) | 2.1 | 2.1 |

2 Limits from The Dijet Angular Distribution
At small center of mass scattering angles, , the dijet angular distribution predicted by leading order QCD is proportional to the Rutherford cross section: . It is useful to measure the angular distribution in the variable , rather than , where . The variable facilitates comparison of theory with data. The angular distribution from composite quarks in quark-quark interactions is isotropic. Hence, the measurement of the dijet angular distribution is sensitive to the presence of such new physics. The quantity measured in the dijet angular analysis is , which is measured in bins of dijet mass . Figure 3 depicts the angular distribution as measured[11] by DØ for .


To remove the point to point correlated errors, the distribution can be described by a single parameter, =N(), which is the ratio of the number of events with to the number between . The CDF[12] analysis uses , and DØ[11] uses . Figure 4 exhibits measured by CDF as a function of for two different renormalization scales, along with the predictions for different compositeness scales. The dijet angular distribution from QCD was calculated using the jetrad event generator. The predictions for quark compositeness scale are obtained using a LO analytic calculation[1]. The ratio of these LO predictions with compositeness, to the LO with no compositeness, is used again to scale the jetrad NLO predictions.
Analysis of the CDF data exludes models with 2.1 TeV and 2.2 TeV. In addition, DØ uses their measurements to place limits on the production of colorons, requiring (see Fig. 2).
3 Limits from Large
DØ has also used the variable to set limits on quark compositeness based on [13]. By treating the event as a whole, this analysis complements the other searches for compositeness. It studies the compositeness of left-handed quarks in the left-left isoscalar contact term of the Lagrangian given in [1]. The scale parameter for this term is .
The events are chosen to have , well above the contribution expected from top quarks that peaks near . Jets with and are included in the calculation of for each event. In addition, the events are required to have at least one jet with . Other cuts are applied to reduce the instrumental backgrounds, e.g. from mis-vertexing. The only important backgrounds considered are from such instrumental sources.
Figure 5 displays the fractional deviation between the data and the Monte Carlo for the CTEQ4M PDF [14] with renormalization scale . For values between and , pythia[8] is used to simulate the effects of quark compositeness to leading order. This leading order calculation is scaled using Eq. 2, where jetrad is used to compute the NLO component. The results for composite quarks relative to expectations from the standard model are shown in Fig. 5 for and . The ratios are found to be independent of the pythia renormalization scale.
As seen in Fig. 5, quark compositeness would produce a rise in the cross section as a function of . Changes in renormalization scale affect the absolute cross section, but not the shape of the distribution. Cross sections calculated using CTEQ4M or MRST [15] PDFs differ in normalization but only slightly in shape.
The measured distribution above is well modeled by the jetrad (NLO QCD) event generator. No evidence is found for compositeness in quarks, and the data are used to set limits on compositeness. As seen in Table II, the limits are not greatly affected by choice of PDF. The depencence of the 95% CL limit is also studied as a function of renormalization scale, and shows little effect on the limits. The limits for are not given, but are nearly identical (slightly higher than on ).
| CTEQ4A1 | 2.0 | CTEQ4A2 | 2.0 | CTEQ4M | 1.9 |
| CTEQ4A4 | 1.9 | CTEQ4A5 | 1.9 | ||
| MRSTGU | 2.0 | MRSTGD | 2.1 | MRST | 2.0 |
D Quark-Lepton Compositeness
1 Neutrino-Nucleon Scattering
The CCFR experiment used the Fermilab 800 GeVproton beam directed at a Beryllium-Oxide target to produce a beam of neutrinos (86% , 12% , and 2% ()) with a mean energy of 125 GeV. The ’s are produced from decays of secondaries downstream from the BeO target. The CCFR detector was a neutrino sampling calorimeter with the ability to resolve minimum-ionizing tracks (mostly from muons) and determine shower energy. The CCFR experiment ran from 1984 to 1988 and scatterings pass typical analysis cuts. This detector has evolved to be what is now known as NuTeV, which used an experimental program of switching between and beams to drastically reduce systematic errors and improve measurements of quantities such as , and [16].
The primary goal of these detectors was to do high-statistics studies of charged and neutral current interactions via scattering. Most of these studies rely on measuring the ratio of the Neutral Current (NC) to Charged Current (CC) interactions seen in the detector. The NC interactions produce a compact shower of energy, while the CC interactions produce a shower, with a long () minimum-ionizing trail left by the or . An important correction to the ratio comes from the () flux component, where the CC interaction produces ’s that, unlike ’s, cannot as easily be distinguished from the hadronic shower in a full range of energies. Such events can fake the NC signature.
The ratio is used to measure the coupling, , of the boson to quarks, where the error in the comparison of to theory is about 0.6%. With this measurement, CCFR has set limits on quark-neutrino contact interactions [17]. Table III shows these limits.
The NuTeV collaboration will soon provide complimentary and more precise information which can further constrain these contact interactions [16].
| Interaction | (TeV) | (TeV) |
|---|---|---|
| LL | 4.7 | 5.1 |
| LR | 4.2 | 4.4 |
| RL | 1.3 | 1.8 |
| RR | 3.9 | 5.2 |
| VV | 8.0 | 8.3 |
| AA | 3.7 | 5.9 |
2 Drell-Yan Production
Both CDF[18] and DØ [19] have placed limits on the combined quark-electron compositeness[20] scale by analyzing Drell-Yan dilepton production.
CDF has measured the Drell-Yan cross section for both electrons and muons, satisfying for each lepton (see Fig. 6). The backgrounds to the signal from QCD jets mimicking electrons, from , , and heavy quark production, are estimated using data, and subsequently subtracted. The Drell-Yan production cross section is based on an NLL calculation[5], with and the data normalized to the prediction in the mass range between 50 and 150 GeV/c2. The data are then used to place limits on the combined quark-electron compositeness (see Table IV).

| CDF | DØ | |||||||
|---|---|---|---|---|---|---|---|---|
| Model | ||||||||
| LL | 2.5 | 3.7 | 2.9 | 4.2 | 3.1 | 4.3 | 3.3 | 4.2 |
| LR | 2.8 | 3.3 | 3.1 | 3.7 | 3.3 | 3.9 | 3.4 | 3.6 |
| RL | 2.9 | 3.2 | 3.2 | 3.5 | 3.3 | 3.7 | 3.3 | 3.7 |
| RR | 2.6 | 3.6 | 2.9 | 4.0 | 3.0 | 4.2 | 3.3 | 4.0 |
| VV | 3.5 | 5.2 | 4.2 | 6.0 | 5.0 | 6.3 | 4.9 | 6.1 |
| AA | 3.8 | 4.8 | 4.2 | 5.4 | 4.5 | 5.6 | 4.7 | 5.5 |
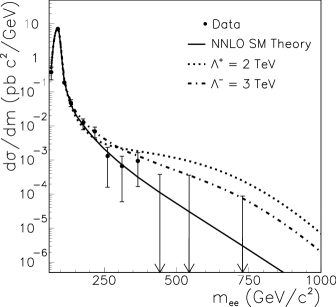
DØ has also measured the Drell-Yan cross section for electrons satisfying either or (Fig. 7). DØ measures the contribution to the cross section from misidentified QCD events, and other processes, using a combination of data and pythia Monte Carlo. The production cross section for Drell-Yan is calculated using an NNLO prediction[4]. Limits are placed on various models of quark-electron compositeness (Table IV).
DØ and CDF rule out models of quark-electron compositeness with interaction scales below 2.5 to 6.3 TeV, depending on the details of the model.
E Conclusion
The Fermilab experiments, CDF, DØ, and CCFR have shown that predictions from the Standard Model are in excellent agreement with the data, and there is no evidence for compositeness in quarks below a scales from 2-8 TeV.
The next run of the Tevatron, beginning in early 2001, will reach far greater luminosities, and provide more opportunity for finding new physics at higher mass scales.
F Acknowledgements
The author would like to acknowledge assistance from Iain Bertram in the preparation of the talk and this proceeding.
REFERENCES
-
[1]
E. Eichten, K. Lane, and M.E. Peskin,
Phys. Rev. Lett. 50, 811 (1983);
E. Eichten, I. Hinchcliffe, K. Lane, and C. Quigg, Rev. Mod. Phys. 56, 579 (1984); Addendum - ibid. 58 1065; K. Lane, hep-ph/9605257 (1996). -
[2]
CDF Collaboration, F. Abe et al.,
Phys. Rev. D 55, 5263 (1997), hep-ex/9702004;
CDF Collaboration , F. Abe et al., Phys. Rev. Lett. 74, 3538 (1995), hep-ex/9501001 ;
DØ Collaboration, B. Abbott et al., FERMILAB-CONF-97-356-E;
L3 Collaboration, Adriani et al., Phys. Rep. 236, 1 (1993), ;
ALEPH Collaboration, Decamp et al., Phys. Rep. 216, 253 (1992); - [3] W. Giele, E. Glover, and D. Kosower, Nucl. Phys. B 403, 633 (1993), hep-ph/9302225.
- [4] R. Hamburg, W.L. Van Neervan and T. Maatsura, Nucl. Phys. B 359, 343 (1991),
-
[5]
A.D. Martin et al., Phys. Lett. B 354, 155 (1995),
hep-ph/9502336;
P.J. Sutton et al., Phys. Rev. D 45, 2349 (1992). - [6] OPAL Collaboration, G. Abbiendi et al., Eur. Phys. J. C 6, 1 (1999), hep-ex/9808023.
- [7] DØ Collaboration, B. Abbot et al., Phys. Rev. Lett. 82, 2457 (1999), hep-ex/9807014.
- [8] T. Sjöstrand, Comp. Phys. Comm. 82, 74 (1994). pythia 5.7 only contains the left-left isoscalar model of quark compositeness.
- [9] R.S. Chivukula, A.G. Cohen and E.H. Simmons, Phys. Lett. B 380 92, (1996), hep-ph/9603311.
- [10] I.A. Bertram and E.H. Simmons, Phys. Lett. B 443, 347 (1998), hep-ph/9809472.
- [11] DØ Collaboration, B. Abbott et al., Phys. Rev. Lett. 80, 666 (1998), hep-ex/9707016.
-
[12]
CDF Collaboration, F. Abe et al.,
Phys. Rev. Lett. 77, 5336 (1996),
erratum — ibid. 78, 4307 (1997), hep-ex/9609011.
CDF Collaboration, F. Abe et al., Phys. Rev. Lett. 69, 2896 (1992).
CDF Collaboration, F. Abe et al., Phys. Rev. Lett. 62, 3020 (1989). - [13] DØ Collaboration, B. Abbot et al., submitted to Phys. Rev. D, hep-ex/9912023.
- [14] H.L. Lai et al., Phys. Rev. D 55, 1280 (1997), hep-ph/9606399.
- [15] A.D. Martin et al., Eur. Phys. J. C 4 463 (1998), hep-ph/9803445.
-
[16]
NuTeV Collaboration, G.P. Zeller et al.,
hep-ex/9906024;
K. McFarland et al., hep-ex/9806013. - [17] CCFR Collaboration, K. McFarland et al., Eur. Phys. J. C 1, 509 (1998), hep-ex/9701010.
- [18] CDF Collaboration, F. Abe et al., Phys. Rev. Lett. 79, 2198 (1997).
- [19] DØ Collaboration, B. Abbott et al., hep-ex/9812010, Submitted to Phys. Rev. Lett.
- [20] T. Lee, Phys. Rev. D 55, 2591 (1997), hep-ph/9605429.